Introduction
Statistics and probability have been applied in various fields. There is no doubt that statistics is a multifaceted concept with a myriad of application. (Fox 173). With this in mind, it is worth noting that there is a number of statistical analysis having varied applications and need to be mastered. This paper exclusively deals with regression analysis.
It is worth noting that regression analysis encompasses mechanisms aimed at modelling and analyzing two or more variables. The aim of the analysis to help individuals from understand “how the typical value of the dependent variable changes when any of the independent variables is varied, while the other independent variables are held fixed” (Sykes 12).
Concept of regression analysis
Regression analysis is used to examine relationship between a metric independent variable and one or more metric independent variables. It is worth noting that there are instances where independent metric variables are dichotomous categorical (Sykes 32). The technique is widely employed in various aspects predominantly in forecasting and predicting phenomenon. It is worth mentioning that regression analysis can be used to find out whether a relationship between variables exists; that is if independent variable(s) explain significant changes in the dependent variable. Additionally it helps determine the strength of a given association; how much of the variation in the dependent variable can be explained by the regression equation (Sykes 54). Similarly regression analysis has been used to determine the structure and form of relationship (Freedman 236).
Regression models and assumptions
There are various models developed to carry out regression analysis. Examples include; simple regression that fits linear and non-linear models with a predictor and include least squares as well as resistant methods, box-cox transformation which fits linear model with a predictor in which Y variable is transformed to achieve approximate normality, polynomial regression which entails fitting a polynomial model with a predictor, calibration model concerned with fitting linear model with a predictors followed by solving for X given Y, multiple regression where linear model is fitted with 1 or more predictors, comparison of regression lines entail fitting a regression line or lines for a predictor at every level of a second predictor and testing for significance between intercepts and slopes. Other models include regression model selection, ridge regression, non-linear regression, partial least squares, general linear models, life data regression, regression analysis for proportions and regression analysis for counts (Freedman 345). Due to the fact that the models can not be adequately covered in this paper, multiple regression analysis will be expounded by using an example.
It is worth mentioning that regression analysis is associated with a number of certain classical assumptions. These according to Scott 39 include the following:
- Errors are uncorrelated
- The variables used as predictors are linearly independent
- Sample size chosen fully represents the given population for one to make inferences, forecasts and predictions
- Variance of error is constant throughout the observation
- Variables used as independent are usually measured without any errors
- “The error is a random variable with a mean of zero conditional on the explanatory variables” (Scott 39)
Components of regression analysis
Regression equation has the dependent variable and independent variables carrying the notations Y and X respectively. “Each independent variable is associated with a regression coefficient which describes the strength as well as the sign of the variable’s association to the dependent variable” (Fox 83).
A more general regression equation is given as follows:
Y = β0 + β1X1 + β2X2 + β3X3 + … + βkXk
Estimated as:
Ŷ = a + b1X1 + b2X2 + b3X3 + … + bkXk
Where:
- a = the intercept (constant)
- b = the partial regression coefficient
- Y = dependent or criterion variable
- X = independent or predictor variable
Dependent variable (Y) has been simply defined as the variable that is being modelled, predicted or understood for instance crime rates, rainfall or economic. “This component appears on the left side of the equal sign in regression equation” (Sykes 142). Although we always strive to understand and predict the independent variable, there are set of values known (observed values) that are used to build or calibrate the entire model.
Independent variables are also known as explanatory variables. They are represented in the equation by X and are mainly help us understand the dependent variable under study. These variables are usually located on the right hand side of the equal sign of a regression equation. An example to understand this is when a wireless telecommunication company wants to know the plans it will adopt to ensure they retain as well as attract more customers; among the explanatory variables to be considered may include quality of services offered, the cost of the services, variety of phone selection and high quality voice calls.
Regression coefficient (β) refers to values calculated by the regression tool and represents values for each independent variable which translates to the strength as well as the direction or the type of the association between dependent and independent variables. Fox 271 noted that;
[When the relationship is a strong one, the coefficient is large. Weak relationships are associated with coefficients near zero. β 0 is the regression intercept. It represents the expected value for the dependent variable if all of the independent variables are zero].
Another component is the residuals which refer to unexplained section of the dependent variable. The size of the value indicates how the model fits. It is important to note here that the entire process of regression modelling is an iteration process. This is done till the effective predictors are noted. In the example used to model both company and plan for the wireless company, it is not possible to develop another model that could fully explain it since all the variable that were deemed to be the predictors for the dependent variables were used. To accomplish this we may need to go to the field and ask the respondents to list other variables apart from those they previously indicated to the company’s questionnaires.
To test for significance of the association, regression analysis performs a statistical test resulting to t and p values. A small p- value shows that the probability is small hence the coefficient. This helps use determine how statistically significant an independent variable is to the dependent variable (Fox 145). It is worth noting that those variables having coefficient close to zero plays no major role in explaining or predicting dependent variable (Sykes 205).
R-Squared is the coefficient of multiple determinations and tells us the amount or portion of the variation that can be explained by regression model. The value ranges from 0-100 and at no time would the value be 1.0. A value such as 0.63 for instance is interpreted as ‘the model explains 63% of the variation in the dependent variable’ (Sykes 123)
Practical example
Multiple regression analysis involves a single dependent variable and two or more independent variables. For this case multiple regression analysis will be used to predict and establish the relationship of various attributes contributing to the general features of a company. Currently there is a very stiff competition in the industry of wireless services in the United States of America. Among the major wireless service providers is AT & T which has 70.1 million subscribers and Cingular wireless.
Cingular wireless in 2004 acquired AT &T giving it a national opportunity to provide the services. Two years later, AT & T acquired Bellsouth giving it full control of Cingular Wireless. It has been established that customers were leaving the AT &T Company in favour of other similar companies offering wireless services. A questionnaire was used to establish the reason behind such moves. The findings could help AT & T to adopt management strategies that will ensure it stays competitive in the wireless service industry and meet the aspirations of the customers (Scott 123).
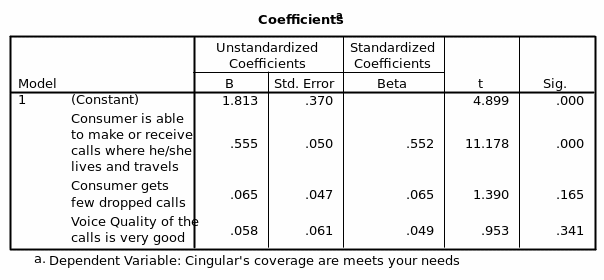
To establish the relationship of various attributes contributing to the general feature of the company, a regression analysis was performed. Coverage was a dependent variable while the ability to make a call from where one was, high voice quality and few chances of calls being dropped were treated as independent variables. The adjusted R Square=0.371, this thus depicted that 37.1% of the relationship between coverage and making and receiving call from anywhere, consumer getting few dropped calls and voice quality of the call being good can be explained by the linear regression model. Since p=0.000, the relationship is significant.
Partial regression coefficients
Coverage is a function of voice quality, few dropped calls and ability of consumers to make calls from anywhere they are; Coverage=1.813+0.555*Ability to make calls from anywhere+0.065*Consumer getting few dropped calls+0.058*Voice quality of the calls being very good (Table 5).
Testing significance of the regression coefficients
In this case the variables that contribute to coverage significantly include; Ability of consumers making call from where they are, t=11.178, p=0.000. Additionally, there is no multi-co-linearity between the variables since all values are less than the standard value of 0.70 this thus suggest that the regression analysis is stable.
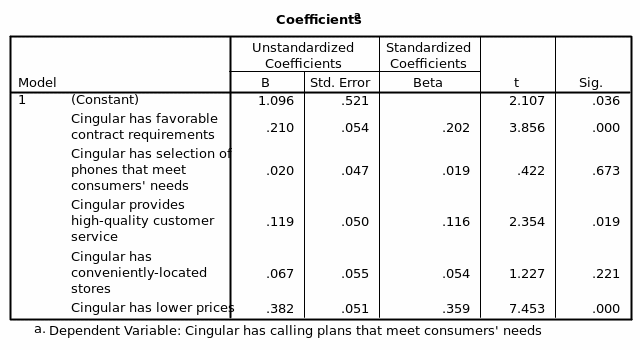
Concerning plans that meet customers need (dependent variable) an association between it and variety of phone selection, high quality customer service, lower prices and high quality voice calls, favourable contracts and location of stores (independent variables) were analyzed. There was a significant relationship between the dependent and independent variables, p=0.000. Adjusted R square is 0.327 suggesting that 32.7% of the variations in the relationship can be explained by the linear regression model. The plan=1.096+0.21*favourable contract requirements+0.02*selection of phones that meet consumers’ needs+0.119*quality customer service+0.067*conveniently located stores+0.382*lower prices (Table 4).
The variables that contribute significantly to the relationship are; Cingular provide high quality customer service, t=4.165, p=0.000 and lower pricest-9.191, p=0.000.
How to attain this (regression analysis)
According to Fox 129, using SPSS version 15.0 to carry out multiple regression analysis, the following steps are followed. Start the software then go to the analyze button>regression>linear. The dependent variable is then selected and moved into the independent box; the same is done to independent variables but they are moved to independent box. The steps that follows is to click on statistics and select ‘Descriptive’ while ensuring that ‘Estimates’ and ‘Models fit’ are checked, click ‘Continue’ then ‘OK’. An out put will be generated that will include model summery, ANOVA and coefficient tables.
Conclusion
It is evident from the review of regression analysis that there are a number of concepts that need to be understood. Similarly certain classical assumptions held when carrying out an analysis need to be noted. From the example used, it is apparent that regression can be carried out to help organization re-think on their strategies when doing business. However, it is worth noting that there are instances that the model developed do not fully explain what contributes to changes in the dependent variable and when this is the case iteration has to be performed. This is time consuming and for this case it will call for questionnaires to be distributed to a target sample for another model to be developed. Lastly single best way to represent multiple regression results is by use of tables and nothing else.
Works cited
Fox, Jones. Applied regression analysis, linear models and related methods. London: Sage, 1997. Print.
Freedman, David. Statistical models: Theory and practice. University of Cambridge: Cambridge University Press, 2005. Print.
Scott, Long. Regression models for categorical and limited dependent variables. Thousand Oaks, CA: Sage Publications, 1997. Print.
Sykes, Alan. An introduction to regression analysis. Chicago working paper in Law & Economics, 2004. Web.
Appendices
Table 4: Regression analysis for Company coverage area meeting customers’ need

Table 5: Regression analysis for plans that meet customers’ needs
