Pareto Chart is an excellent tool that can help to understand the importance of factors affecting the outcome. Pareto analysis is considered one of the seven basic quality tools are often used by quality managers (Ross, 2014). The method is helpful when quality managers want to prioritize the problems or causes of a problem to optimize their efforts (Ross, 2014). The present assignment aimed at creating a Pareto Diagram for the length of stay in hospitals in different states. The Pareto Chart is demonstrated in Figure 1 below.
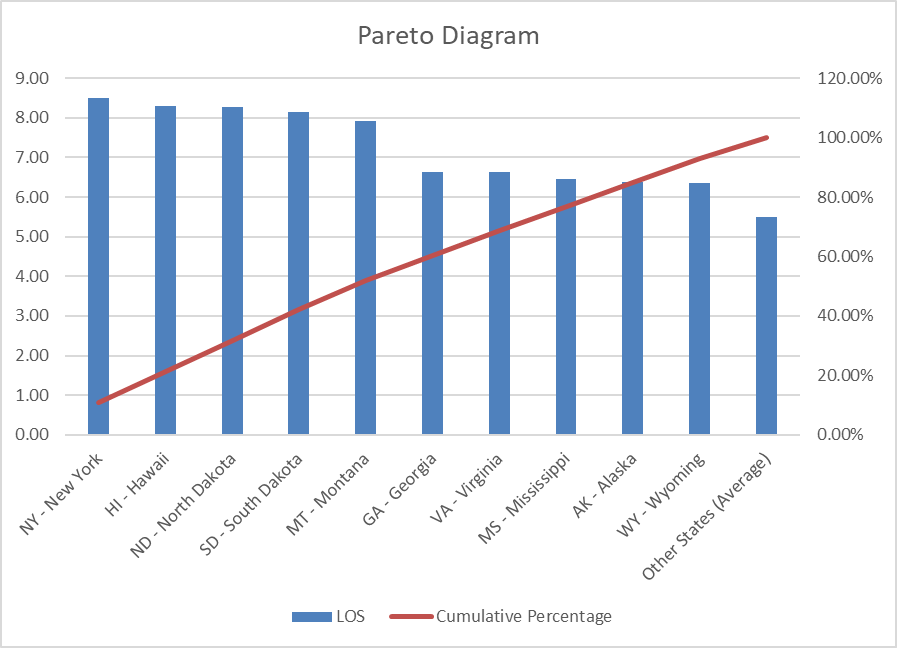
The Pareto chart helped to identify the states that have the longest average stay time. At the same time, the analysis helped to compare these states and the average length of stay in other states. However, the analysis did not reveal any commonality among the states with long lengths of stay. The states are in different geographical locations; they have different sizes, number of hospitals, gross patient revenues, patient days, number of discharges, and staffed beds. Thus, Pareto analysis was not an optimal tool to represent the data.
Statistical Process Control Tools
In general, statistical process control tools are very helpful for quality management. These tools aim at distinguishing between two types of process variation based on statistical methods: common cause variation and special cause variation (Ross, 2014). Seven basic statistical control tools include fishbone diagrams, check sheets, control charts, histograms, Pareto charts, scatter diagrams, and stratification (Ross, 2014). The utilization of these methods is associated with increased productivity, improved operational efficiency, improved customer satisfaction, reduced reaction time to problems, and cost reduction. However, these need to be used properly to achieve the set goal. For instance, Pareto charts can be useful for understanding what factors have the highest impact on a process. However, if used incorrectly, Pareto charts may provide little to no incentives when used incorrectly, which was demonstrated in the present assignment. At the same time, if the same type of quality control tools was used to outline the causes of reimbursement denial, it could demonstrate how much every factor contributes to the overall bad debt accumulation. This information could be used further to select an issue that should be addressed as a top priority. In summary, statistical process control tools need the practice to be used properly.
Application in My Organizational Problem
In my organization, I identified the problem of an increased number of hospital-acquired infections (HAIs). This problem contributes to the growth of bad debt and the decreased reputation of hospitals. However, there are many reasons that contribute to the number of HAI cases, and it would be rational to address the problems that contribute the most. Pareto charts can help to determine the most significant contributor to the problem in a clear coherent manner. If the central problem is adherence to hand hygiene standards, check sheets can help to collect data on how often and which rules were violated. Check sheets can also be used to assess adherence to hand hygiene standards before and after an intervention to understand if it was effective. Thus, statistical process control tools can be very helpful for finishing my project and fighting HAIs.
Reference
Ross, T. K. (2014). Health care quality management: Tools and applications. John Wiley & Sons, Inc.