
Scope and Descriptive Statistics
This research report is based on Pastas R Us, Inc.’s (PRU) restaurant that sells noodle dishes, soups, and salads. The focus of this paper is to conduct a statistical analysis of current business patterns and identify strategic and financial opportunities for PRU based on the data. This approach reduces the likelihood of errors associated with the subjective nature of leadership and increases the reliability of data-driven decisions, rather than personal opinions or subjective assumptions. Thus, the purpose of this report is to examine the collected marketing data for PRU and analyze it in the context of market opportunities for the restaurant.
The analysis used the data set comp1pastasrus.xlsx, which included 8 variables for 74 PRU restaurant locations. The variables included restaurant square footage (in square feet), average number of sales per person, sales trends (in percentages) that may have been positive or negative compared to the previous reporting period, and the percentage of net sales where customers used a loyalty card at checkout.
Additional data included the calculated ratio of total sales to restaurant square footage, the median income and age of the outlet’s customers, and the percentage of county residents with at least a bachelor’s degree. All eight variables were measured at the quantitative level on a numerical scale — meaning that identical instruments for central tendency, variability, and visualization methods were relevant to them. Additionally, a new variable, AnnualSales, was calculated by multiplying each point’s square footage by the sales-to-square-footage ratio.
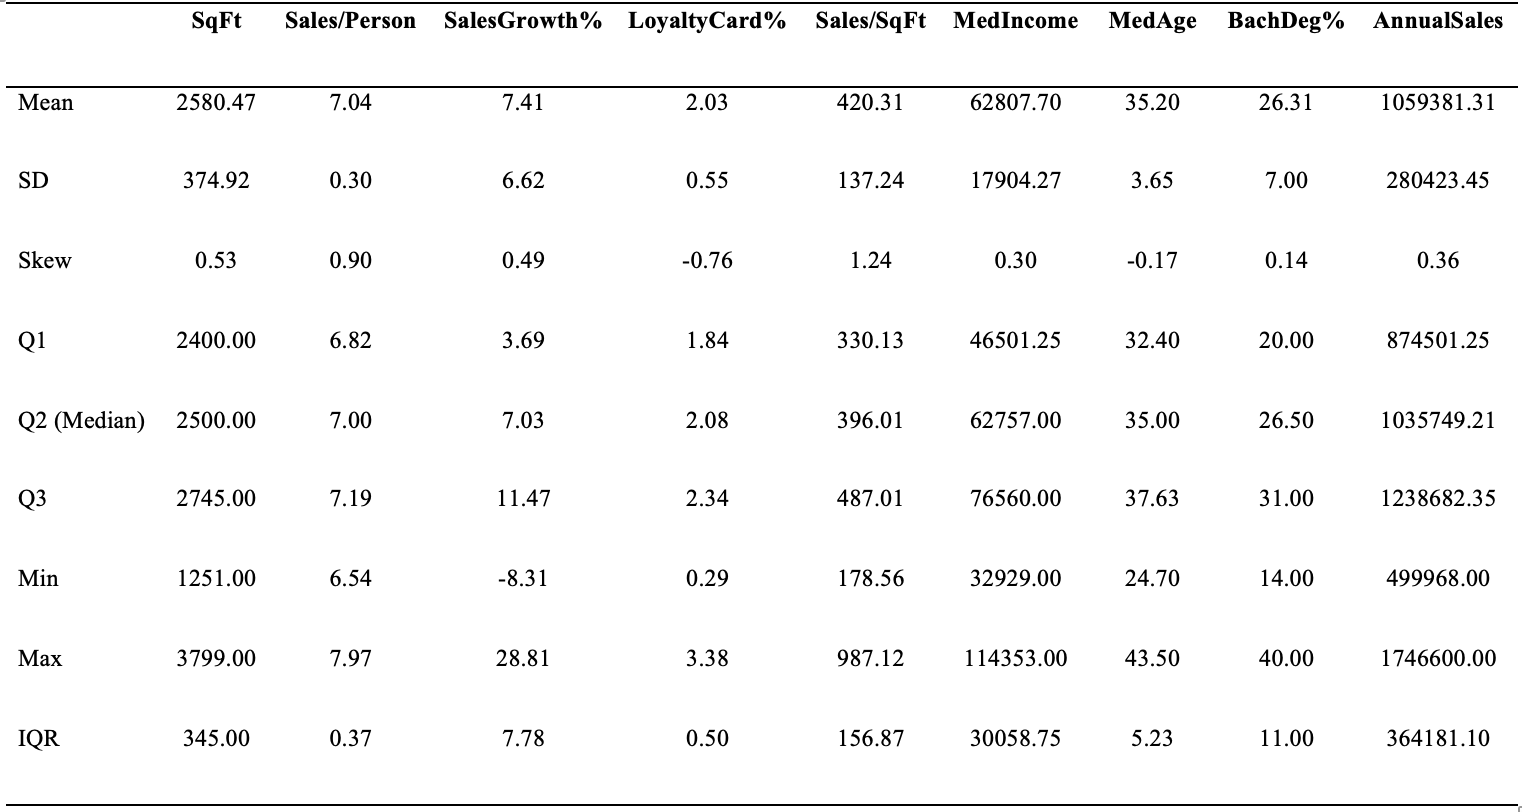
Table 1 summarizes the descriptive statistics for each of the nine variables used. Figure 1 provides a five-number summary for the variable of annual restaurant outlet sales. As the boxplot shows, the median annual sales are $1,035,749.21, slightly below the average. The first and third quartiles for this distribution were $874,501.25 and $1,238,682.35, respectively.
The distribution does not look particularly symmetrical, as the tops of the “whiskers” are larger than their bottoms. This means that the numerical difference between the maximum level and the third quartile is greater than the difference between the minimum level and the first quartile. Notably absent from this distribution are outliers that would otherwise be observed as points outside the boxplot.
Table 1. Results of calculating descriptive statistics for the study variables
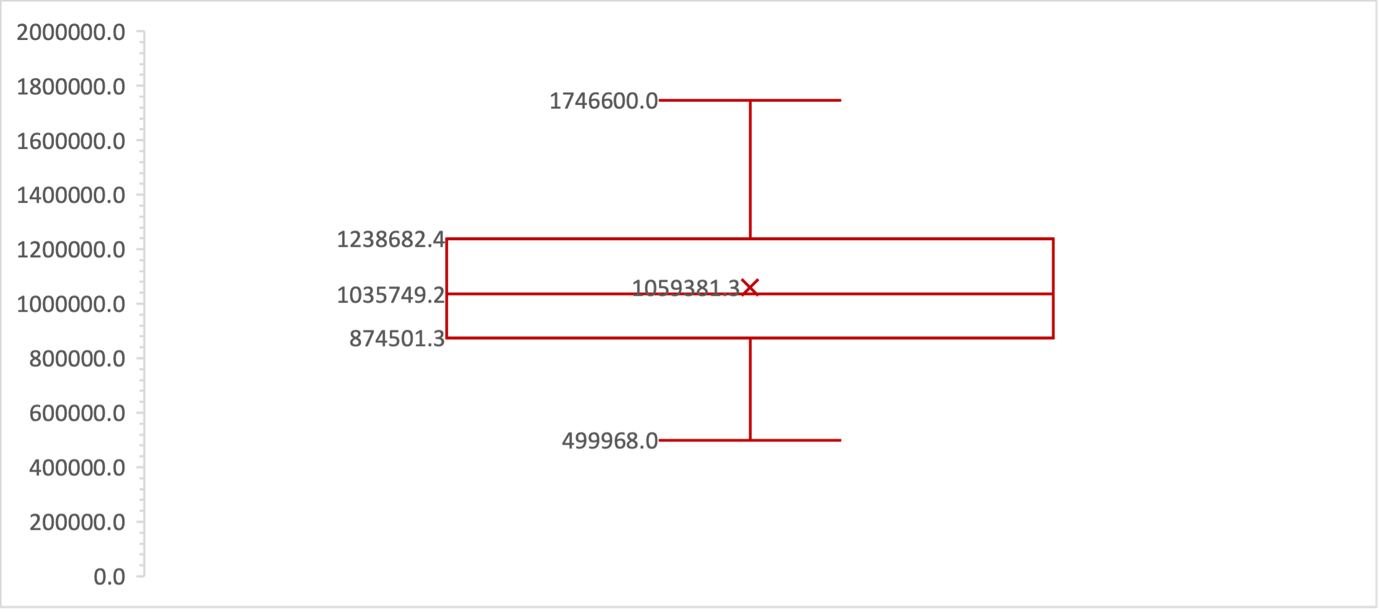
The most appropriate measure of variability is the IQR rather than the standard deviation. In addition, since the distribution is skewed, the use of IQR is more appropriate as this measure focuses more on the central part of the data and is less affected by extreme values (Doane & Seward, 2022). In the context of interpretation, the IQR indicates that 50% of the data fall between $874,501.25 and $1,238,682.35.
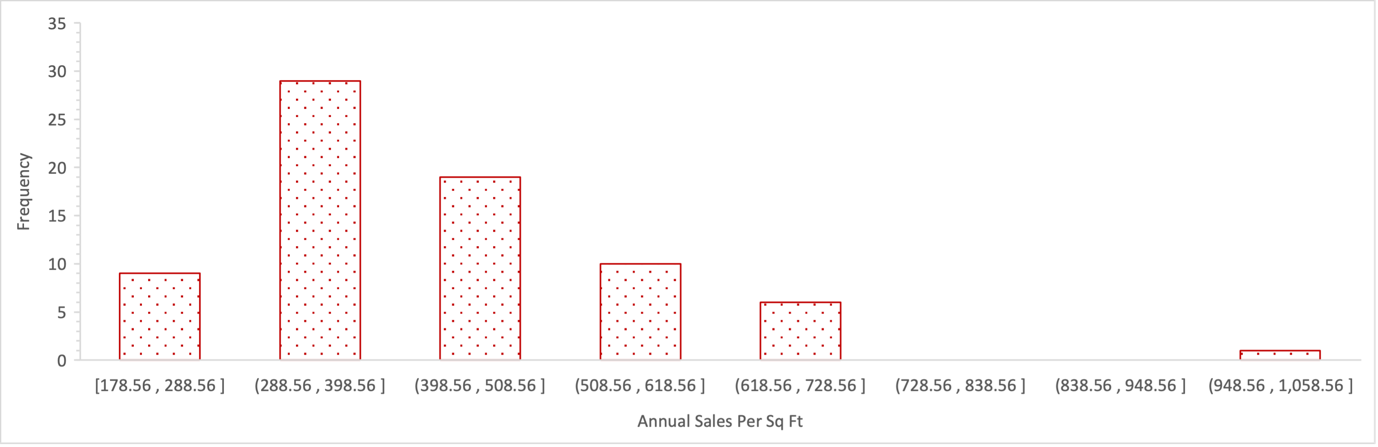
Figure 2 shows a histogram of the ratio of annual sales to restaurant outlet size. The skewness of this distribution is evident: most of the data is concentrated at lower values; thus, the histogram is not symmetrical. The histogram also shows likely outliers lying in the area of $948.56 to $1,058.56 — these are extremely high data points, almost twice the average. This implies that some of the restaurant outliers are making far more sales than others. Since the distribution is not symmetrical, a more appropriate measure of central tendency is the median (Doane & Seward, 2022). Thus, the histogram is asymmetric, with a clear rightward skew.
Analysis
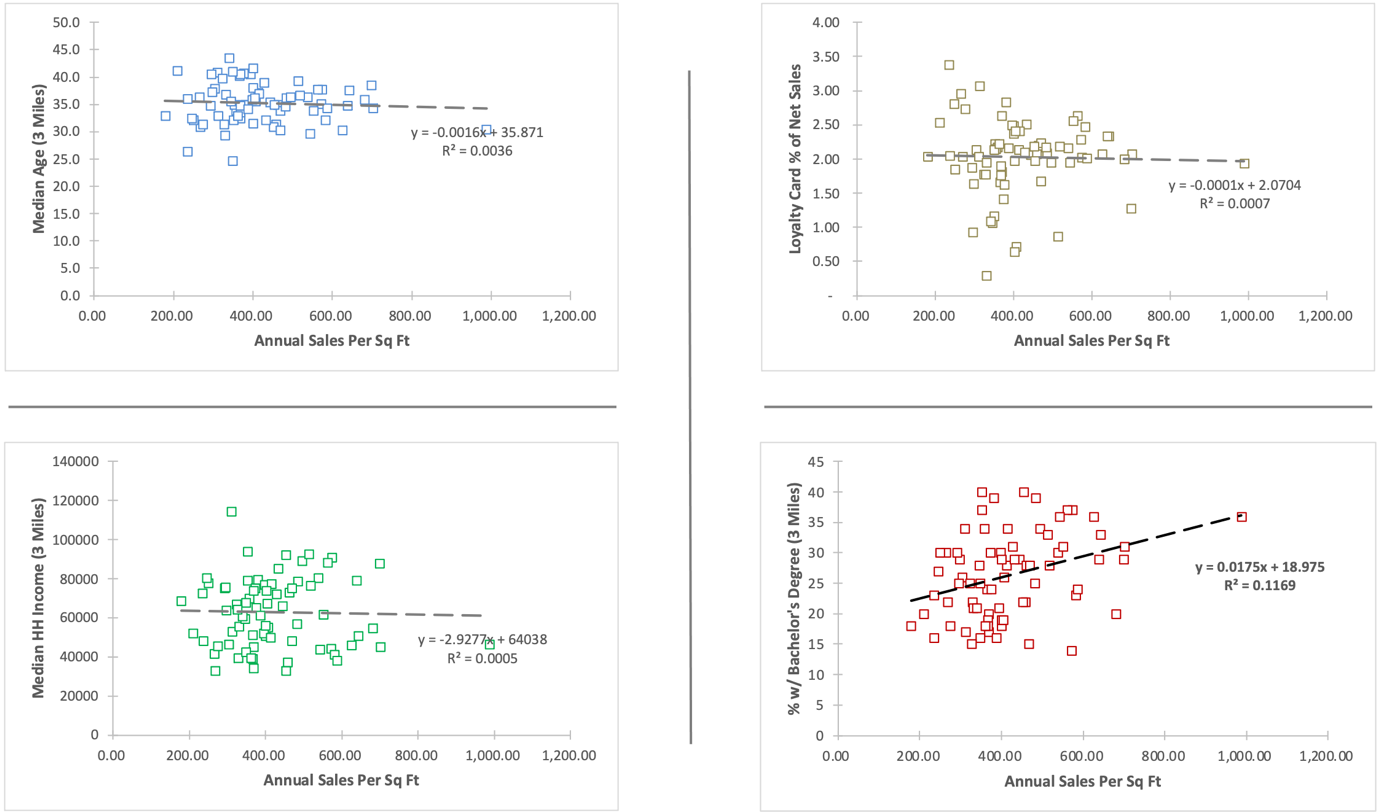
Figure 3 shows four scatter plots of the relationship between the variable ratio of annual sales to restaurant outlet square footage and four other variables: median age, number of loyalty card sales, median household income, and percentage of people with a bachelor’s degree. As can be seen from the resulting visualizations, the relationship between all relationships (except the relationship with the percentage of people with a bachelor’s degree) was negative, as inferred from the slope coefficients) — meaning a fall in one variable while another was rising, and vice versa.
Only the relationship between the ratio of annual sales to restaurant square footage and the percentage of people with a bachelor’s degree showed an upward trend, with growth in one variable being associated with growth in the other. However, the models constructed were not very dependable, as indicated by the coefficients of determination. Assuming their reliability, increases in median age, median income, and loyalty card usage, and decreases in the proportion of people with a bachelor’s degree entail a drop in sales per square foot for restaurant outlets.
Recommendations and Implementation
Based on the findings, a key factor in increasing sales at PRU is the number of county residents with a bachelor’s degree. Lowering the age of the audience and focusing on less affluent residents also makes sense, as it increases sales. The use of loyalty cards had virtually no impact on sales, indicating this criterion is not particularly important in strategy design. It is possible to leave the loyalty program unchanged as it does not have any meaningful impact on sales (Pardoe, 2020).
The proposed marketing positioning targets young people outside the affluent demographic. Since these characteristics drive sales, focusing on them can be a successful solution for PRU. It is recommended to collect additional data on social media usage results (to assess promotional opportunities therein), youth food preferences, and the time of day when young customers are most in demand at a restaurant (Gerasimenko et al., 2021). Implementing these recommendations will allow PRU to build audiences by attracting younger ones.
References
Doane, D., & Seward, L. (2022). Applied statistics in business and economics (7th ed.). McGraw-Hill.
Gerasimenko, V., Andreyuk, D., & Kurkova, D. (2021). Approach for management of brand positioning: Quantification of value matching between brand and target audience. Polish Journal of Management Studies, 24, 1-16.
Pardoe, I. (2020). Applied regression modeling. John Wiley & Sons.