
Introduction
In this paper, hypothesis testing is performed, with the focus on comparing the means between two groups. The null hypothesis indicates that there is no difference in the number of words spelled correctly between two groups of fourth graders. As a consequence, the alternative hypothesis indicates the presence of a similar difference between the groups under consideration. In this case, it is necessary to use the same independent-samples t-test, with a similar division in SPSS into two assumptions about variance within samples.
Data Analysis
Figure 1 shows the SPSS output for the data in the appendix.
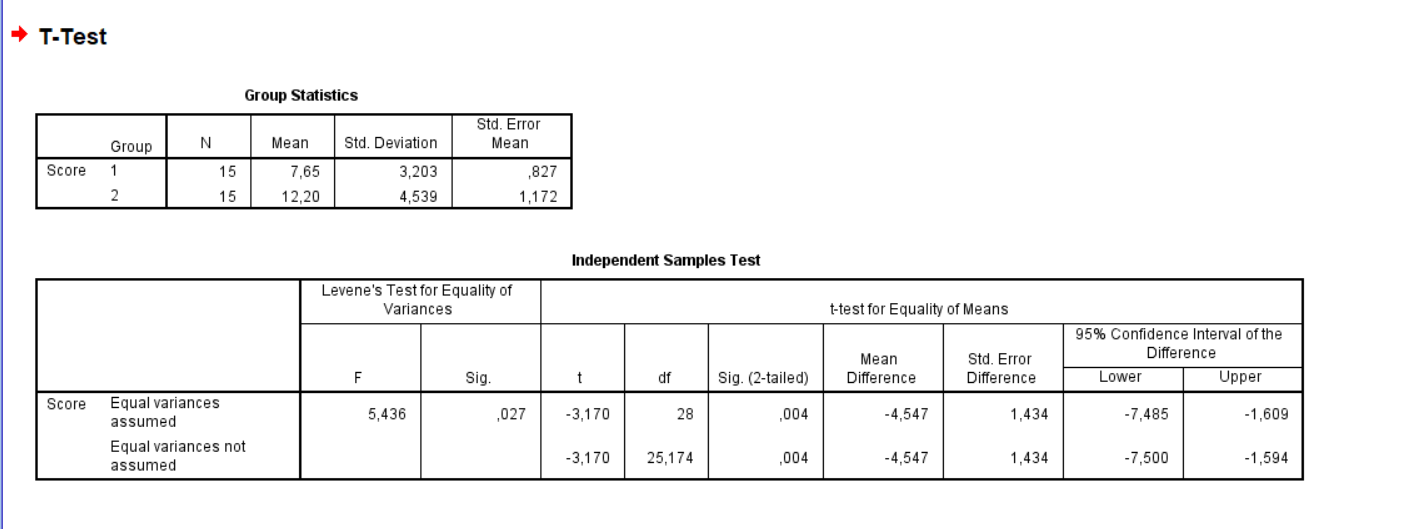
In this case, the distribution between the groups is already equal: 15 people each in the first and second groups. Similarly, the first table presents a summary of descriptive statistics, in which the means differ more noticeably than in the previous question. Still, the standard deviation and the mean of the standard error differ to a lesser extent. Levene’s test for equality of variances shows the value again below 0.05, indicating a statistically significant difference for this indicator. As a consequence, one should primarily rely on the second line of the second part of the table.
However, both lines produce similar results. It is noteworthy that with the difference df, t the indicator turns out to be equal. Significance in both cases is noticeably lower than 0.05 and is equal to 0.004. This information allows us to reject the null hypothesis and to accept the alternative hypothesis. Such results indicate that one of the groups, on average, did indeed pronounce more or fewer, if viewed diametrically, words correctly among the fourth graders. This difference is not an accident, as evidenced by the significance indicator in Figure 1 in SPSS output.
Conclusion
This work examined the implementation of the SPSS independent-samples t-test, which yielded two different results. In the first case, the significance indicator was greater than the acceptable value of 0.05, indicating that the null hypothesis cannot be rejected and that the difference between the two groups is more likely an accident than a regularity. In the second case, this indicator was below 0.05, allowing acceptance of the alternative hypothesis of a significant difference between the two groups. Such skills are critical when conducting studies comparing two groups and allowing appropriate conclusions to be drawn in a balanced and clear manner.
Appendix
Table 1 – Group and Score Data