Introduction
Pair trade is a market-neutral trading technique. The approach helps business persons to benefit from any market conditions. It is made up of two categories of trading. The clusters include statistical arbitrage and convergence trading plan. The pair trading strategy was developed by Gerry Bamberger. In the mid-1980s, the approach was further extended by Nunzio Tartaglia’s cohort. Tartaglia and a group of experts worked on the strategy. They aimed to determine arbitrage prospects in the equities trading. According to Mori and Ziobrowski, the computerized trading systems operated by the use of disciplined consistent filter rules.
The strategy was associated with several successes immediately after its inception. However, despite this stellar performance, the Morgan Stanley Group dissolved in 1989. The disbandment of the association followed recorded poor performance in many years. The issue notwithstanding, pair trading has remained a popular market neutral investment plan. The strategy is regarded by analysts as an important statistical arbitrage method used to manage hedge funds.
Gatev, Goetzmann, and Rouwenhorst note that the technique involves the analytical review of the performance of two allied securities. When the correlation between stocks weakens, the one that trades at a higher price is sold. On its part, the share whose price drops is bought. The process of buying and selling stock is made with the expectation that the risk spread between the two correlated securities will converge. Divergence between pairs is caused by several factors. Such elements include provisional adjustments in supply and demand.
Over the past few years, there several correlated pairs have emerged in the industry. The pairs include Coca-Cola (KO) and Pepsi (PEP), Wal-Mart (WMT) and Target Corporation (TGT), and Dell and Hewlett-Packard. Highly interrelated pairs are often drawn from the same sector. The reason is that they face analogous systematic risks.
In this paper, the author will focus on the correlation between statistical pairs trading and analyst recommendations. To provide a better understanding of pairs, the author will carry out statistical pairs trading by employing the approach used by Gatev and colleagues. The trading will then be compared to Yu’s divergent recommendations.
The rest of the paper is organized as follows: Section 2 is a literature review, section 3 is a hypothesis, section 4 is a methodology, and section 5 involves the description of empirical results. The final part is the conclusion of the study.
Literature Review
Introduction to Pairs Trading
Since the success experienced by Morgan Stanley Group in the mid-1980s, the pair trading strategy has been employed by individuals and companies trading in hedge funds. According to Vidyamurthy, the technique is preferred because it is simple to apply. The simplicity is caused by the fact that the approach comprises of only two assets. The two assets are regarded as having a co-movement. Besides, investors can determine the correlation between assets with ease.
Other factors noted to have led to the widespread use of pair trading include neutrality and the ability to self-finance. For example, the strategy is considered to be market neutral. The reason is that investors trade the spread between equal long and short positions. Also, the approach is said to be self-financing because the profits from short selling stocks balance the capital requirement for the long position. According to Yu, traders who employ pair trading techniques do not need to examine the unconditional cost of securities. The reason is that the spread between pairs is the only important aspect that is taken into consideration in the trading process. In addition, the extensive literature on the strategy reveals that the approach can be adjusted to incorporate quantitative and qualitative statistical data.
Statistical Pairs Trading
Some studies conducted by different scholars in the financial field have shown how statistical trading strategy can be implemented. However, the most referred manuscript is the one written by Gatev and colleagues. In their study, the authors analyze the U.S stock price between 1962 and 1997. The scholars found annual excess returns of up to 12%. Upon getting the results, Gatev et al. opted to continue with their study and examine the prices of securities between 1999 and 2002. The group of experts carried out the extensive research by using out-of-sample tests. Using the simple statistical trading strategy, the average annual excess gain was found to be 10%. (Gatev et al., 800)
The computation of stock prices between 1962 and 2002 shows yearly excess returns of 11%. The move by the scholars to extend their study to 2002 is reported to have helped them control concerns over data snooping found in pairs trading research.
Since 2002, various scholars have managed to estimate statistical probabilities from previous price series by employing the methodology adopted by Gatev and colleagues. One notable research was conducted by Do and Faff. (Do and Faff, 90) The duo conducted their studies from 2002 to 2008. The findings from the two reveal a drop in profits over the years. The same had been observed by Gatev et al. However, Do and Faff differ with Gatev et al. with regards to the factors that lead to reduced returns. According to Do and Faff, decreased profits are not caused by increased hedge fund activities. The two authors note that the primary factor associated with minute gains includes enhanced fundamental risk in the methodology.
A review of information from different scholars reveals the fact that pair trading is associated with the decline of returns over time. However, investors continue to use the strategy. The technique continues to be employed because its profitability is influenced by setting. For example, it is noted that investors in the Brazilian stock market received huge annual returns between 2000 and 2006.
Other scholars who have adopted the strategy used by Gatev et al. include Mori and Ziobrowski. The duo analyzed profit gains from listed stocks and real estate between 1987 and 2008. Their findings reveal that real estate produced huge profits between 1993 and 2000. However, after the year 2000, the returns declined significantly. Mori and Ziobrowski cited some reasons for this decline. One of them was the homogeneousness of real estate stock (Mori and Ziobrowski, 412).
Kanamura, Rachev, and Fabozzi also employed pair trading techniques between 2000 and 2008. The scholars used the future price spread of stocks as a mean-reverting process. In their studies, Kanamura et al. noted the fact that the pair trading strategy could help investors gain profits over long periods (Kanamura et al., 52).
Contrarian Trading Strategies
According to Palicka, pair trading is a form of contrarian business strategy (Palicka, 112). The reason for this is that the approach entails purchasing the weak stock and selling the strong one. The importance and effectiveness of contrarian trading technique has been a subject of study by numerous researchers over the past number of decades. Despite the extensive analysis, debate exists on whether the strategy produces unswerving returns or not. Some scholars argue that the investment methodology leads to abnormal profits. On their part, others differ with the notion. However, the majority of researchers concur that contrarian trading is most suitable in analyzing the trend of short-term stock prices.
Despite contrarian trading strategy being associated with short-term investment periods, some scholars have applied it in long term durations and achieved success. For example, Mori and Ziobrowski analyzed profits generated through contrarian investment over five years (Mori and Ziobrowski, 412). The researchers observed stocks gained minimal profits over the first 12 months. However, the returns increased during the subsequent years of the investment period.
Analyst Recommendations
Several studies have been conducted on the effectiveness of pair trading strategy since the early 1990s. Most of the researchers focusing on this field-based their ideas and studies on the economic justifications point of view (Kanamura et al., 55). In 2011, Yu researched pairs trading from a different perspective (Yu, 80). The analyst based her analysis on divergent analyst recommendation. According to the scholar, proposals focus on information touching on both fundamentals and prices of securities. Due to this, findings from analyst recommendations, if well interpreted, can be of great importance to both individual and company investors.
Bias in recommendations
Numerous studies conducted in the past with regards to investment recommendations show that majority of analysts are often biased when providing investors with information touching on securities forecast. The reason for this is due to conflicts of interest. To this end, Do and Faff note that most experts responsible for making commendations are sell-side analysts (Do and Faff, 82). The business prompts the forecasters to provide investors with exaggerated and optimistic forecasts and recommendations.
One of the studies conducted to determine analyst business was carried out in 2011 by Vidyamurthy (Vidyamurthy, 23). The author found that mutual funds attract huge broker fees. Due to this, analysts provide more favorable recommendations on securities. The securities are in the categories of mutual funds. The analysts do this to get broker deals.
Relative recommendations
Relative recommendations were developed to solve the problems experienced in level suggestions. Galeev and HoWang think that there are numerous types of relative commendations (Galeev and HoWang, 65). However, most scholars focus on one type of relation of recommendation in times. The move is also referred to as changes in the proposal. Research articles written over the last few years reveal that studying advice changes is associated with some benefits. One of the advantages is that the approach helps the analysts and investors to control stickiness concerns. Another importance involves the reduction of analyst business when providing investors with recommendations (Gatev et al., 800). Findings from the study conducted by Do and Faff reveal that change recommendations add more value to investors compared to level proposals (Do and Faff, 90).
Presentation
Hypothesis
In this section of the paper, the author’s primary aim is to determine whether statistical pair trading profits are affected by relative analyst recommendations or not. The study will entail integrating elementary information into different pairs. The hypothesis and thesis will be formed based on the findings from prior studies and theories.
The first study will entail analyzing statistical trading using information and findings from the studies by Gatev et al. and Do and Faff. Results from the two manuscripts reveal the fact that incorporating statistical pairs trading with distance techniques produces huge profits for investors. Besides, the two sets of authors concur that utility sector securities generate the most returns when traded in statistical pairs. On their part, Kanamura et al. are of the view that utilities have essential features that facilitate long-term stable relationships (Kanamura et al., 54). Due to this, they are can also use in short-term pairs and yield positive returns. Based on the findings made by Getav et al. and Do and Faff, the first hypothesis is that statistical pair trading generates huge profits.
The second study which will be used to develop the subsequent hypothesis entails analyzing investments worth in relative analyst recommendations. Research findings from Yu revealed relative proposals between a pair of securities from similar industry and class size are often beneficial to investors (Yu, 85). Also, changes in stock prices last for a period of between one week and six months after recommendations have been issued (Yu, 85). To develop a hypothesis, an analysis of consensus proposals over the six months duration is made. Based on earlier literature the expected result is that the recommendation will be beneficial to investors. Due to this, the second hypothesis is that analysts’ relative advises have great significance in investment.
The final study entails examining whether divergent recommendations affect statistical pairs. Yu notes that divergent proposals impact pairs by narrowing or expanding the spread between securities. The effects lead to compound repercussion on gains to pairs trading. If divergent recommendations are made before a trade commences, the proposals widen the spread between stocks (Palicka, 112). Due to this, the trades generate negative returns. If the commendations are issued after opening a trade they widen or narrow the spread of stocks depending on the direction of pairs and proposal. To control the problem of spread, analysts enforce the Law of One Price.
Data and Methodology
Data description
The data used in this section consists of daily gains and analysts recommendations for common stocks from the utilities sector between 2000 and 2010. The daily returns are gathered from the Centre for Research in Security Prices (CRPS) database. The securities chosen were those with codes of between 10 and 11. The reason for this selection is to limit the sample of common stocks. Utilities sector stocks are selected using the Standard Industrial Classification (SIC) code 49. The two methodologies employed are similar to those used Gatev et al. and Do and Faff. Securities that spent one or more days without trades during the pair formation were not used for the study. The reason for this is to ensure liquidity. Analysts’ recommendations were acquired from the Institutional Brokers Estimates System (IBES) database.
Methodology
The methodology used in this paper follows the approach used by Gatev et al. However, there are areas where the methods and assumptions are different. The pairs are developed over a formation period of 12 months. They are then traded for six months. Similar to Gatev et al. study, only the 20 correlating pairs are evaluated for analyst recommendation.
Formation of pairs
The first step of pair formation entails computing a cumulative value series from the total gain series of all securities (Mori and Ziobrowski, 412). Galeev and Ching, claim it is important to normalize the series to start from 1 at the beginning of the formation period. The primary reason for this is to eradicate level variations in stock prices when calculating squared residuals.
The equation below shows the computation of cumulative value series:
- Vs,t=(1 + rs,t) ∙ Vs,t-1
“Vs,t” is the value of stock “s” at time “t” and “rs,t” is the total return to stock “s” from time “t-1”.
As observed in the normalized value series, each stock is put together with the closest pair based on the sum of daily squared deviations computed from the difference of the two securities series. Gatev et al. note that each stock should be matched with a pair that reduces the amount of squared deviations.
The formula for calculating squared deviations is SSDp=∑(Va,t – Vb,t) 2
SSDP is the sum of squared residuals for pair “p” formed from the securities “a” and “b”. The matching process leads to the emergence of numerous tested pairs.
The formula for calculating pairs is np=ns(ns – 1)/2
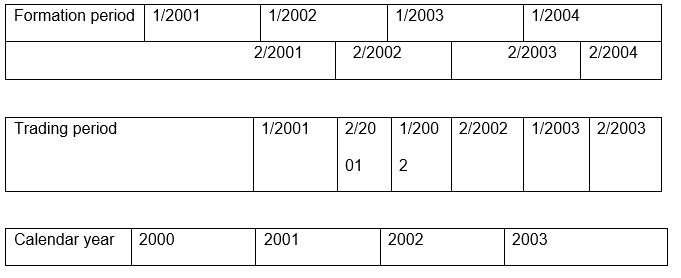
“np” is the number of pairs. On its part, “ns” is the number of single stocks. According to Kanamura et al, a single stock can only belong to one pair. Table 1 in the appendix shows the formation and trading periods’ alternation.
Pairs trading technique
Similar to the study by Gatev et al., the closet 20 pairs trade for six months. Trading is based on value series variations during the entire duration. Also, standard deviations of the differences are quantified during the formation period. In cases where the value of a pair varies by more than two standard deviations, a trade is opened (Do and Faff, 93). Yu notes that standard deviations are measured during the 12 months and kept at a constant.
Return calculation
According to Palicka, the percentage return for a self-financing assortment is not definite. Zero-portfolio does not have invested finances to be used in return computations. In earlier studies, Gatev et al. calculate monthly returns daily using cash flows re-invested during the trading period. Return to a whole portfolio of pairs during the 6 months trading duration is computed as the average returns to all pairs that were traded during the time.
Empirical Results
Trading in statistical pairs
The descriptive results found for statistical trading strategy over the investment period support the finding from previous studies by Do and Faff and Gatev et al. as such, it is evident that statistical pair trading is still beneficial to investors. The six months excess returns is equivalent to the 10% reported by Gatev et al. The median return is 0.97%. The figure is higher than the mean return. The highest gain is 14.7% and the lowest is -28.7%. The results reveal that the median will be higher than the mean.
Pairs are strongly linked during the formation period (Vidyamurthy, 102). However, the correlation breaks during the trading period. According to this study, the mean correspondence in the formation interlude is 0.85. On its part, correlation in the trading period is 0.57. The mean for all pairs in the formation period is 0.40.
Comparison of results
The analysis in this study of stock trends over six months showed that the mean profit acquired was 0.75% with a median of 0.97%. The figure is lower than that found by Gatev et al. However, it is almost similar to the results made by Do and Faff in their study carried out between 2003 and 2008. The mean and median 6-month excess return acquired by Do and Faff was 1.08% and 0.96% (Do and Faff, 88).
Distribution of recommendation
The distribution of analyst recommendations is skewed towards the purchase and strong buy advice. Overly optimistic suggestion to buy stocks has an impact on hold recommendation (Gatev et al., 96). The results support those made by such scholars as Kanamura et al. The mean for all recommendations in the samples analyzed is 2.55. In the 20 pairs, a mean of more than 3 is only observed twice.
Conclusion
Statistical pair trading is commonly used by individuals and company investors. Research has shown the benefits of employing the investment methodology. In this paper, the primary focus was to examine the relationship between relative analyst recommendations and statistical pairs between 2000 and 2010. The results from the research concur with the findings made in most of the studies conducted on pairs trading. In line with earlier studies, the paper provides sufficient evidence to show that statistical pairs produce positive and excess returns. In terms of analyst recommendations, the findings concur with those in earlier studies, which provide that relative suggestions provide investors with valuable information.
Bibliography
Do, Binh, and Robert Faff. “Does Simple Pairs Trading Still Work?.” Financial Analysts Journal 66, no. 4 (2010): 83-95. Web.
Galeev, Roman, and Ching HoWang. Optimal Pairs Trading Using Stochastic Control Approach: A Critical Evaluation. Lund: Department of Automatic Control, Lund University, 2010. Web.
Gatev, Evan, William Goetzmann, and Geert Rouwenhorst. “Pairs Trading: Performance of a Relative-Value Arbitrage Rule.” Review of Financial Studies 19, no. 3 (2006): 797-827. Web.
Kanamura, Takashi, Svetlozar Rachev, and Frank Fabozzi. “A Profit Model for Spread Trading with an Application to Energy Futures.” The Journal of Trading 5, no. 1 (2010): 48-62. Web.
Mori, Masaki, and Alan Ziobrowski. “Performance of Pairs Trading Strategy in the U.S. REIT Market.” Real Estate Economics 39, no. 3 (2011): 409-428. Web.
Palicka, John. Fusion Analysis: Merging Fundamental, Technical, Behavioural, and Quantitative Analysis for Risk-Adjusted Excess Returns. New York: McGraw-Hill, 2012. Web.
Vidyamurthy, Ganapathy. Pairs Trading: Quantitative Methods and Analysis. Hoboken: John Wiley & Sons, 2011. Web.
Yu, Susana. “Pairs-Trading on Divergent Analyst Recommendations.” Journal of Investment Management 9, no. 4 (2011): 75-95. Web.
Appendix