Purpose
The primary objective of this memo is to document the revenue data trends while predicting future sales to identify the specific dates and locations that distinguish them from others.
Data
The data used in the analysis was collected from the firm’s finance department. It was tested for accuracy and presented in Table1 below.
Table 1
Procedure
From the risk assessment procedure, the following risks were identified as potentially harmful to the sales or future revenues.
- Recorded sales occurred
- Accuracy of recorded sales
- Proper period for recording sales
Since Souper Bowl is only located in Maine, the obtained data was disaggregated by store location and store’s daily sales. We used stores’ sales to predict the number of sales in the coming year since we are unaware of any business changes. We noted that sales can be impacted by changes in weather and there have been similar seasonal trends in the last few years, making it easy to predict. However, since seasonal trends can change hence impacting sales, we conducted analyses that considered a risk in changes in weather patterns. The main focus of this analytics is to observe particular observations that are needed for further substantive testing. The conducted analysis is as follows:
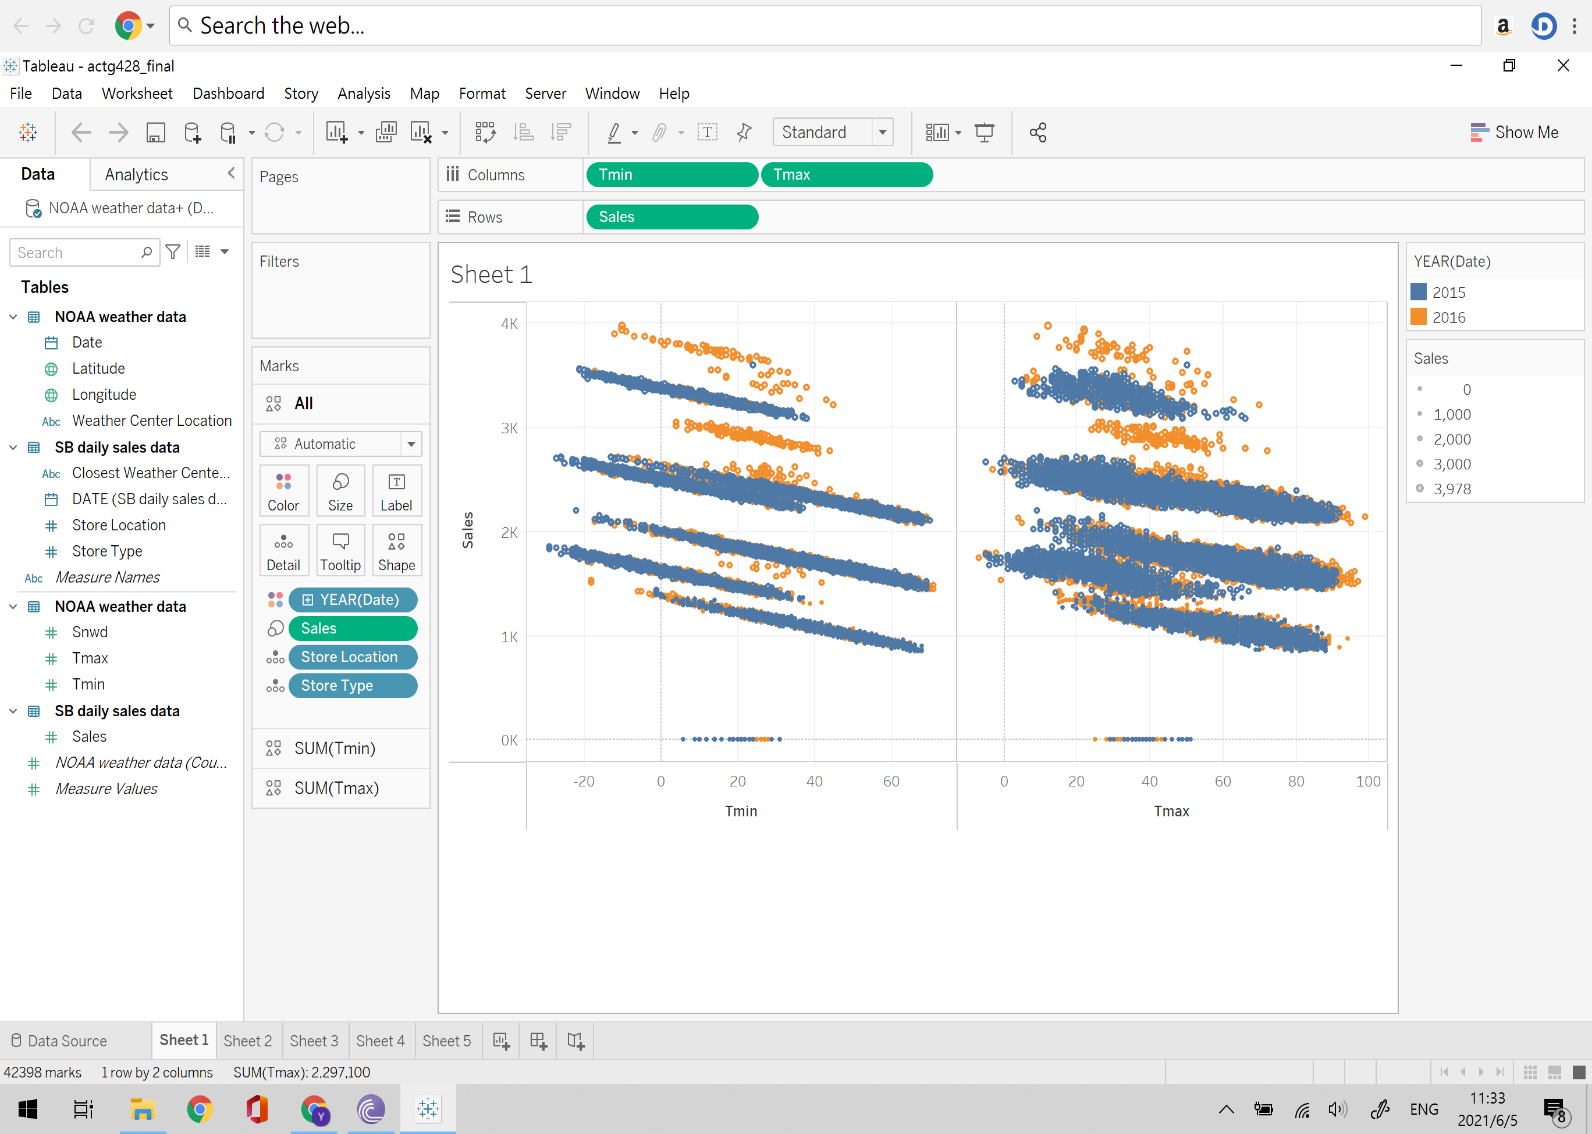
The above visualization compares the number of sales in 2015 and 2016 when the store’s locations experienced different temperatures. The first visualization shows sales in both years when the temperatures were both low and high. We expect that in the two years sales will increase according to the decrease in temperature. Most of the sales in the two years seem to align to the sales expectations. However, the visualization displays some anomalies recorded in the two years. For instance, in the year 2016 (Tmin), there is a sales gap between when the temperatures are at -5 to -18 in Store 1 and after that, no sales are experienced in the period. In addition, a similar gap is experienced in 2015 in-store 2 where there is a gap in (Tmin) where the temperatures are -17 to -22. On the same visualization, it is observed that on high temperatures (Tmax) in 2016, store 3 experienced non-linear sales. From the visualization, we can conclude that extreme fall or rise in temperature holds the potential risk to the sales of Super Bowl.
Visualization 1
Visualization 2
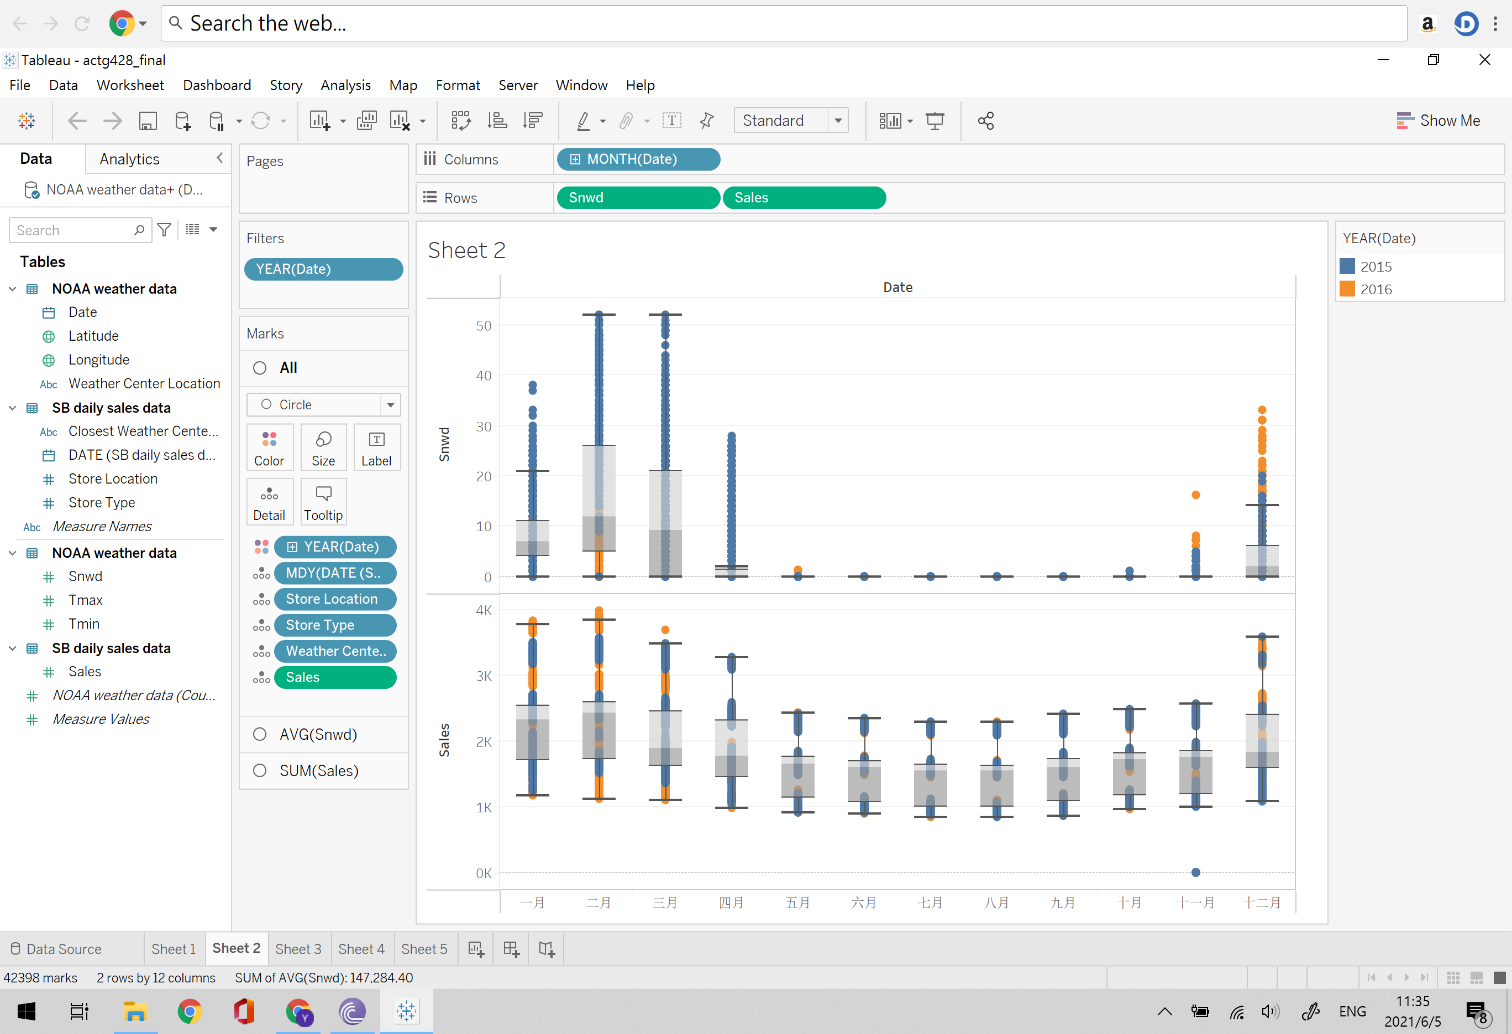
The second visualization shows snowing and sales patterns during the twelve months of both 2015 and 2016. As expected, an increase in snowing weather translates to an increase in sales. The expectation is upheld for the most part of the two years visualized. However, there are some recognizable anomalies that pose an uncertainty risk to the business. For instance, 35 to 38. Also, in the first month, there is a gap in the snowing period where Menia experienced an unexpected snowing from in the 11th month of 2016 there is an abnormal increase in snowing weather from 8 to 18. In the same month in 2015, there was recorded a drop between 1k sales to 0k sales. The snowing periods behaved abnormally at different times over the two years. Therefore, we conclude that sometimes the snowing periods do not follow the projected pattern. For this reason, Souper Bowl should be prepared for a change in snowfall which has an impact on sales volume.
Conclusion
This documents revenue data sales while predicting future sales in specific locations and dates. It contains visualizations that display various anomalies in trends in the years 2015 and 2016. From the visual analytics, the following anomalies were observed: