Introduction
The Australian Agriculture Company (ACC) operates primarily in the cattle processing agricultural industry whose financial positions had been influenced by the volatility of climate conditions. Their conservative land situated in the Northern territory and Queensland’s used as the grazing land of their livestock takes crucial drivers for the company’s last five years of financial performances. The reports aim to provide the in-depth DuPont Analysis of ROE, ATO and PM to identify their value creation taken into their operating and financing activities based on the historical performances of the last five years FY2017 to FY2021. Given clear understanding of the company’s asset utilisation of livestock and PPE and the operational efficiency and profitability, it covers the forecasting of their sales growth, free cash flows and the cost of equity of the next three years from FY2022 to FY2024. Additionally, the report shall valuate the residual income and discounted cashflow to assess the degree of the appropriateness of the valuation of the company and the current share price outcome. Lastly, it concludes with the discussion of the potential opportunity and the challenges AAC may face
Financial Analysis
Ratio Analysis – DuPont Analysis
Return on Equity (ROE) – Operating Activities
The ROE changes over the five years are based on the reported net profit for AAC. AAC’s ROE declines from 7.26% to -16.30% between FY2017 and FY2019 and increases from 3.56% to 4.64% over FY2020 and FY2021. FY2018 had the highest input costs due to the weather, and subsequently, FY2019 faced another challenging seasonal condition with the drought led to a significant drop in the company’s sales and profits. Return on net operating assets (RNOA) and Profit margin (PM) correlates with the ROE’s flow over the five years. The negative ROE of FY2018 and FY2019 are due to the AAC having a net loss with significantly high operating expenses; however, FY2020’s financial recovery was instant, and in the following year, FY2021 was almost close to the peak of the financial position performed in FY2017. The negative RNOA indicates that AAC’s operating liability was more significant than the net operating assets (NOA), lacking the cash to pay off its operational liabilities as shown below in Figure 1.
Profit Margin (PM)
Based on the net profit divided by the average value of owner’s equity, FY2018 and FY2019’s ROE dropped to negative, as AAC incurred a loss driven by the cost of the impairments in FY2018. FY2019’s net loss seemed to be caused by the highest price of live cattle sold of $108,858, leading to the highest numbers in the total operating expenses; meanwhile, the year had the lowest revenue of $422,470, driven by the weakest cattle fair value adjustments of $58,389. Therefore, the Profit Margin (PM) in 2019 had the lowest margin of -$32.83% as shown below in Figure 2.
The significant cause of the negative operating profit margins is the extremely high price premium that AAC had for the cattle over FY2018 and FY2019 in the market price leading to the high cost of goods sold upon the meat and cattle sales – resulting in the high input costs to have an inefficient high-cost operation as shown below in Table 6 of the Appendix.
FY2018 was the only year that recorded $69,502 impairments and impairments related to the Livingstone of $5,443 attributed to the high-cost operation. This is undoubtfully due to the adverse market conditions that led to the high cattle procurement cost, whereas lower than average meat sales demand (Australian Agricultural Company Ltd., 2018, p. 41). AAC had the ongoing branded beef strategy and the increasing global demand, especially in China, for Australian beef in vital overseas markets during FY2019 (MLA, 2019). Seeing surging international demand for the cattle from Australia, on the other hand, the approximately 82,000 cattle were exposed to the floods through their lands resulted in the 43,000 head loss, which attributed to the cattle fair value adjustment to be the lowest of $58,389 in FY2019, leading to the most insufficient operating revenue of $422,470 in the five years between FY2017 to FY2021.
Asset Turnover Ratio (ATO)
Evaluating the asset turnover (ATO) of the AAC in the last five financial years, the asset’s highest non-current asset PPE, current and non-current livestock play a significant role in influencing the ATO as shown in Figure 3 below. The average days to collect receivables slowed down to 19.64 in FY2019, drastically worsened from the FY2017 of 9.24 days which relates to the receivable turnover ratio due to the decline of the sales over the FY2018 and FY2019. The overall falls in the asset turnover ratio indicate that the Fy2018 and FY2019 AAC could not employ their asset profitably. The productivity and efficiency in generating revenue from such high cost and low asset turnover resonate with the asset damage due to the drought.
Financial Leverage (FLEV) – Financing Activities
Liquidity Analysis
Over the five years of periods, the current ratios declined in the middle during FY2019; however, after the FY2018’s peak of 10.39. FY2020 had the recovered from the FY2019’s lowest capacity of the company to pay its current liabilities. However, the abnormally high ratios of AAC during the five years of the period could be a possible warning for the investors as it could also indicate that the company’s financing activities only produce a small percentage of the interest income (other income).
From the operational perspective, the AAC’s capability to cover its current liabilities over the five years is not as attractive as FY2017 in FY2021. The liquidity risks also disclosed by AAC are reflected by all the contractually fixed repayment and interests from the recognised financial liabilities and derivatives, especially during FY2018. The operating cash flow ratio of Fy2018 was a negative figure of -1.16, indicating that their cash flows from the operational activities could not generate enough cash to pay their contractual commitments or interests to the current liabilities and yet they paid the highest interests and financing costs of $20,463 during the year when compared to the other financial years between FY2017 and FY2021.
Solvency Analysis
Over the five years, their average liability to equity ratio is 52.44%, indicating that AAC has been financing at the moderate amount of its potential growth from any borrowings and owing interest-bearing liabilities. Despite the volatile changes in the operating profits, the financing activities have been stable over the years. However, looking at the interest coverage ratios of the past five financial years visibly reflect the AAC’s ongoing unprofitable operation with these negative ratios. Only FY2018 had a favourable ratio of 2.95, close to the ideal balance of 3 and above. However, the stability did not last long after FY2019 until FY2021. This could be another warning for the investors to see the AAC’s potential for solvency and long-term financial health and that their debt is becoming a burden to AAC.
Non-financial Analysis
AAC issued the sustainability report for once during the FY2019 with the important measure and track of their livestock operation, promoting their commitment to the “Animal Welfare” and the ‘Environmental Stewardship’ to increase their efforts to manage the Northern Territory and Queensland (Australian Agricultural Company, 2019).
Animal Welfare
The welfare and health of their animals as their primary products have this one metric of animal with poll gene (dedicated to approx. 25% of the AAC’s herd). These metrics demonstrate their goal to increase the proportion of the polled animals genetically considered one of the factors for the high-cost operation during FY2018 and FY2019 and the increased sales price of their cattle and beef. These metrics that show their ongoing intention to increase the proportion of the polled animals specifically for the wagyu beef resonate with their branded beef strategy to upgrade the quality of wagyu beef by breeding the polled gene as “Wagyu is a naturally horned breed” (Australian Agricultural Company, 2019, p. 10). Significantly during FY2019, the sales price of the cattle had drastically increased by 25% with the surging global demand for the Australian cattle. Their investment in the genetics team tasked with breeding for polled animals on an additional 25% of the herd was reported. This connects to the high cattle procurement costs and the high PPE ratio reported in FY2019 (Australian Agricultural Company Ltd., 2019, p. 42).
Environmental Stewardship
The “Environmental Stewardship” takes another metric of AAC’s increasing commitment to their land management under Territory Conservation Agreements (TCAs), protecting their natural state of conservation importance across the Northern Territory and Queensland. The metrics reported had the 3.3% of their total areas under TCAs excluded from grazing; 212,00 hectares from cattle grazing to set aside 28,28 hectares for the conservation management under TCAs (Australian Agricultural Company, 2019, p. 14). Their lands are central to AAC operations to keep their livestock – their commitments upon their control of such massive property bound by the national regulation will undoubtfully be the significant factor of the operational costs associated with the cost of goods sold and PPE mainly when any unfavourable seasonal conditions may occur.
Forecasting
Operating Forecast
Sales Growth
Forecasting the sales growth of the AAC requires three elements of meat sales, cattle sales and the fair value adjustments as total operating revenue includes them all. Purely forecasting the total operating revenue will not be accurate due to the appropriate value adjustments as shown in Table 7 of the Appendix. Therefore, the forecasting will also involve the historical proportion of the fair value adjustments from meat and cattle sales revenue. The sales of meat and cattle will be reasonably forecasted considering the Australian GDP and the global demand for Australian beef and cattle.
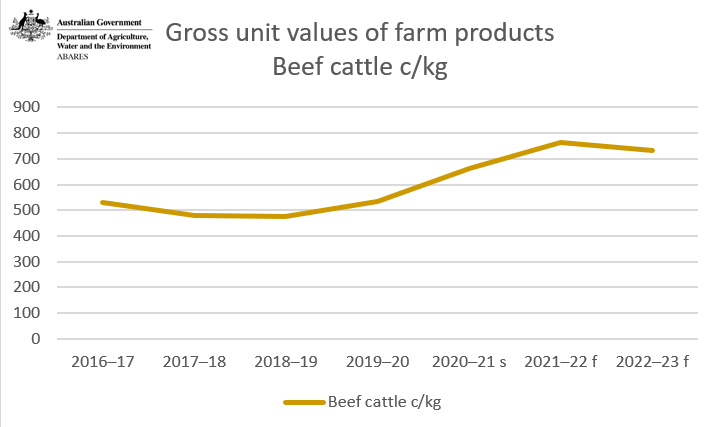
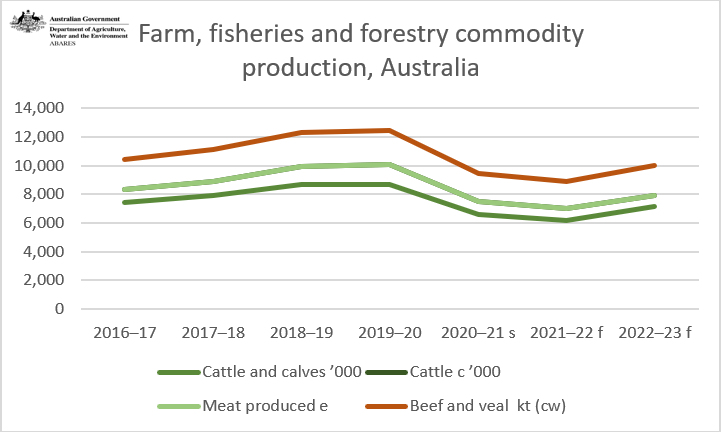
The international demand for Australian beef is expected to rise over the next few years with their projections of positive but slow economic growth across the major export markets. Especially, seeing the surging China’s beef demands over the past five years, north Asian markets’ demand for Australian beef will continue to stay high, making it more reasonable not to decline the meat and cattle sales growth rate as shown in Figure 4 above, and Figure 5 and 6 of the Appendix. On the other hand, the Australian markets are expected to fall in domestic cattle prices during FY2023 and FY2024 due to increased production as shown in Table 8 of the Appendix.
The prices and the supplies of the cattle and beef are also heavily dependent on the herd rebuilding and the climatic conditions within the grazing areas. Therefore, the focus on setting growth rates should be realistically forecasted by considering the impact of the seasonal land conditions and the production level. With the climate changes that created the El-Nino storm, the droughts have been brought to Australia, which are projected to continue from 2023 to 2025 (Mkweather, 2021). Therefore, the sales growth is forecasted humbly considering the weather effects on the low fair value adjustment similar to FY2018 and FY2019.
Asset Turnover (ATO)
Given the above forecast of sales growth rate, 2022, 2023 and 2024’s sales are also steady at 0.35. Considering the ongoing drought from the El-Nina storm influences the exposure of the cattle to be similar but improved livestock management and welfare of the animals, the asset turnover will continue steadily. The assumption is to keep the asset turnover the same over the next three years, as the ATO tends to be relatively stable.
Profit Margin (PM)
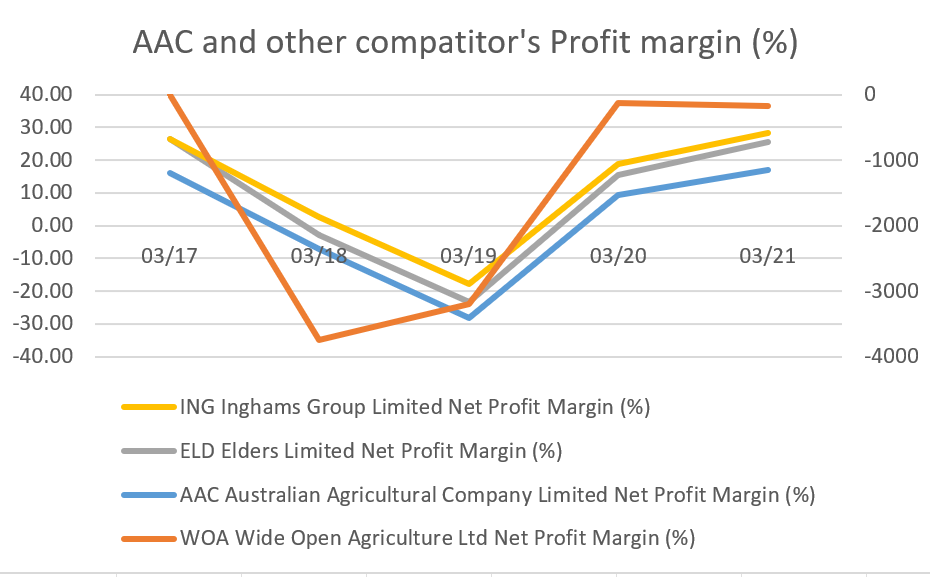
AAC’s profit margin is based on the calculation of NOPAT divided by the sales revenue. The historical performance of PM shows that FY2017 and FY2021’s PM were between 10%-12%, whereas AAC’s profit margins for the next three years could continue to grow if there’s no volatility in climate conditions like FY2018 and FY2019. The cattle and meat unit price is expected to fall slightly due to the increased production volume that led to the forecast of slow sale growth. The profit margin from FY2022 to FY2024 will be forecasted at a steady PM rate in the next few years, considering the slight drop in FY2023. Although no immediate driver mitigates the AAC’s PM, the seasonal condition could also disturb the further reduction in PM after FY2023 to repeat the similar decline after reaching the peak over the last decades. However, as shown in Figure 7 below, the competitors of AAC also had PM fluctuate significantly during FY2018 and FY2019 due to the unfavourable drought; if AAC’s PM ever fluctuates, the other competitors are also most likely to have similar fluctuation and vice versa.
Financing Forecast
Net Dividend Pay-out Rate
AAC’s net dividend pay-out ratio has fluctuated drastically over the last five years. Reasonable forecasts will not be challenging. However, the company will generally prefer a steady pay-out rate over the years; thus, taking the average pay-out rate between FY2017 and FY2021, 1.04% will be used.
Net Borrowing Cost (NBC)
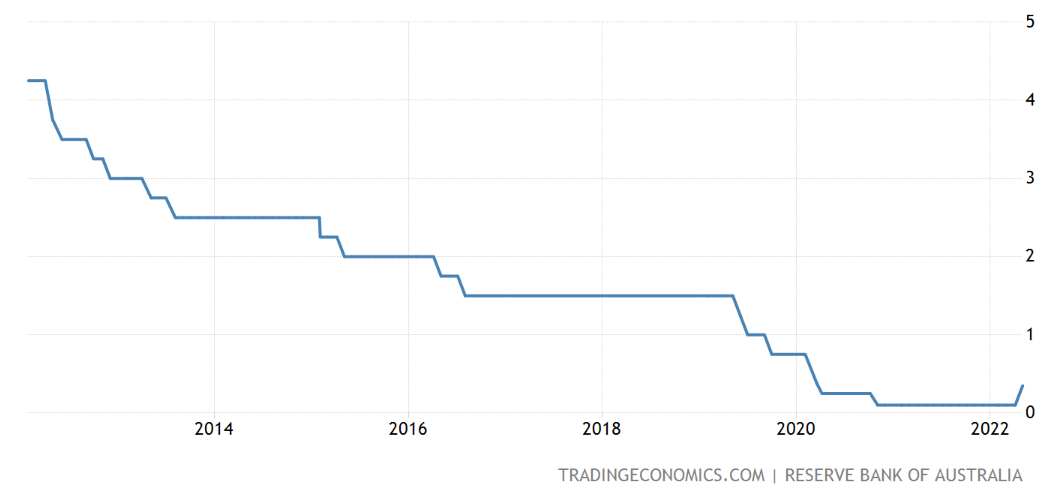
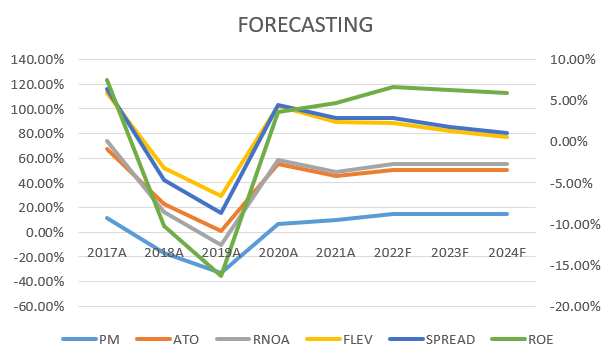
AAC’s NBC grad has gradually declined from 2.94% in FY2017 to 0.80% in FY2021. The variation in the borrowing cost could be due to the variation in borrowing rates and the unrealised or realised gain/losses for the financial items (Nissim et al., 1999, p. 25). As the reserve bank has shown, the interest rate had been consistently declined. Australia’s Reserve Bank raised the cash rate by 25 bps to 0.35% during May 2022, along with the inflation and growing GDP forecasted to go by 4-1/4% to 2% over the subsequent two-year periods as shown in Figure 8 of the Appendix. Therefore, the net borrowing cost of AAC for the next three years is forecasted at the 1% in FY2022, 1.5% in FY2023 and 2% in FY2024 as shown in Figure 9 of the Appendix. The summative forecast graph can be accessed in Figure 9 below.
Valuation
The core valuation models used include key elements, such as weighted average cost of capital (WACC), cost of equity, share price and date of share price, and price multiples valuation. It is important to note that valuation reveals the critical aspects of the financial analysis and the state of the company. All calculations are explicitly shown below and analysed in the corresponding sections with essential details.
WACC
The weighted average cost of capital is a vital metric and valuation tool. WACC “represents its blended cost of capital across all sources, including common shares, preferred shares, and debt” (CFI, 2022, para. 1). The calculated WACC is 4.90%, as shown in Table 1 of the Appendix. The calculation is made from net financial obligations or NFO, total equity value (Ve), net borrowing costs or NBC (Rd), and cost of equity capital (Re). The values for the latter points of entry are shown in Table 1. The calculation made was WACC = NFO / (NFO + total equity value) * NBC + (total equity value / (total equity value + NFO) * cost of equity capital) = 390947 / (390947 + 924543.49) * 0.80% + (924543.49/ (924543.49 + 390947) * 6.63%) = 4.90%. The given value means that AAC should make investments with a return rate higher than 4.90%. It can be used to compare with the sector average in order to estimate how the company is performing.
Cost of Equity
In the case of the cost of capital, the important elements are the risk-free rate of interest (rrf), risk premium (rm), and beta (β). The values of these components are shown in Table 1 of the Appendix. The capital asset pricing model is rrf + β × (rm – rrf) = rrf + β * rm = 3.52% + 0.74 * 4.20% = 6.63%. The risk-free rate of interest for an Australian bond with a 15-year yield is 3.52% (Bloomberg, 2022). The beta value for Australian Agricultural Company Limited is equal to 0.74 – 1.02, from which the lower value is selected to make more accurate estimates in accordance with the stagnated market trend (FinBox, 2022a). It is stated that “a beta that is less than 1 indicates a stock that is less volatile than the overall market, and a beta greater than 1 indicates that the stock is more volatile” (FinBox, 2022b, para. 1). The country’s market risk premium is equal to 4.2% (FinBox, 2022a). The final valuation of the cost of equity shows the portion paid to equity investors in order to compensate for the risk undertaken by the investments.
Share Price & Date of Share Price
For the share price and date of share price, the detailed information can be accessed in Table 2 of the Appendix. The share price of AAC on 31.03.2021 was $1.2, and the market capitalisation was equal to $723320 (Yahoo Finance, 2022). Therefore, the number of shares outstanding was equal to 602766 shares due to $723320 / $1.2. A more detailed and explicit analysis can be observed in Table 2.
Price Multiples Valuation
When it comes to price multiples valuation, the analysis can be accessed in Table 2 of the Appendix, and the data is in Table 3 of the Appendix. The price per earnings ratio or P/E is equal to 15.91 and 10.11 for trailing and forwards ratios, respectively. The price per sales or P/S ratio is equal to 1.5 and 1.44 for trailing and forwards ratios, respectively. The price per book or P/B ratio is equal to 0.69 and 0.65 trailing and forward ratios, respectively. P/E was calculated by dividing market capitalisation by net profit, whereas P/S divided market capitalisation by sales revenue. However, P/B utilised the book value of equity in regard to market capitalisation. Since an acceptable P/B ratio needs to be less than 1, AAC can be stated to be undervalued for both 2021 and 2022 (Borate, 2019). Similar trends can be observed in two other ratios making AAC a positive investment for the potential investors. Thus, the analysis reveals that the company is undervalued and will be so in the next quarters.
Sensitivity Analysis
The sensitivity analysis involves optimistic and pessimistic outcomes for sales growth, ATO, PM, net dividend pay-out ratio, cost of debt, and cost of equity. The detailed calculations and explicit numbers can be accessed in Table 4 of the Appendix. The key assumptions for sales growth are -20%, 3%, and 10% for pessimistic, base, and optimistic assessments, respectively. Similarly, profit margin assumptions for pessimistic, base, and optimistic scenarios are 5%, 15%, and 25%, respectively. However, the cost of equity is determined to be 6.63%, and price estimates for each one of the three cases can be seen in Table 4. The pessimistic, base and optimistic assessments are made with sufficient ranges to illustrate the possibilities of future volatilities. For example, a plausible scenario for the decline in sales would be a global pandemic, whereas the profitability can be affected by governmental regulations on agricultural enterprises. The residual income model (RIM) can be accessed in Table 5 of the Appendix, which can be used to see recalculation was made from the estimated share value from RIM.
It is important to note that the sensitivity analysis shows price fluctuations under different scenarios. When it comes to sales growth, it is evident that the price is not sensitive to both negative and positive cases, which means the sales growth does not affect the value significantly. However, the price number changes drastically when the profit margin is impacted, where the spread can be observed from $0.164 to $0.470. A noticeable change, but to a lesser extent, can be caused by the cost of equity-related price estimates. The optimistic and pessimistic outcomes for forecasting assumptions are chosen on the basis of the recent market trends in Australia. The global recession and economic dynamics meant that larger changes could be used for negative and positive scenarios.
In order for AAC to maintain its current value, the company needs to be able to be profitable, even if it might impact the sales. Any changes to profit margins will lead to significant devaluation problems. However, it also offers an opportunity to reduce the cost of production and achieve higher efficiency, such as economies of scale, to increase the profit margin. The company should not reduce its margins below its base number unless the demand declines dramatically. Cost management is an integrating process aimed at improving the quality of strategic and operational decisions at all levels of the organisation by focusing common efforts on key value drivers.
However, cost management should not be limited to a single valuation methodology. Its main task is to outline the goals and ways of changing the corporate strategy. The value-oriented management cares as much about the subtleties of organisational efficiency as they do about using cost as a measure of performance and as a decision-making tool. With well-functioning cost management, management processes such as planning and performance evaluation provide decision-makers at different levels of the organisation with an accurate information and the necessary incentives to create new value. Therefore, business unit management needs data that would allow it to quantify and compare the costs of alternative strategies for its enterprise. For production managers and heads of departments, such goals and criteria for evaluating work can be set, which, taking into account specific circumstances, are tied to a single strategy of the business unit.
Conclusion
In conclusion, the Australian Agriculture Company shows a positive sign for investment due to its financial analysis indicating company resilience and strong prospects of growth even under stagnant economic conditions. It operates primarily in the cattle processing agricultural industry, where financial positions are influenced by the volatility of climate conditions. The report provided an in-depth DuPont Analysis of ROE, ATO and PM in order to identify the underlying value creation taken into their operating and financing activities. The results are based on the historical performances of the last five years, FY2017 to FY2021. AAC faces major challenges and opportunities in regards to its profitability estimates since it is sensitive to these types of changes. However, the company is resilient when it comes to sales growth fluctuations. In addition, cost management can be a key tool for improving efficiency because it provides an unambiguous and precise measure of performance, namely cost, against which to build an organisation’s competitiveness.
References
Australian Agricultural Company Ltd. 2018 Annual Report. Web.
Australian Agricultural Company Ltd. 2019 Annual Report. Web.
Australian Agricultural Company. (2019) Sustainability Report. Web.
Bloomberg. (2022) Australian rates & bonds. Web.
Borate, N. (2019) PE versus PB ratio: which one to use to assess a company’s health. Web.
CFI. (2022) WACC. Web.
FinBox. (2022a) Australian Agricultural Company Limited. Web.
FinBox. (2022b) Australian Agricultural Company Limited. Web.
Mkweather. (2021) 2022-2023 forecast: chances for el-nino? Web.
MLA. (2019) Cattle market wrap: 2019. Web.
Yahoo Finance. (2022) Australian Agricultural Company Limited (AAC.AX). Web.
Appendix
Table 1. Capital Asset Pricing Model & WACC
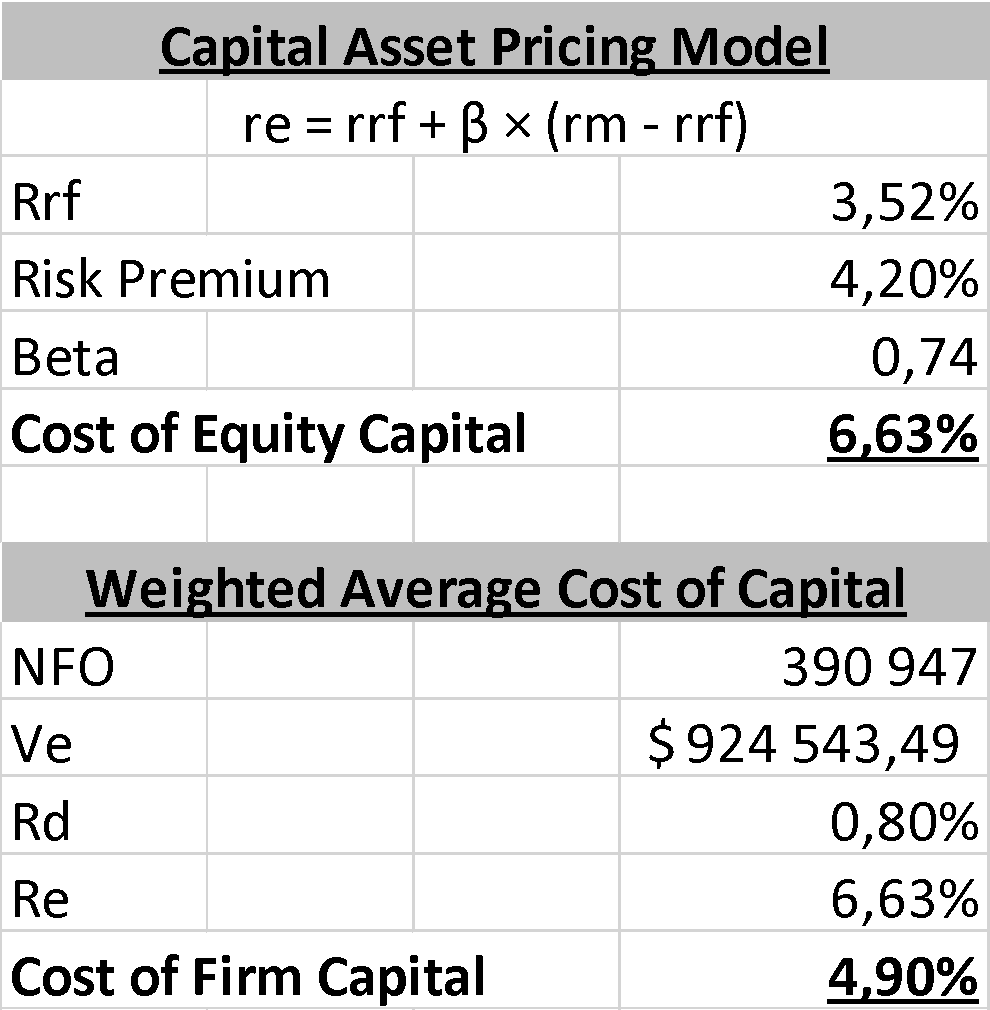
Table 2. Price Multiples
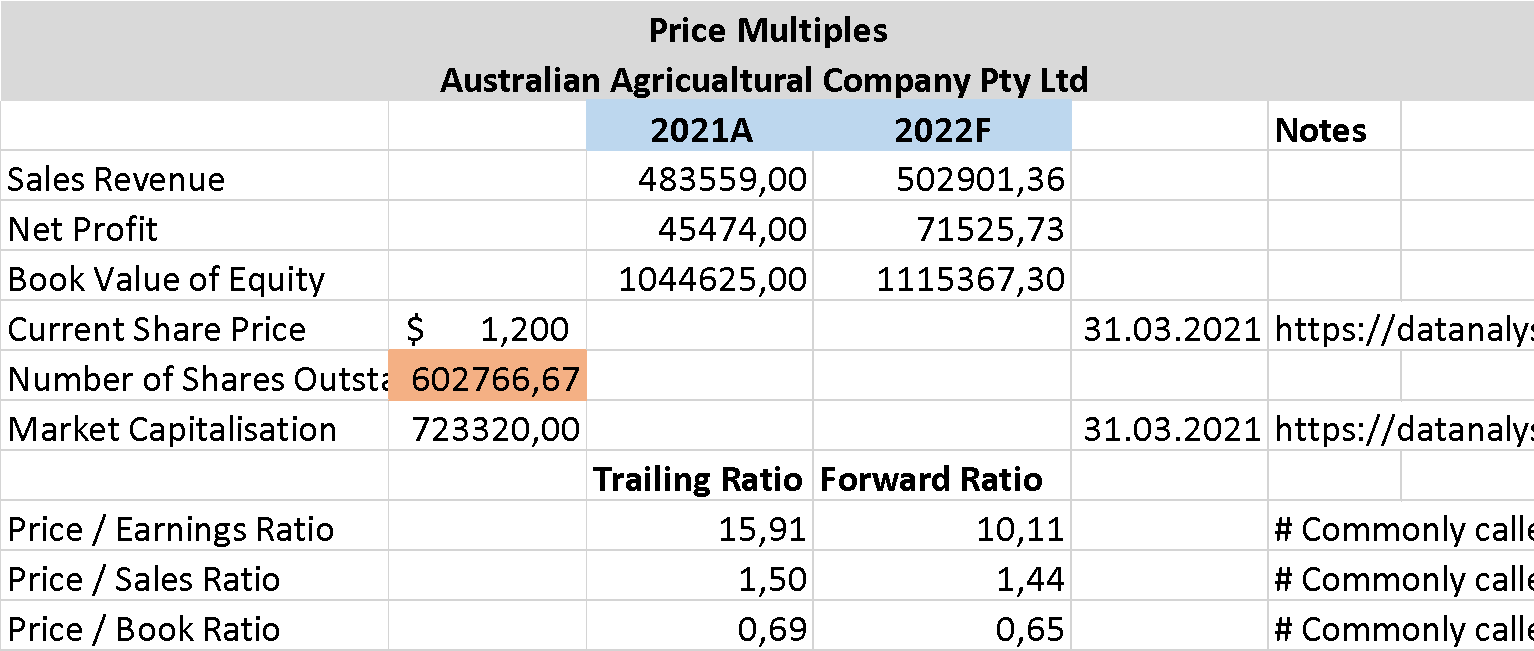
Table 3. Price Multiples Data
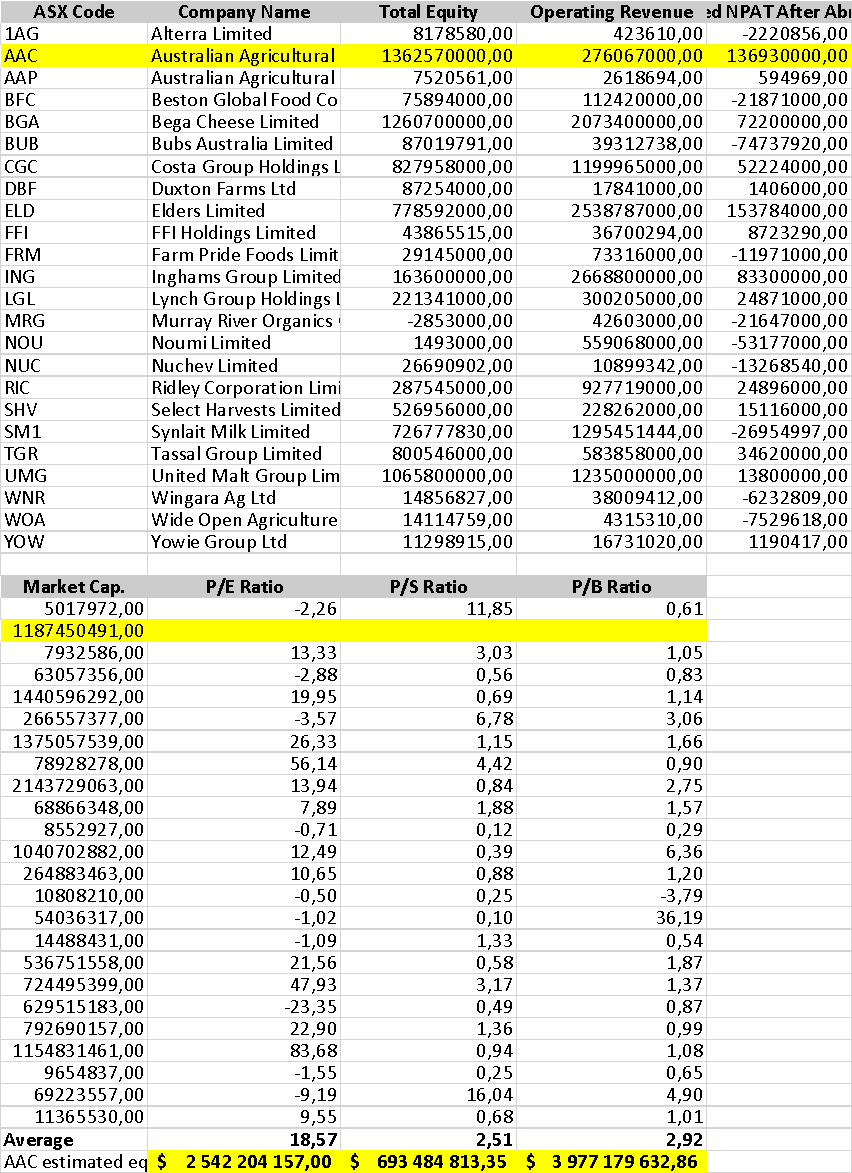
Table 4. Sensitivity Analysis
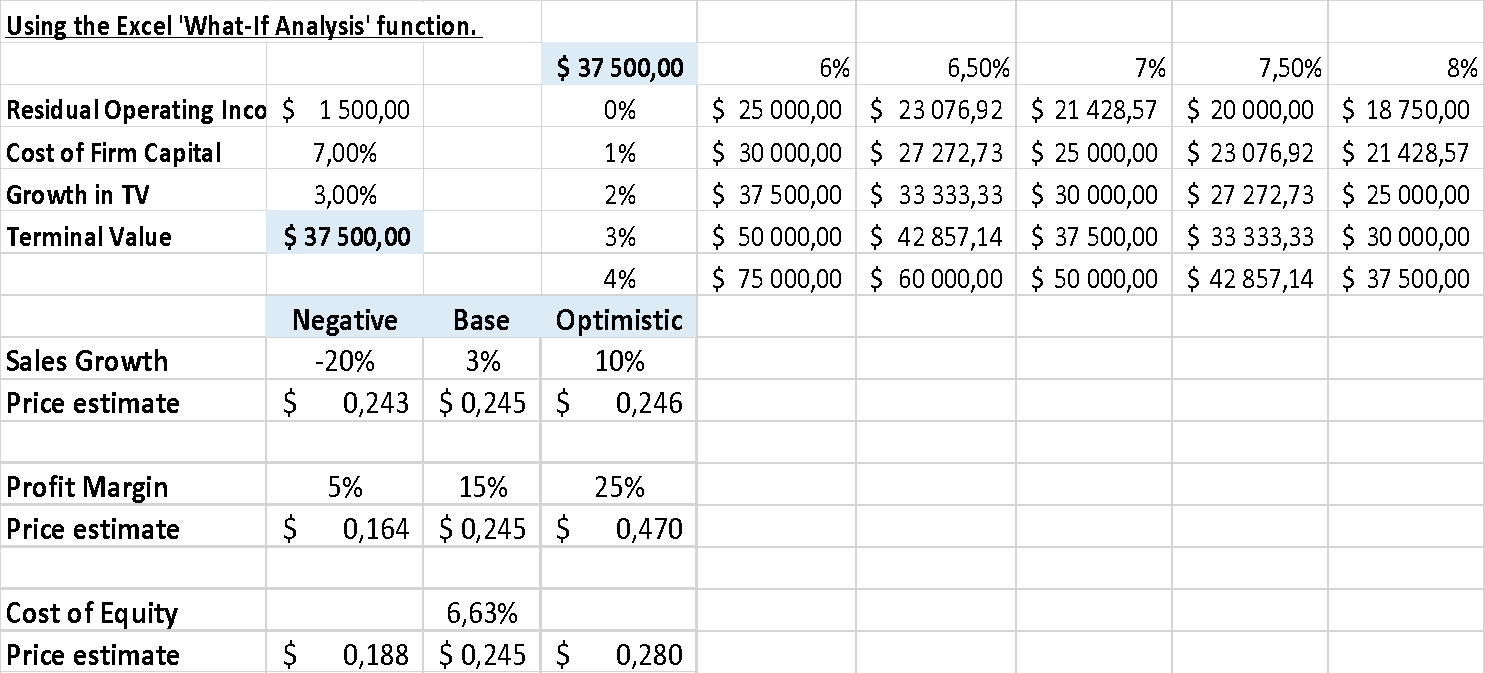
Table 5. Residual Income Model
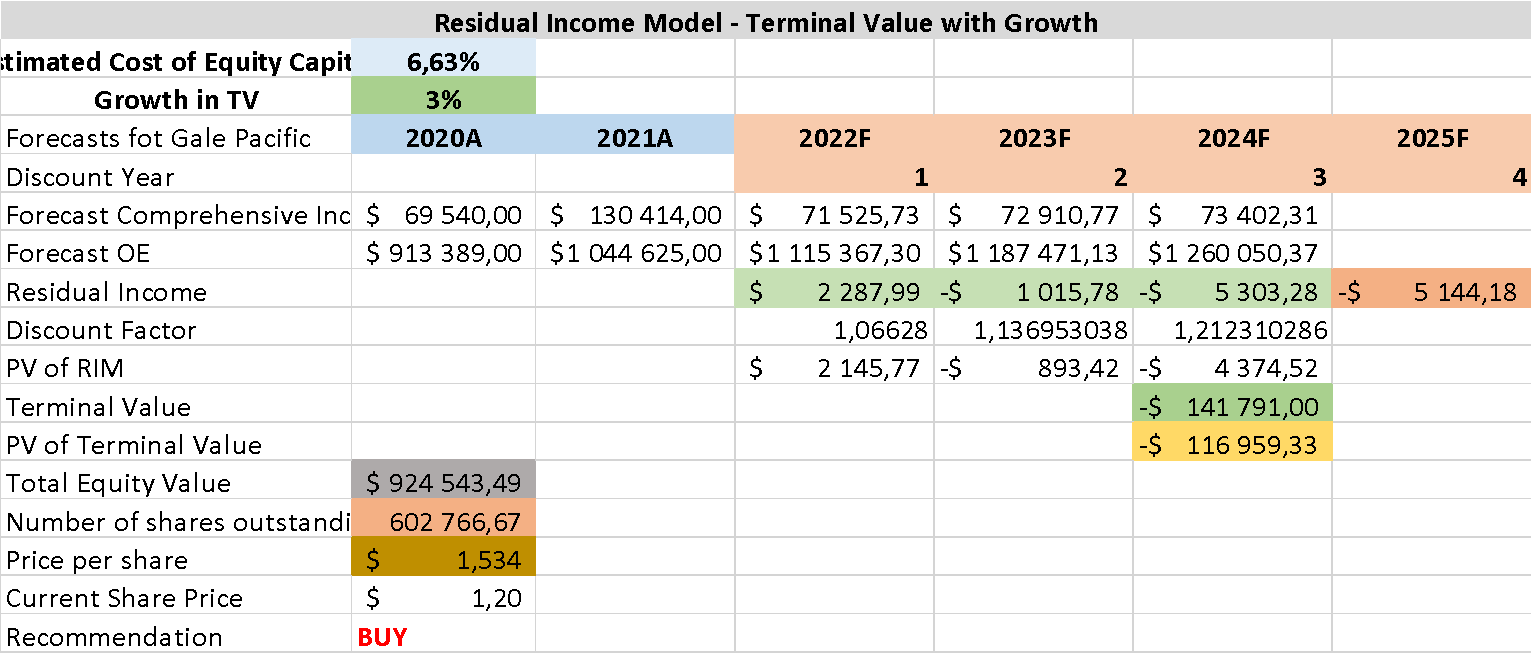
Table 6. Sales and Marketing
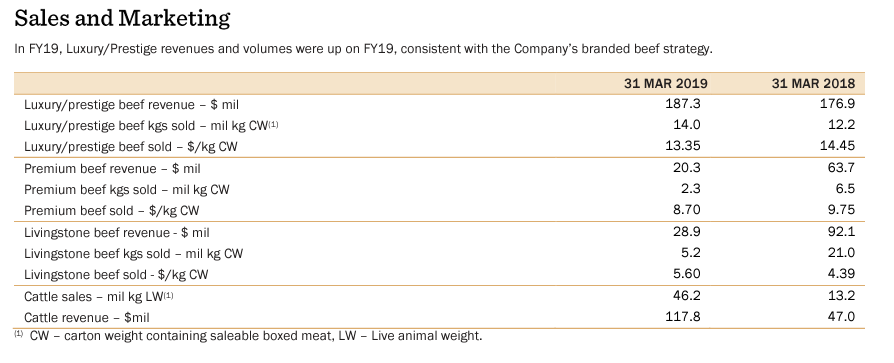
Table 7. Operating Revenues
Table 8. Forecast