Executive Summary
This paper tests the idea that a gender wage gap exists for the case study of Australian workers. The research methodology included simple and multiple linear regression models to detect differences in the significance of gender for the wage gap. Statistical analyses were conducted in MS Excel. In addition to determining the regression equations, the statistical significance of the slope coefficients was also calculated, which allowed us to judge the significance of the models as a whole. Wage and sociodemographic data, including skills, education, and professional experience in years, were collected from 1,099 Australian workers aged 20 to 74 years. The analysis showed that a gender wage gap exists, and it is amplified when additional variables are included. In particular, the gender coefficient was shown to increase for multiple regression.
Introduction
Background
Achieving economic equality is a key need of a democratic civil society interested in developing equal rights and freedoms for all population groups without exception. One of the predictors of economic inequality is gender wage discrimination. In this case, women with identical skills and competencies to male colleagues are paid less (Cortés & Pan, 2019). According to official government data for 2022, the gender gap in Australia remains high, predominantly in the western part of the country (WGEA, 2022). Specifically, according to the Workplace Gender Equality Agency (WGEA), the wage gap between men and women can be as high as 21.2%, while the minimum level of this gap is also relatively high at 7.4%. In financial terms, it has been estimated that Australian women, on average, earn $255.30 less per week than men in similar positions. The gender gap is destructive and unmotivating because it demonstrates the traditional patriarchy of society and does not provide minimum economic freedoms for women. It should be understood that the reasons for the gender gap are multiple and cannot be reduced to a single answer.
The gap between women and men should not be perceived only as unfair wages if employees work in identical positions with similar skills. The gap should also be attributed to the historical situation in which women have fewer job opportunities and are forced to work in lower-paying jobs (Paul et al., 2022). This creates an additional problem when hiring an Australian woman for a new job, in which the final wage is based on the woman’s previous wages, creating a cycle. Among others, women are more likely than men to work in their households and/or care for a child — this labor is unpaid except for maternity leave, creating a gap. However, workplace discrimination and prejudice against women are significant predictors of this agenda (Blau, 2018). Thus, many reasons lead to the formation of a gender wage gap.
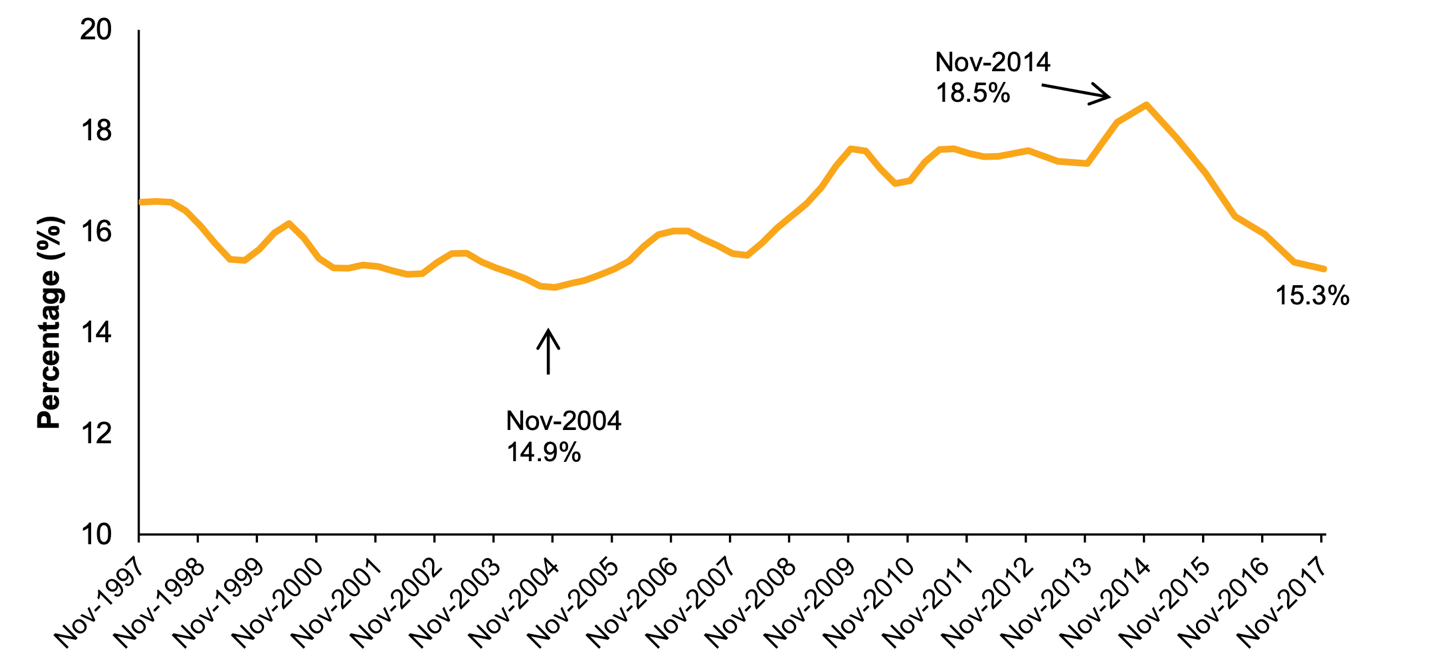
Strictly speaking, such a situation should not exist at all, nor should it be a research subject, according to the Universal Declaration of Human Rights (UDHR). Australia, which drafted this document in 1947 among a commission of UN countries, now has 75 years of experience in working to close the gender gap (Adami, 2018). This is true: the government was among the first to implement equal pay reforms back in 1969 and 1986 (Nguyen, 2022). However, observed changes do not seem sufficient, as a reference to Figure 1 shows that the average gender gap has remained a dynamic function over the past 25 years and has not shown a constant downward trend. According to The Guardian in Australia, men earn more than women on average by up to $120,000 a year (Australian Associated Press, 2022). Among the key statistics are the key predictors of this gap. In particular, WGEA (2022) reports industry differences: the maximum difference was in high-skill, scientific work, in which men’s daily wages were 24.4% higher than those of women in the same field. This does not seem surprising since science has historically provided more opportunities for men and excluded women (Astegiano et al., 2019). Although the agenda is changing, the measures taken by the government are not enough to close this gap, as can be seen.
Meanwhile, the gender gap is also mediated by the commercial orientation of labor. In the private sector, men are still paid 17.0% more, while in the public budget sector, this difference is reduced to 11.2% (WGEA, 2022). This difference may indicate government efforts to reduce the gender gap, but the difference of 11.0% is still relatively significant. Notable statistics from the WGEA report differentiating this gap by age group. In particular, the smallest gap exists for the youngest age group of workers; it was as low as 3.7% in 2021. In contrast, the gap widened with increasing age, reaching 17.8% for the 45 to 54 age groups — so adult women are discriminated against not only by gender but also by age.
The above statistics create a phenomenal agenda in which women find themselves unequal in economic and labor rights compared to men. In addition to decreased motivation to work and thus a drop in productivity, the gender gap also creates a foundation for the development of chronic stress, insecurity, effective motherhood, and health problems (Heise et al., 2019). On the other hand, there are opinions that the gender gap is not an accurate metric of a nation’s economic health because it does not consider the actual skills of men and women in the jobs they hold (Craven, 2019). One might get the impression that men’s historically richer inherited experience explains their improved competencies relative to women, with the result that the gender gap may be sparse. In this context, it is reported that “becoming a wealthy CEO is not something that happens overnight, and so expecting an immediate 50/50 gender split among CEOs is both misleading and unrealistic” (Craven, 2019, para. 18). Research also motivates the gender pay gap by punishing women for having children, creating conflicting conclusions for public debate (Kleven et al., 2018). Thus, statistics illustrate that the gender gap does exist, but different views on it can be found in academic and public discourse. While the pay gap is generally unfair and discriminates against women’s rights, there are many more variables to consider that affect this.
Purpose of the Report
The purpose of this research report, based on statistical analysis, is to examine the gender gap phenomenon for Australian men and women through linear and multiple linear regression and to demonstrate the results.
Methods
The methodological basis for the study was based on the use of publicly available published wage data for 1,099 full-time Australian men and women aged 20 to 74 years. The data collected included information on earnings, gender, educational attainment, skills, and work experience, examining different trends in the gender pay gap. MS Excel with a built-in regression statistics function was used for statistical analysis. It is essential to clarify that the variables of gender, educational degree, and availability of proficient skills were measured on a dichotomous scale and thus represented nominal variables. Table 1 below shows the coding of the values of these factors. The report included descriptive statistics and inferential statistics for prediction; a critical alpha level of.05 was used to test for statistical significance. Results were published as tables and charts presented in the appropriate section.
Table 1: Codes Used for Nominal Variables
Key Findings
The paper showed that a gender pay gap exists, amplified when additional variables are used. This included education level, skills, and professional experience. It was found that a man with the same characteristics as a woman was paid more on average by 19.8%. The analysis confirmed the existence of a gender wage gap for Australian workers.
Analysis
Preliminary Linkage Analysis
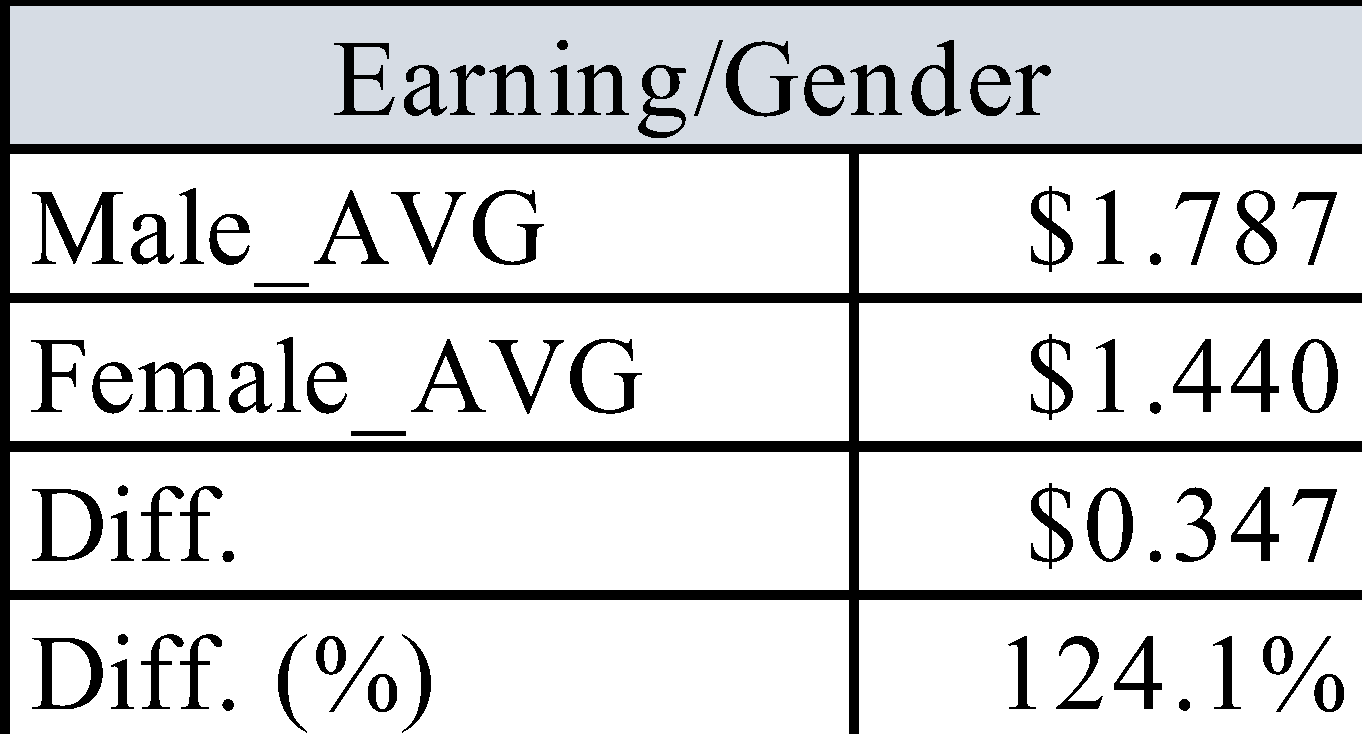
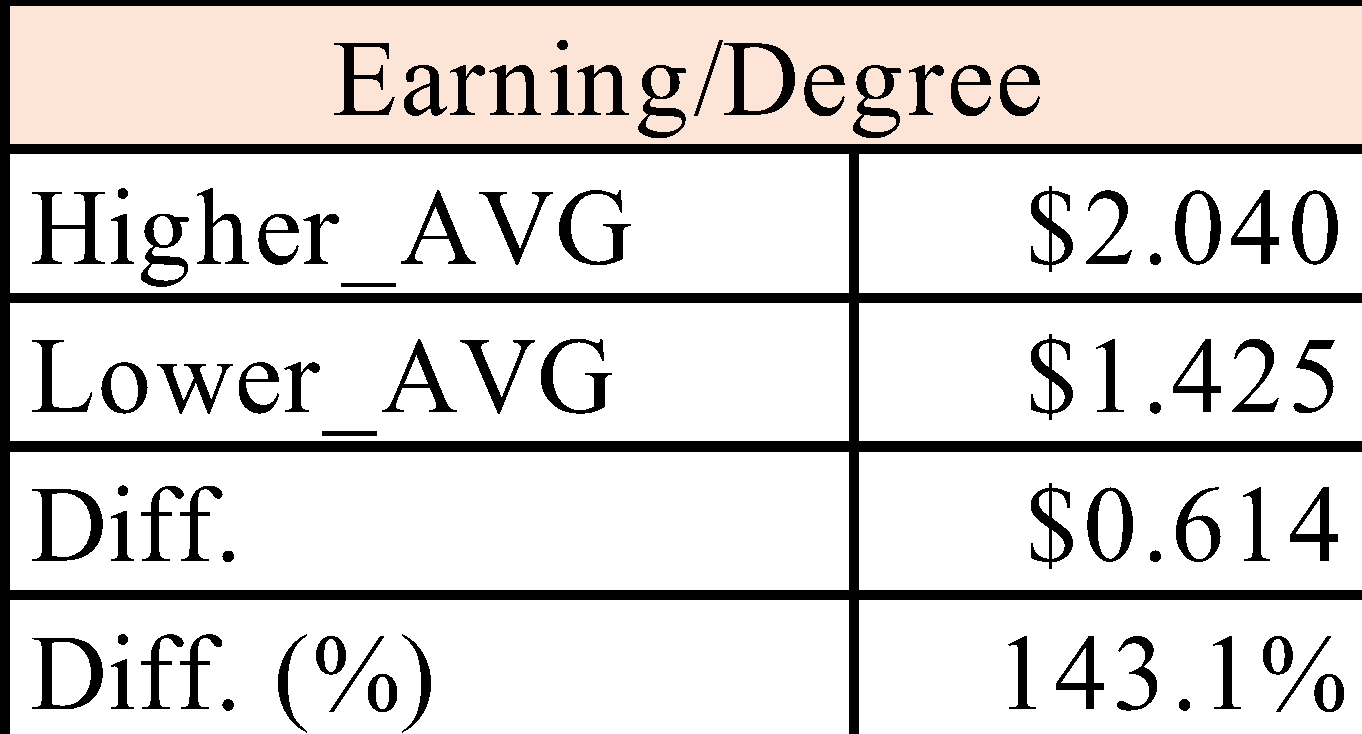
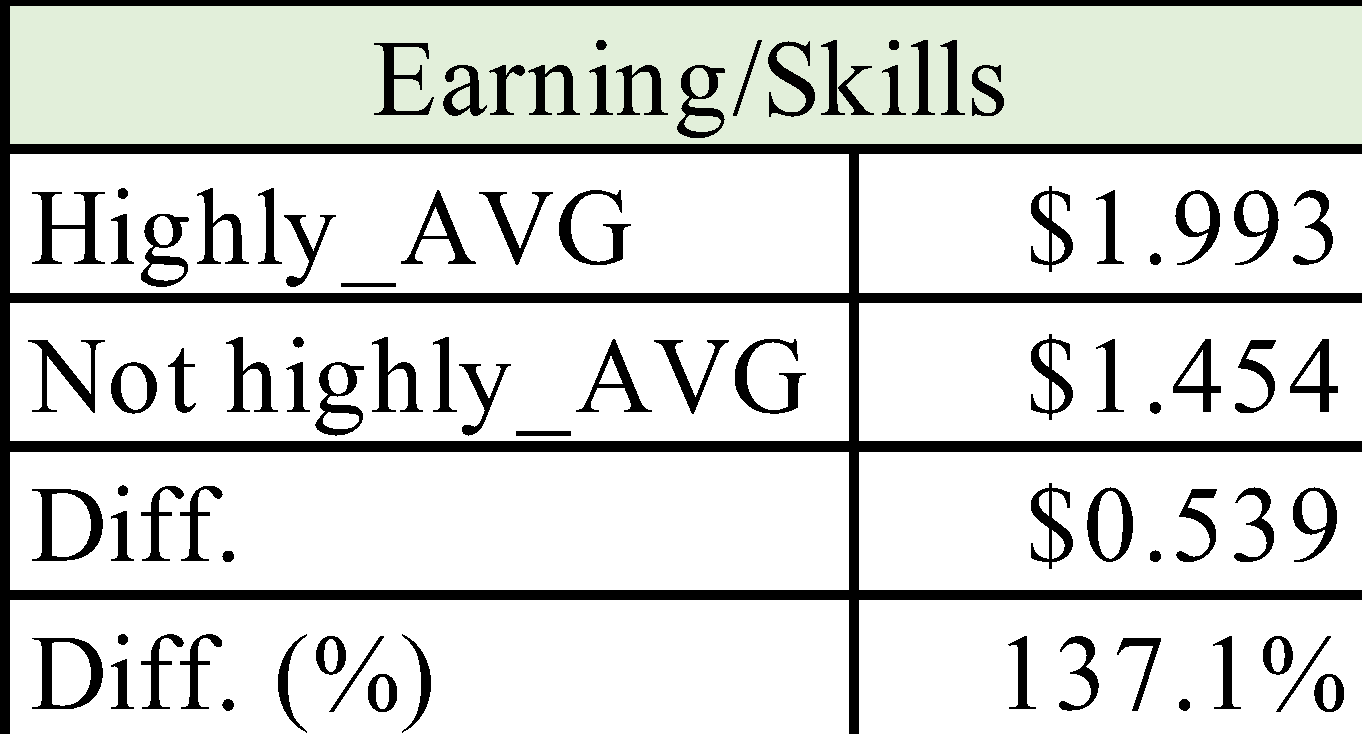
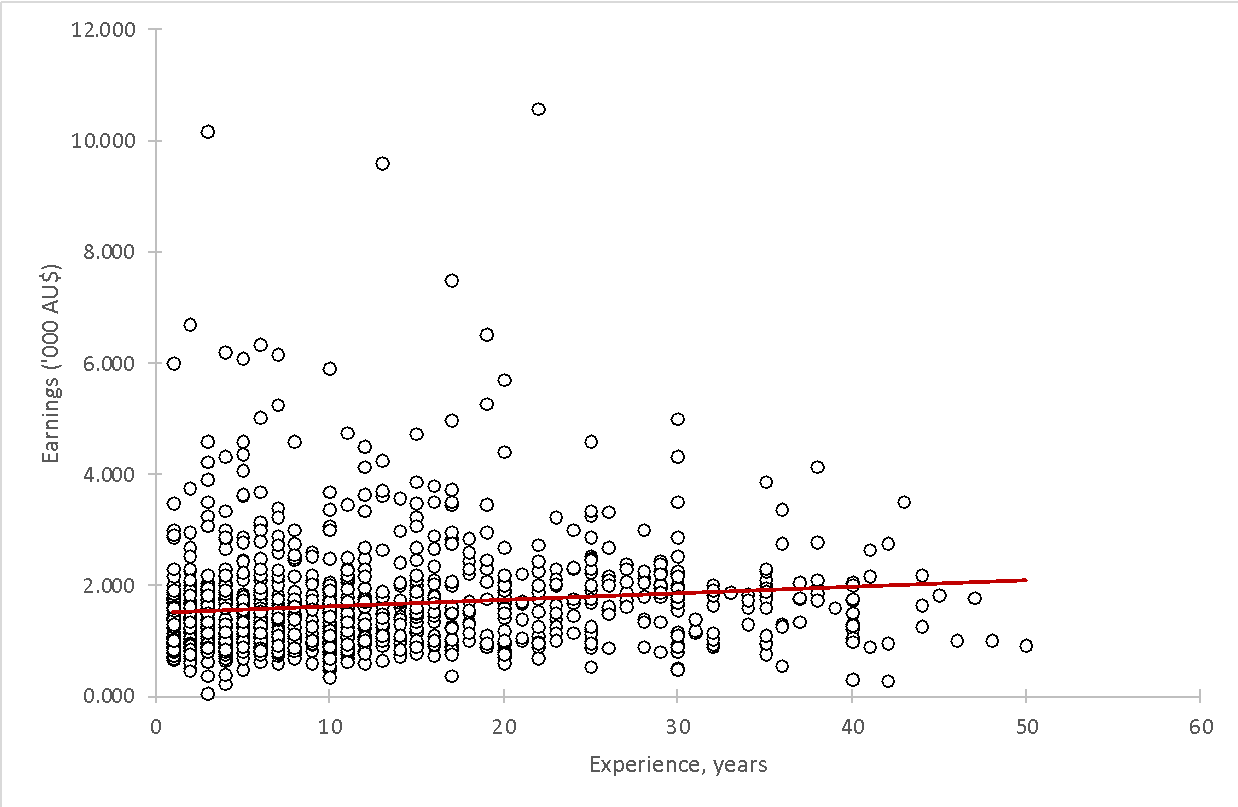
It was paramount to assess the relationship between individual variables and wage levels to test the gender wage gap phenomenon and examine comprehensive data on key trends. The results showed that the average difference between men and women in terms of pay was 24.1% over one week, meaning that men were paid A$347 more than women (Table 1). A difference was also found for the education level of sample participants: it was shown that respondents with higher levels of education (“1”) were paid on average 43.1% more than participants with lower levels of education, a monetary difference of A$614. It is easy to see that the age criterion determined the wage gap almost twice as much as the gender criterion. Regarding the availability of high skills, it was found that wages were 37.1% higher for better-trained individuals than for less-skilled individuals — an equivalent financial difference of A$539. Finally, a preliminary analysis examined the difference in wages depending on the professional experience of the respondents. Since experience was not a dichotomous variable, it was appropriate to create a line chart corresponding to the relationship of pay to work experience (Figure 2). As shown in Figure 2, on average, employees’ pay increased slowly with increasing professional experience; however, serious deviations were found in this case. In particular, there were examples when less experience led to a significantly higher salary for the respondent and vice versa. Thus, the relationship between experience and salary cannot be unequivocally judged because it is too dynamic a relationship.
Table 1: Differences in Average Wages Depending on Gender, Education, and Skills
Simple Linear Regression
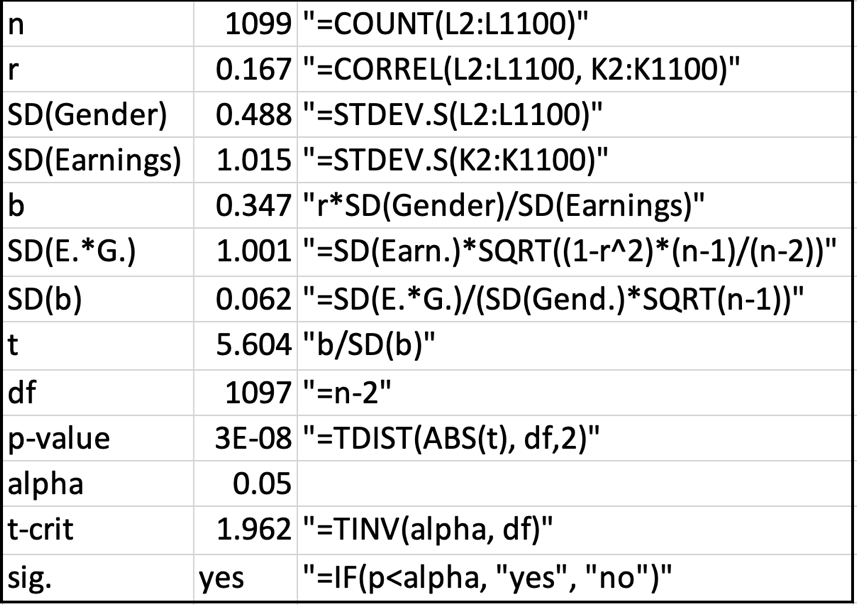
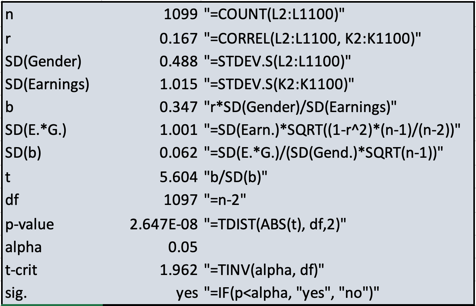
A simple linear regression function examined the relationship between wage level and respondent gender in Model A. The results showed that the coefficient of determination R2 was 0.028, which means that only 28% of the variance of all data in these distributions could be explained by the linear model (Fernando, 2021). The resulting regression equation was as shown in Figure 3. It can be seen that the slope coefficient was 0.347, which may indicate a positive relationship between gender and wage levels. Considering that the coding of men was marked as “1”, it means that men get higher wages in general than women. This model is statistically significant because the corresponding p-value was significantly below the critical level (Table 2). Since the null hypothesis was that the slope coefficient was zero, and it was rejected, Australian men do earn more than women.
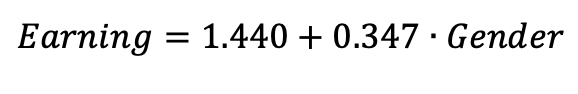
Table 2: Step-by-step Demonstration of Hypothesis Testing with the Two-Way T-Test
Multiple Linear Regression
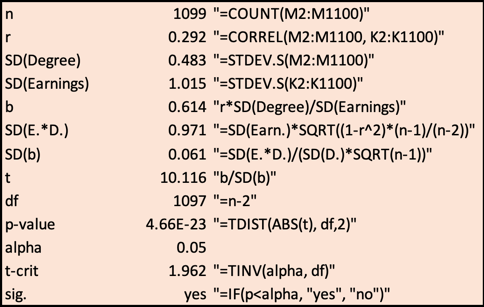
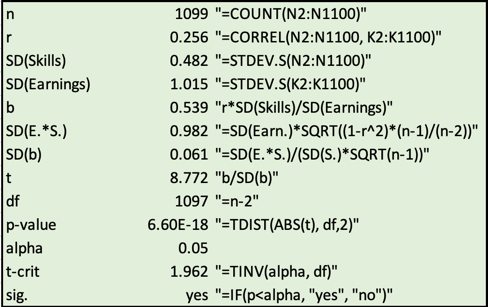
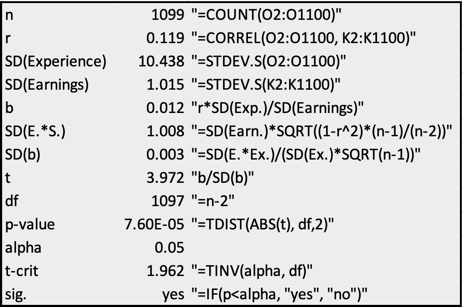
Multiple linear regression was run for Model B, based on the multiple effects of the independent variables. The final equation for this model was as shown in Figure 4. It can be seen that all of the slope coefficients were positive, which means that each variable in Model B increases the wage gap. The most substantial contribution comes from individuals’ education level (0.561), followed by gender (0.396), skill level (0.365), and professional experience (0.010). Thus, respondents’ experience had less of an effect on the wage level of Australian workers. All slope coefficients were statistically significant because the corresponding p-values were significantly below the critical alpha level (Table 3). To test the overall significance of this model, the null hypothesis was that each slope coefficient was zero. The calculated overall p-value in the two-sided F-test was 3.89∙10-42, which means that the overall model B was statistically significant.

Table 3: Stepwise Tests of the Significance of the Slope Coefficient Using a Two-Sided T-Test for Each of the Four Variables: Gender (Blue), Educational Degree (Orange), Skills (Green), and Professional Experience (Gray)
R2 Comparison
The calculated R2 value in model A was 0.028, and the adjusted R2 value in model B was 0.164. Based on these data, it was concluded that Model B covers a more significant percentage of the variance of the data in the distributions, which means that this model is generally more reliable than Model A. This does not seem surprising since, in practice, the wage gap does not depend on only one variable but instead is a function of many factors, as was shown in the Introduction section. In other words, incorporating additional relevant variables to predict wage values increases reliability. Meanwhile, it should be understood that the R2 for Model B is still not high or even moderate but rather low (Fernando, 2021). Therefore, even Model B does not perfectly describe the relationship between the variables.
Gender Coefficients
As can be seen from Figure 3 and Figure 4, the gender coefficients in the regression equations were 0.347 and 0.396 for Model A and B, respectively. In other words, the multiple regression increases the effect of gender on the wage gap. This increase was due to the combined effect of several variables, which means that gender, when combined with education, skills, and experience, has a more substantial effect on Australian workers’ wages than gender alone. For the purposes of the problem at hand, this suggests that gender discrimination increases when additional factors are included, although gender alone also affects the gender wage gap.
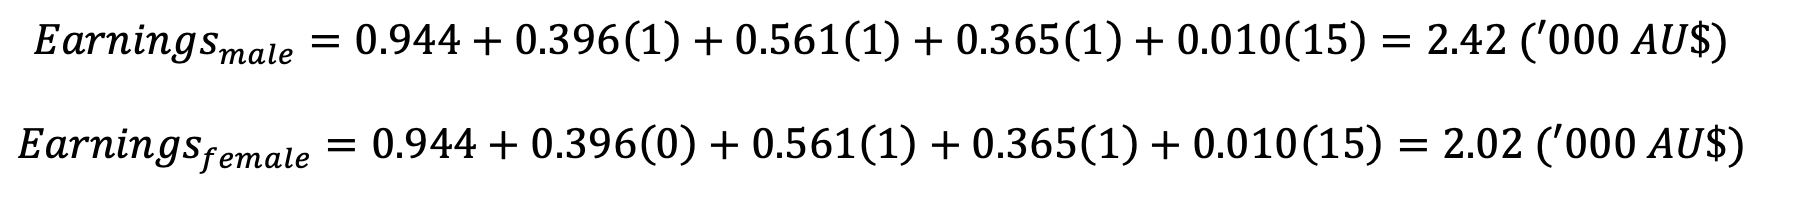
Predicting Earnings
The equation shown in Figure 4 should be used to predict earnings. Substituting the variables from Table 1 into it produces the following values, as shown in Figure 5. It can be seen that other characteristics being equal, men will earn on average 19.8% more than women, which is equal to 400 Australian dollars. This prediction confirms the existence of a gender gap, taking into account other unchangeable characteristics — in other words, a woman does earn less than a man, all other characteristics being equal.
Additional Variables
It would be appropriate to use an individual’s occupational focus, measured on a categorical nominal scale, as part of improving the model. This would allow us to assess how the occupational focus factor affects the wage gap and whether it might reduce it. In addition, a variable of time spent on parental leave to care for a child would be useful. This variable would be measured numerically in months or years and would allow one to assess whether maternity leave affects the earnings gap.
Conclusion
The existence of a gender gap is a severe problem for economic equality in a democratic society and leads to disruptive consequences. This paper tests the idea that a gender pay gap exists using Australian workers as a case study. The research methodology included simple and multiple linear regression models to detect differences in the significance of gender for the wage gap. Statistical analysis was conducted in MS Excel. In addition to determining the regression equations, the statistical significance of the slope coefficients was also calculated, which allowed us to judge the significance of the models as a whole. Wage and sociodemographic data, including qualifications, education, and professional experience in years, were collected from 1,099 Australian workers aged 20 to 74 years. The analysis showed that a gender pay gap exists, and it is amplified when additional variables are included. In particular, the gender coefficient was shown to increase with multiple regression.
References
Adami, R. (2018). Women and the universal declaration of human rights. Routledge.
Astegiano, J., Sebastián-González, E., & Castanho, C. D. T. (2019). Unravelling the gender productivity gap in science: a meta-analytical review. Royal Society Open Science, 6(6), 1-20. Web.
Australian Associated Press. (2022). Gender pay gap narrows but Australian men still twice as likely as women to earn more than $120,000 a year. The Guardian. Web..
Blau, F. (2018). The sources of the gender pay gap. In D. B. Grusky & K. R. Weisshaar (Eds.), Social Stratification (pp. 929-941). Routledge.
Cortés, P., & Pan, J. (2019). When time binds: Substitutes for household production, returns to working long hours, and the skilled gender wage gap. Journal of Labor Economics, 37(2), 351-398.
Craven, D. (2019). Unpopular opinions: The wage gap isn’t down to the patriarchy. B**P. Web.
Fernando, J. (2021). R-squared. Investopedia. Web.
Heise, L., Greene, M. E., Opper, N., Stavropoulou, M., Harper, C., Nascimento, M., & Gupta, G. R. (2019). Gender inequality and restrictive gender norms: framing the challenges to health. The Lancet, 393(10189), 2440-2454. Web.
Kleven, H., Landais, C., & Søgaard, J. E. (2018) Hildren and gender inequality: Evidence from Denmark [PDF document]. Web.
Nguyen, L. (2022). Gender wage gap in Australia. The Borgen Project. Web.
Paul, M., Zaw, K., & Darity, W. (2022). Returns in the labor market: A nuanced view of penalties at the intersection of race and gender in the US. Feminist Economics, 2, 1-31. Web.
WGEA. (2018). Australia’s gender pay gap statistics [PDF document]. Web.