Abstract
Cognition and information processing remain unexplored and are associated with various contradictory effects. Among them is change blindness, in which an individual tends to ignore the details around him while concentrating on the object of study (Briggs and Davies, 2015). The functions of this effect are only partially understood and may be aimed at protecting the perceptual system from extraneous stimuli, but it is fair to say that this problem needs in-depth research. The present work statistically evaluated the effect of image context on the rate of change recognition. A two-way ANOVA found that the absence and presence of context were statistically significantly related to the gender and age of participants.
Summary: The Meaning of Change Blindness
Information retrieval, processing, and interpretation are of tremendous importance in human life, especially in the era of profound digitalization of all spheres of life. Today, individuals are confronted with enormous amounts of accessible information stored in memory and affect their cognition of the world (Norimatsu et al., 2010). Thus, the cognitive functions of the human brain surprise with unique phenomena that are observed in everyday practice. In particular, individuals are often inattentive, ignore essential details, and lack focused attention on the object of study. From a research perspective, it is of particular interest to have scattered attention without focusing on the object; an individual tends not to distinguish extraneous phenomena and processes if his attention is focused on something else at that moment.
An excellent example of this phenomenon is the effect of not focusing on what is happening around one during a telephone conversation. If an individual is on the phone (and especially if the call turns out to be serious), they can take in whatever the other person offers them, even if it does not make sense (Ma, 2020). A classic psychological example of the existence of this effect is the original gorilla experience in which respondents were asked to count the number of ball throws between teams (Simons, 2010). During the match, a man dressed as a gorilla walked past the players, and it was shown that most of the respondents did not notice it because they were busy counting the throws.
The effects described are examples of the phenomenon of change blindness, in which the respondent’s brain expends resources on a particular process, ignoring the details of the other phenomena. This psychological effect is often investigated in scientific papers, as the identification of the patterns that determine change blindness answers questions about the underlying processes of the brain. For example, G. Murphy and L. Murphy write that “change blindness is the striking inability to detect” (Murphy, G. and Murphy, L., 2018, p. 655). A similar definition is offered in the textbook, which states that “the inability to notice changes in a visual scene” (Briggs and Davies, 2015, p. 119). Consequently, change blindness should be perceived as a natural but not thoroughly studied feature of cognitive information perception.
To investigate this problem, the flicker method is often used, in which a short demonstration of an accurate picture for milliseconds is replaced by the same picture with some gaps, after which the respondent is shown the initial image with altered elements (Rensink et al., 1997). The inability to effectively distinguish the details of the altered picture reflects the existence of change blindness. Similar effects are observed when an actor playing the same character is replaced or when a person is actually replaced with another person when asking a stranger for directions (Levin and Simons, 1997). The existence of such a phenomenon reflects either imperfect human cognitive systems or a significant lack of knowledge about the problem. In either case, it creates a need for a thorough study of these effects.
The central research question of the present paper is to determine whether change blindness is indeed a common cognitive distortion in information perception. In contrast to previous studies, the present paper offers a qualitatively new approach to studying the phenomenon. This involves the use of three categories of variables in conjunction with respondent demographics: congruent, noncongruent, and no test category. Congruence in the present case refers to contextual correspondence, where the respondent was asked to rate changes in light of change blindness as a result of a visual change test. Accordingly, incongruent changes are any transformations in the test that were performed inconsistently with the overall context; in other words, they are apparent differences. Variation variables aim to identify deeper patterns in the perception of latent information, namely the relationship to context, if any.
Thus, the generalized research question was formulated as “Is there an effect of context on perceptions of congruent variation in the change blindness test?” The working hypothesis of the study was that there was such an influence; in particular, congruent change was more difficult for respondents to distinguish because modifying elements of the overall picture according to context was more challenging to distinguish effectively.
Methods
The basis for the methodological framework of this study was to conduct a quantitative experiment that would answer the research question. In fact, the implementation of the experiment was to answer two questions, explaining the prevalence of change blindness and the relationship to context. However, the current design cannot be described as based strictly on a quantitative approach, as it was not so much to establish numerical patterns as it was to determine the relationship of change blindness effects to context. In other words, the present research work was based on a mixed-methods approach to data analysis. The experimental study design was used to make up for the lack of reliable knowledge on the relationship of cognitive distortion to congruent factors, so the work makes a significant practical contribution to the study of the change blindness phenomenon.
Participants
 ). In addition, most of the participants in the sample (91.6%) were under the age of 53 inclusive, and the older population was not overrepresented.
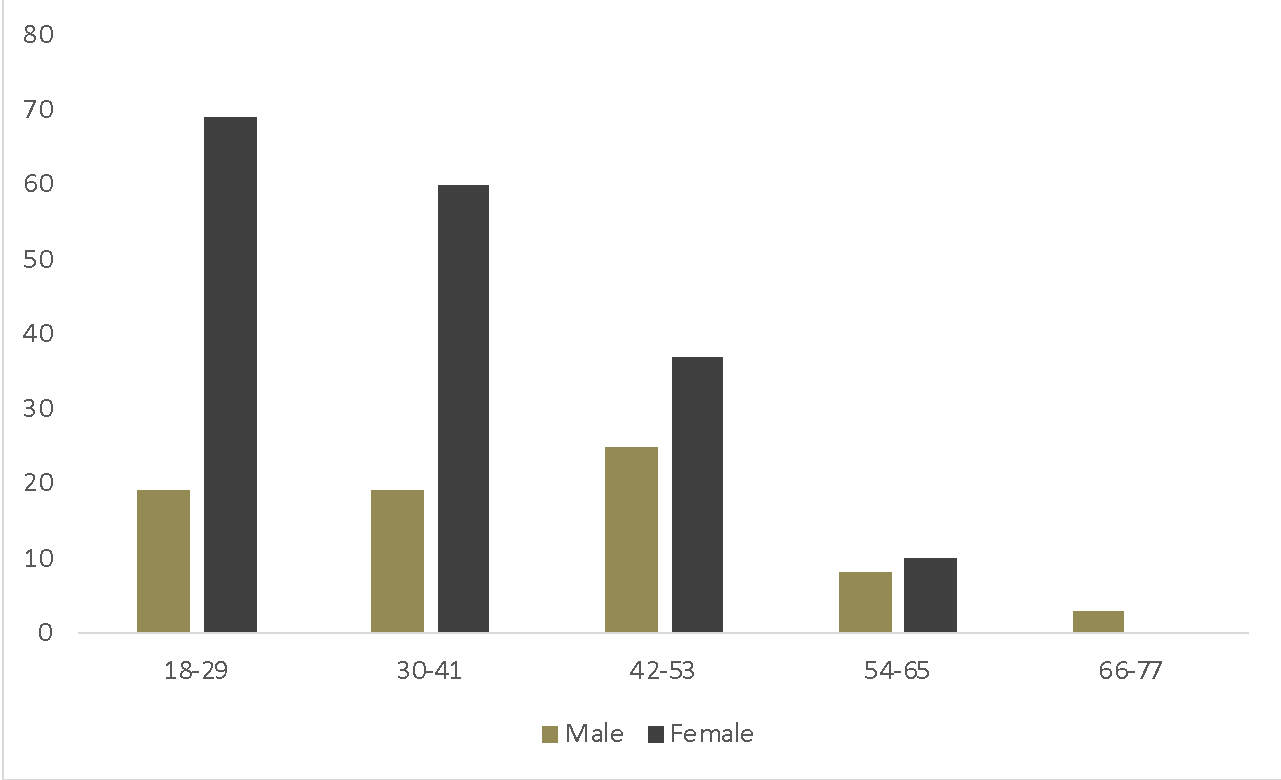
Variables
Demographic factors, including participants’ gender and age, were used as independent variables for this statistical experiment. Gender was estimated as a dichotomous categorical variable, whereas age was continuous and proportional, as age could take any value. Dividing the age variables into five conditional categories in Figure 1 did not make sense for further statistical analysis but was used strictly as part of the visualization of descriptive statistics. The three test levels were the continuous scale variables but already acted as dependent factors. The variable “Cong_Change” assessed the time it took respondents to recognize contextual changes in the image offered to them, whereas “Incong_Change” assessed the same metric but for non-contextual, inconsistent changes. Finally, the “Within_Change” variable did not reflect the possible influence of context since it included changes of both types. In fact, it acted as a control variable for post-validation.
Data Analysis
Statistical processing of the results was done through two avenues: measures of descriptive statistics and using a parametric ANOVA test. Because three levels were used as dependent variables, the t-test option was not relevant, unlike the ANOVA multiple comparison examinations, to determine statistical differences between them. Since there were two independent variables (age, and gender), it was decided to use a two-way ANOVA test without repetition since only one group of respondents was evaluated for patterns. The categorical variable gender was represented by two levels (male or female), so there were only two combinations of independent factors in the end, or a 2×1 treatment matrix was used.
Procedure
Each of the 250 participants was initially interviewed for gender and age and then invited to complete the test. During each of the three tests, the respondent had to determine what had changed in the image they were broadcasting, and the time taken to detect the change was recorded. Thus, for each of the sample respondents, a summary line was prepared in the final data set, reflecting the identification number of the participant — not used for the analysis — gender and age, as well as three values of the time spent on each of the test types. Respondents were previously asked to fill out an informed consent form to participate in the experiment and were briefly introduced to the ultimate goals and expectations of the entire study. After all, data were collected, they were prepared for statistical analysis; processing was done using SPSS.
Results
The preliminary results of processing the resulting data set are measures of central tendency for the dependent factors. Table 1 below nicely demonstrates the preliminary processing results. It seems that for congruent changes, the time taken was on average 20 percent lower than for noncongruent changes, and the lower value of the standard deviation indicates that the data were scattered around the mean much closer. All of the values of time taken appear to be close, from which we can conclude that descriptive statistics alone are not sufficient to produce reliable results.
Table 1. Results of descriptive statistics for dependent factors (obtained with SPSS).
For this reason, it was decided to use a two-way ANOVA test for the sample. A separate ANOVA test was performed for each of the three levels of dependent factors, the results of which are reported in Tables 2-4 for congruent, noncongruent, and non-pattern changes, respectively. The triplicate table summarizes the results. It is excellent to see that gender and age, as well as their combination, had a statistically significant difference for time spent only for congruent and noncongruent tests, but no significant similar pattern was shown for the third test.
Table 2. Results of two-way ANOVA test for each of the dependent factors; differences by test type are underlined with different color highlights (obtained with SPSS, modified).
Discussion
The present study aimed to determine whether the time taken for respondents to recognize visual differences was statistically significant in the context of change blindness. The working hypothesis was that contextual change was a predictor of change perception: precisely, congruent type of change associated with image context increased recognition time. A two-way ANOVA test was used to assess the potential influence of independent factors (gender and age) on the dependent variables.
Analysis of the results showed several intriguing patterns. First, using measures of descriptive statistics, it was found that the mean time taken to change blindness with contextual changes was 20% lower than for non-contextual changes, while the control test (mixed types) expectedly yielded an average result. In other words, an intermediate conclusion to be drawn from the descriptive statistics test is that congruent variables reduced the time to recognize differences. A deeper level of statistical analysis, two-way ANOVA, demonstrated a statistically significant effect of gender and age on change perception rates. In a two-way ANOVA, there was a statistically significant relationship between sex and gender for congruent changes (F=1.868,p=0.009) and non-congruent changes (F=1.588,p=0.041). To put it another way, gender and age were indeed related to perceptions of change.
The findings add to the existing literature as they introduce contextual effects into the study of change blindness. The patterns found well demonstrate that contextual and non-contextual perceptions are related to the age and gender of respondents, which contributes to a better understanding of the phenomenon of change blindness. Response to the research question posed in the Introduction, it was reflected that context matters for change blindness.
The findings of the study may be relevant in the real world, as change blindness as an understudied phenomenon of cognitive distortion of information cognition, demonstrates a relationship between gender and age. Based on the findings, change blindness management programs specific to demographic groups can be developed. The study was intense in terms of sample size and the novelty of the approach used. However, the weaknesses of the experiment include the inability to conduct posterior tests due to the peculiarities of data collection and the lack of division into demographic subgroups within the sample. Future development of the present study is of applied importance, as there is increased interest in determining specific patterns of the relationship between gender and age of respondents (as well as their combination) and the time to recognize a change. One avenue for future research is to conduct regression and correlation analyses to quantify the relationship.
Reference List
Briggs, G. and Davies, S. (2015) ‘Is seeing believing: visual perception and attention for dynamic scenes,’ Investigating Psychology, 2(2), pp. 110-156.
Levin, D.T. and Simons, D.J. (1997) ‘Failure to detect changes to attended objects in motion pictures,’ Psychonomic Bulletin and Review, 4, pp. 501–506.
Ma, E. (2020) Is it true that a person will take anything you hand them while they are talking on the phone?. Web.
Murphy, G. and Murphy, L. (2018) ‘Perceptual load affects change blindness in a real‐world interaction,’ Applied Cognitive Psychology, 32(5), pp. 655-660.
Norimatsu, S., Endo, K., Usugi, M., Niwa, A. and Tange, K. (2019) ‘Formulation of process improvement knowledge: 7 components of a good PI story,’ Journal of Software: Evolution and Process, 31(1), pp. 1-8.
Rensink, R.A., O’regan, J.K. and Clark, J.J. (1997) ‘To see or not to see: the need for attention to perceive changes in scenes,’ Psychological Science, 8(5), pp. 368-373.
Simons, D. (2010) Selective attention test. Web.