Introduction
There are many related phenomena in the cognitive processes of human consciousness whose effects may run unnoticed by the individual. Among such effects, particular attention should be paid to blindness to change as a demonstration of the imperfection of human attentiveness. Blindness to change should be understood as the process of not detecting any change if attention is briefly interrupted on an object (Briggs and Davies, 2022). Reference to the literature also provides an interesting definition that blindness to change is “the phenomenon witnessed when the observer struggles to spot a change that is easy to see when pointed out” (Hochhauser, Aran, and Grynszpan, 2018, p. 502). Blindness to change is thus a tool for distorting correct perception, demonstrating the imperfection of human attention.
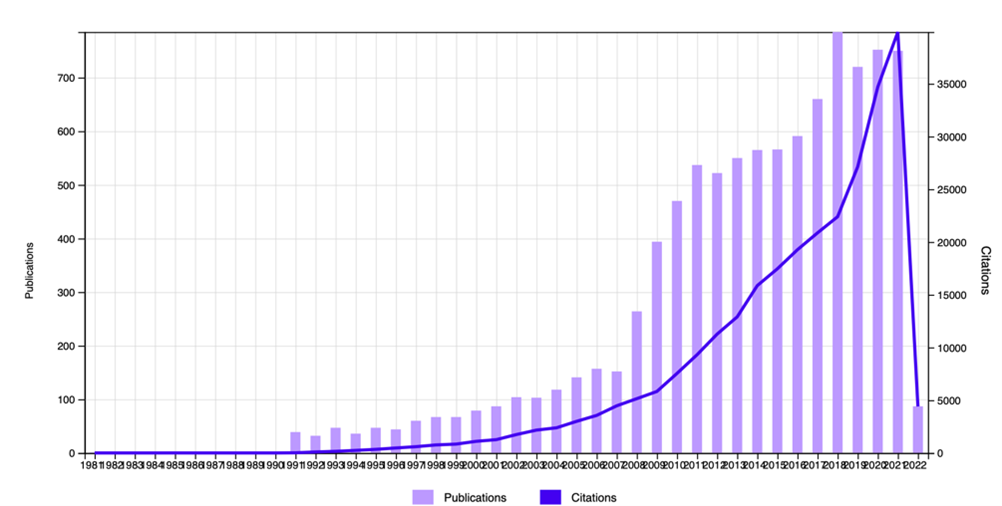
The phenomenon of blindness to change has been widely reported in the scientific literature. Reference to Figure 1 demonstrates that this effect of human perception is of great academic interest, as the number of topical publications and citations has grown almost exponentially over the last thirty years. This means that the research community is interested in learning more about the effects of blindness on change and identifying previously unknown facets of it. It has already been found that the frequency of this effect depends on the perceptual load on the individual, which means that the more difficult the task to discriminate, the more likely the individual is to commit an attentional error (Murphy, G. and Murphy, L., 2018). The discovery that such a phenomenon exists has led to an attempt to extrapolate this to animals; chimpanzees, dogs, cats, and pigeons have also been shown to miss details of changes when attention is briefly interrupted (Pastukhov and Carbon, 2021). It has also been pointed out that blindness to change can be disruptive for individuals, as in conditions where critical attention is required — for example, while driving a car — such blindness can lead to an accident (Gunnell et al., 2019). That said, a large body of research has found a dearth of reliable knowledge on the relationship of change congruence to the speed of perception.
Few authors have indirectly addressed the topic of context in the study of this phenomenon. Rensink et al. (1997) developed the flicker method, which allows an image to be shown to an individual at a certain speed to introduce change imperceptibly; flicker allows the immediate attention of the respondent to be diverted. Rensink et al. demonstrated the relationship between the flicker frequency of the scene and the rate at which changes were detected, depending on their location. In the present study, the authors decided to use the flicker-picture method to demonstrate its effect on the rate of recognition of congruent, non-congruent, and intracategorical changes. Congruent changes to the overall scene affect the context and are similar in meaning; in the experiment, a hole punch could be replaced by a stapler in an office setting. Non-congruent changes are any changes to the scene that is entirely out of context; a stapler could have been replaced by a banana. Finally, the intracategorical changes are the most contextually related, in which case a hole punch of one color could have been replaced by the same hole punch of a different color. Thus, the research hypothesis of the experiment was based on an unconditional recognition of context. It was hypothesized that changes that were more contextually related — intracategory and congruent — were more quickly recognized by individuals than changes with incongruent meanings.
Methods
Study Design
The present study was designed using a descriptive, experimental design, during which primary data was collected and subsequently analyzed to confirm the scientific hypothesis. This design involved running the tests among participants, as respondents did not exchange views, and the questions offered to them for testing were randomly shuffled, so it was impossible to know in advance which images in order the changes were introduced. Three independent variables were used in this study, which included the type of change introduced, namely intra-category, congruent and non-congruent changes. Manipulation of these types was used to estimate the time (speed) to detect them, which was the dependent variable of this test. The nature of the measurement of the dependent variable was based on a quantitative approach, as a result, measured only the time to detect changes in each of the scenes. Apart from the fact that respondents did not exchange information with each other and used the same link to pass the test and randomize the order of scenes, no additional controls were introduced.
Participants
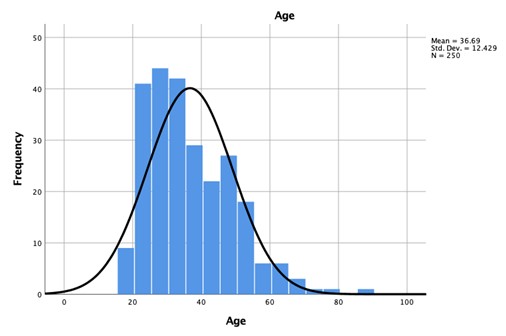
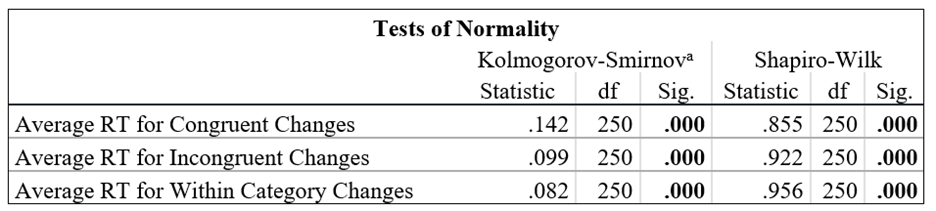
A sample of 250 respondents who were last year’s DE200 course students was collected for the test. The Open University students completed the test according to the requirements of their study module, but participation as such was strictly voluntary. Ethnicity, race, and occupational direction of respondents were not part of the study and therefore were not ascertained from participants; however, gender and age were important. The sampling design was based on non-probability convenience sampling. 32.8% of males represented the final experimental group and 67.2% of females were from different age groups, ranging from 18 years (minimum age to participate) to 87 years. Figure 2 shows the age distribution in the sample, from which it is seen that the mean age of participants was 36.69 (95% CI [35.14, 38.24]). The Kolmogorov-Smirnov (p<0.001) and Shapiro-Wilk (p<0.001) tests showed that the age distribution was not expected (Appendix B).
Materials
For this experiment, The Open University online platform was used, opening in a separate browser tab via a link offered to the students. Students were asked to complete the entire test in this environment, and no special equipment or skills were required to complete it; computer proficiency for clicking on images and entering text information into designated fields was essential. Licensed SPSS v.25 software, obtained through a university link, was used for statistical analysis – all statistical analysis procedures were performed strictly in SPSS v.25. A licensed MS Office package, namely WORD, was used to complete the report. No additional equipment was used.
Procedure
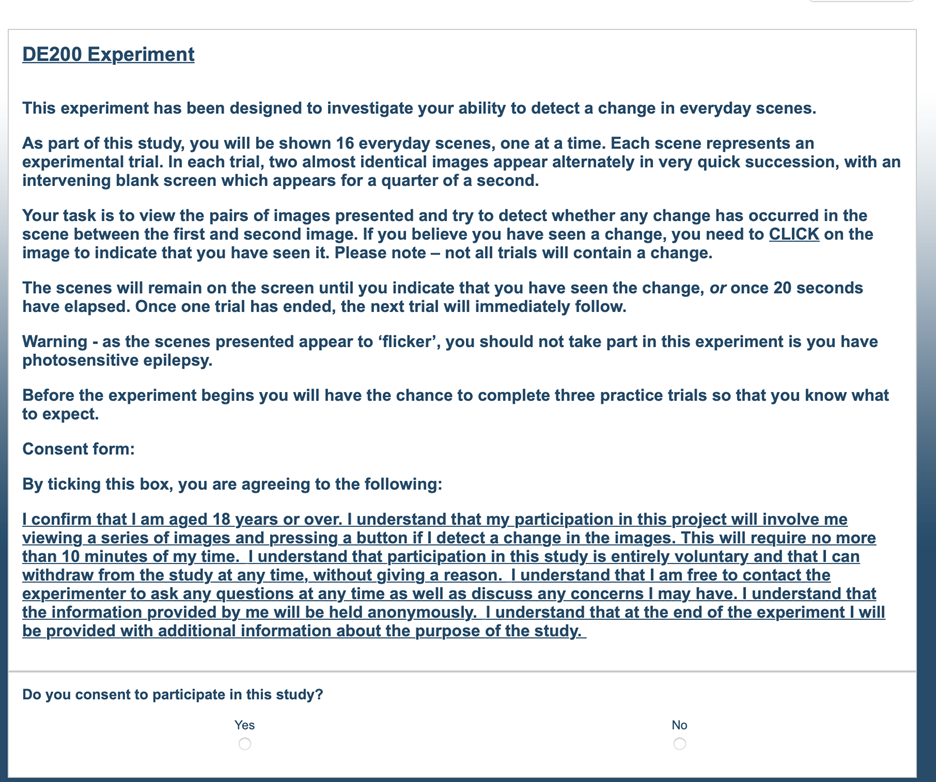
Test participants were asked to complete a short visual test during which they were presented with sixteen pictures of office or domestic scenes using an online form. Each of the images flickered at a rate of 0.25 seconds so that detailed, static observation of the scene was deliberately hindered. In 12 of the 16 images, one element of the overall scene was altered: a knife could lie in place of a plate or a book in place of a work phone. In a quarter of the trials, no changes were made because they were used as an honesty control for the test to ensure that participants did not just click on the picture but only did so when they detected a change. A countdown timer (20 seconds) was used for each exercise so that participants were aware of the time allocated to them. Prior to testing, respondents signed an informed consent form (Appendix A) and completed two demographic characteristics about themselves, namely age and gender. At the end of the test, the data was compiled into a single database and then used to perform statistical analysis in SPSS v25.0 using one-way ANOVA with replications.
Results
The ANOVA was preceded by examining the assumptions that allowed this test to be applied to the current dataset. First, the dependent variable (time) was measured at a constant quantitative level. Second, the same dependent variable was presented for the three dimensions depending on the type of change used. Although outliers were present at the three levels upwards, they were not significant, so the assumption of outliers is only partially supported.

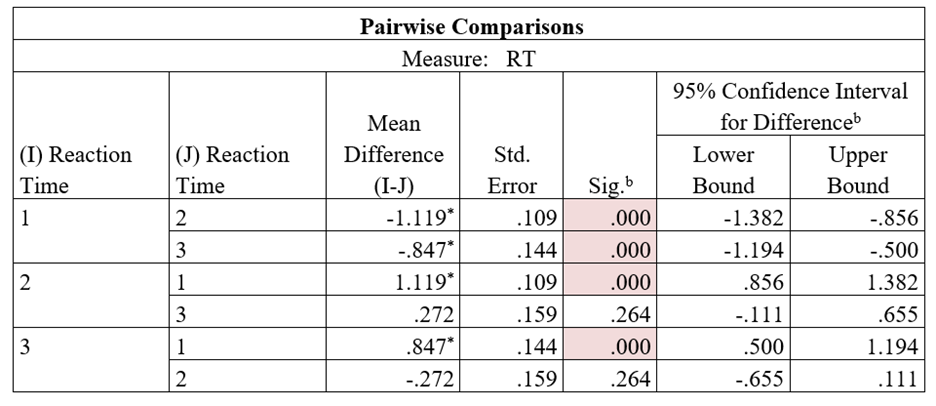
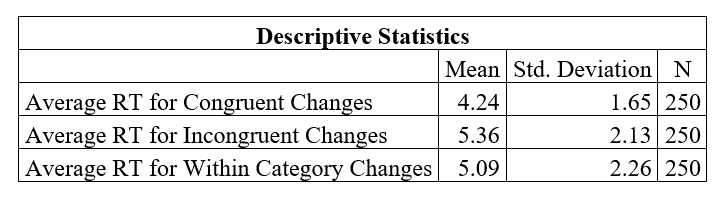
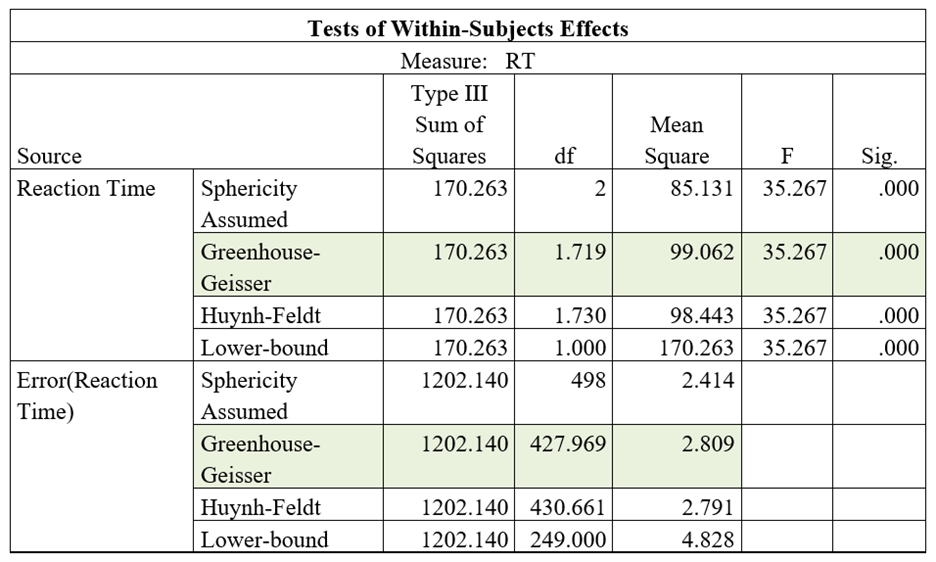
The results of the one-way ANOVA with replications (three levels) are published below. Of note are the results of the descriptive statistics — each of the measures had no outliers, with the mean values indicating that congruent changes took the least time to recognize (4.24 s) and had a minor variance (SD = 1.65). An ANOVA with replications showed that with the Greenhouse-Geisser correction, the mean reaction times to changes were statistically significantly different, F(1.719, 427.969)=35.267, p<.001, as shown in Appendix C. Although a statistically significant difference was identified, the focus is on determining where exactly the differences are found. Turning the Bonferroni test results (Appendix D) shows that a statistically significant difference is found between all measurements except the non-congruent and intra-categorical changes (p=0.264). Thus, a repeated-measures ANOVA with Greenhouse-Geisser correction demonstrated the statistical significance of the mean values in the different test types, with congruent changes showing a statistically significant difference with non-congruent and intra-category changes, whereas no significant difference was found between the latter two.
Discussion
The present study aimed to conduct a statistical analysis of previously obtained results from an experiment measuring reaction times to three different types of change in the light of change blindness. Change blindness postulates that an individual spends more time than usual recognizing changes in objects and scenes during a short-term loss of attention (Briggs and Davies, 2022). In the experiment conducted, the flicker method developed by Rensink et al. was used as a distraction. (1997). The results showed that the differences in mean reaction times were statistically significant for the three types of measurement, with the time for congruent changes being minimal. In other words, it follows from the results that contextualized changes, but with non-identical semantic substitution, are most quickly recognized by individuals.
Remarkably, it does not follow the results that there was a statistically significant difference between intra-category and non-category trials. In fact, this result seems surprising since both forms of embedded change actually represent diametrically opposed manipulations. Replacing objects in a scene by their context in a way that does not cause semantic matching errors (different colors of the same object) took the least time for respondents, as it probably involved areas of cognitive perception in which the overall context of the scene is analyzed. In fact, this study was one of the first in this area, as there is a paucity of reliable data on the relationship between change congruence and perceptual time in the academic literature.
The findings illustrate the applicability in real life as well, in areas that involve demands for increased attentiveness. For example, in driver training, these findings may be relevant to training drivers to respond to changes that are not context-specific — for example, if an animal instead of a car appears on the oncoming road. In addition, any manufacturing defects in conveyor-type workshops, where the quality control officer is required to be routinely vigilant, can be detected more quickly if the individual has been trained to look for not only congruent defects but also quality threats of the other two types. In areas where speed of response is of vital importance, be it civil aviation or neurosurgery, the use of congruent change capability has applied value by reducing the time to recognize differences. This might relate to the shape of the buttons on the flight deck or the color of the instruments used by surgeons — it is expected that the introduction of such practices will reduce reaction times.
The present study was conducted on a large sample of students (n=250) who did not communicate with each other during testing. The element of randomization of responses was also aimed at reducing the risks associated with bias — thus, the validity and reliability of the conducted test seem to be high. However, the study is not without limitations: firstly, it did not take into account that different students may use the computer at different speeds due to physical and cognitive characteristics, which may have affected the differences in time. Secondly, not all assumptions for the ANOVA were fully met. Third, the changes only affected the home and office environment, so it is difficult to say that they can be extrapolated to changes in other environments as well. Removing the described limitations, expanding the sample, and plugging in demographic characteristics are of interest for future research in this area.
Reference List
Briggs, G. and Davies, S. J. (2022) Chapter 3: is seeing believing? Visual perception and attention for dynamic scenes. Web.
Gunnell, D.O., Kunar, M.A., Norman, D.G. and Watson, D.G. (2019) ‘The hazards of perception: evaluating a change blindness demonstration within a real-world driver education course,’ Cognitive Research: Principles and Implications, 4(1), pp. 1-16.
Hochhauser, M., Aran, A. and Grynszpan, O. (2018) ‘How Adolescents with autism spectrum disorder (ASD) Spontaneously Attend to Real-World Scenes: Use of a change blindness paradigm,‘ Journal of Autism and Developmental Disorders, 48(2), pp. 502-510.
Murphy, G. and Murphy, L. (2018) ‘Perceptual load affects change blindness in a real‐world interaction,’ Applied Cognitive Psychology, 32(5), pp. 655-660.
Pastukhov, A. and Carbon, C.C. (2021) ‘Clever cats: do they utilize change blindness as a covered approaching strategy,’ i-Perception, 12(1), pp. 1-3.
Rensink, R.A., O’Regan, J.K. and Clark, J.J. (1997) ‘To See or Not to See: The Need for Attention to Perceive Changes in Scenes’, Psychological Science, vol. 8, pp. 368-373.
Appendix A
Initial Screen of Participation in the Experiment (Informed Consent)
Appendix B
Kolmogorov-Smirnov and Shapiro-Wilk Normality Test (created by SPSS v25)
Appendix C
Table of Intra-Subjective Effects Tests (created by SPSS v25)
Appendix D
A Posteriori Bonferroni Test for Detecting Differences (created by SPSS v25)