Introduction
The use of network mapping software is a cornerstone of applied statistical research. In this paper, NodeXL is used to study the interactions of five competing companies in an industry market to estimate the parameters of their Twitter communication. The central objective of such a study is to examine the place and role of RDAs in market positioning as a function of the relationships created and maintained with other users.
Social Media Audit
The best way to identify RDA’s critical agents of influence is to use data collected over the past twelve months on company tweets that mentioned or referred to other users. Using NodeXL, a network map was constructed that shows the connections between the customer and stakeholders that RDA interacted with on Twitter over the past year (Aldhous, 2022). As can be seen, RDA interacted with ten agents, among which were both company accounts and personal user accounts. The calculated centrality for RDA was 10, indicating the high importance of RDA for this graph.
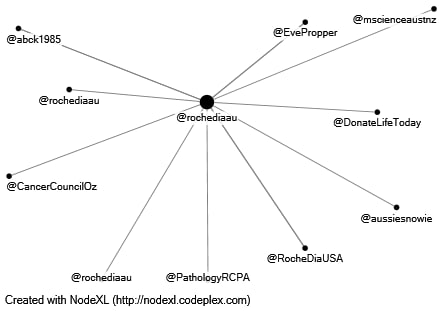
A content analysis of the tweets that were implemented in this network map shows strictly positive connections between nodes. Users who mentioned RDA in their messages (@mmkamper, @DonateLifeToday, @ConqueringCancr, @aussiesnowie, @mscienceaustnz, @RocheDiaUSA, @EvePropper, @abck1985) expressed words of thanks and support to RDA, although the general context of tweets rated sentimentally is seen as neutral. For example, specific tweets included “Thanks to @rochediaau for supporting,” “@rochediaau Thank you for the follow!”, “@rochediaau Looking forward to it!” The rest of the tweets responded by mentioning the RDA as a stakeholder, mostly when organizing a particular event. On the other hand, when the author of the tweet was RDA, the mention of accounts was based on designating stakeholders in specific events (e.g., conferences) or informing users about the company’s partners. Notably, all messages in this direction also had a positive context and were meant to thank, support, or address the user directly.
Thus, in terms of findings, the RDA actively engages in communication with other accounts and extensively quotes individuals or companies in its messages. The two-way communication is positive and reflects the involvement of both parties. The calculated Betweenness Centrality (1.20) and Closeness Centrality (0.16) show a good relationship between stakeholders. Meanwhile, of the total number of RDA tweets over the past twelve months, less than 10 percent contained an appeal or mention, from which it can be concluded that the company’s communication activity over the overall period is low.
Engagement on Competitor Pages
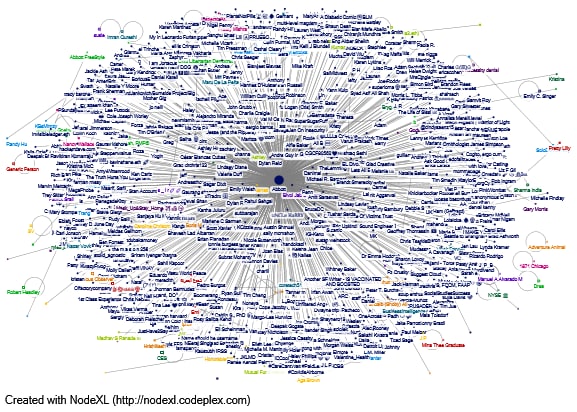
The second part of the paper asked for the same steps used in this case for RDA’s direct competitors. Three companies in the same industry in the Australian market were considered competitors: @AbbottNews, @Hologic, and @LeicaBio. The network map visualization procedures were similar; Figure 2 shows the relationship network for @AbbottNews. Obviously, the number of relationships for this is competitively prohibitive many times greater than what was relevant for RDA. In its tweets, @AbbottNews regularly reaches out to customers, influencers, and company profiles to mention, express words of support and gratitude, and maintain dialogue. For this reason, the key metrics in this graph respond to high proximity: the average Betweenness Centrality was significantly higher than for RDA at 280.68, and the average Closeness Centrality was 0.11. This indicates significantly more developed connections for @AbbottNews. Sentiment analysis performed for all tweets in this column shows a more negative tone for messages than positive or neutral (MonkeyLearn, 2022; Jagota, 2020). This includes tweets containing the following wording: “…we are sorry for the frustration,” “we’re sorry to hear this,” and “we understand the concern. However, there are both neutral and positive contexts, but the overall proportion of negative contexts is significantly higher than for the RDA.
The second client for the RDA was @Hologic, whose network map is shown in Figure 3. In this case, the number of connections is significantly less, and they tend to be exceptional. This is confirmed by the graph metrics: the average Betweenness Centrality was 0.11, and the average Closeness Centrality was 0.352. A sentimental analysis of the content of the tweets shows that the context of communication is mostly positive, which includes mostly references to favorable collaborations: “in partnership with @Hologic,” “Thank you for joining our,” and “We are proud that @Hologic trusted.” In this sense, the number of @Hologic communications is significantly lower, but their quality is higher.
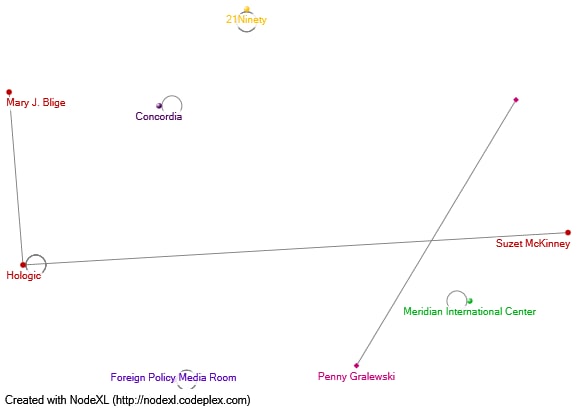
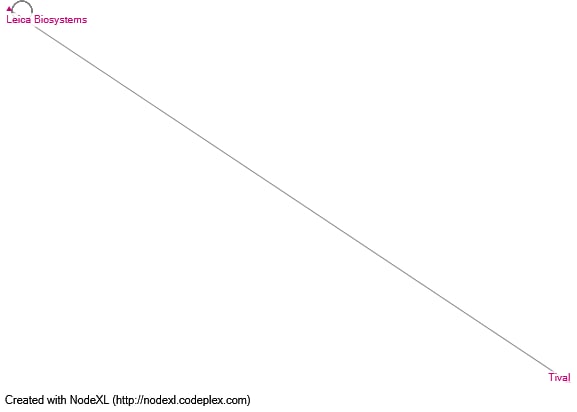
Figure 4 provides information about the network communications for another RDA competitor, @LeicaBio. It is easy to see that the number of communications, in this case, is minimal: in twelve months, @LeicaBio only contacted @valmaret, and that tweet was a reply. For this reason, the average values of key metrics for this graph were also minimal and were 0.00 (Betweenness Centrality) and 1.00 (Closeness Centrality). Thus, in terms of communication competitiveness, RDA significantly outperforms @LeicaBio.
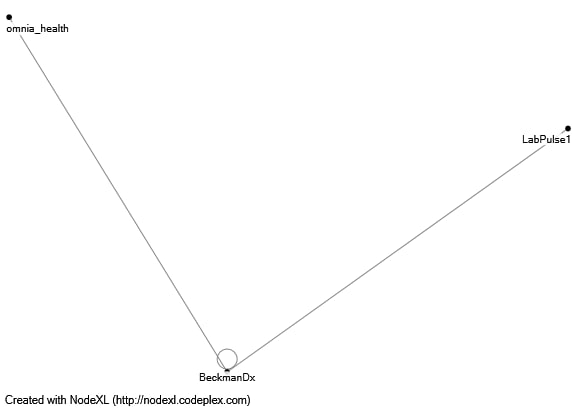
Finally, the last industry competitor in the review in the Australian market is @BeckmanDx. However, even in this case, the number of communications was deficient: during the reporting period, @BeckmanDx never addressed other users in its tweets and received only two mentions from them (Fig. 5). The average values of key metrics for this graph were also minimal and were 0.33 (Betweenness Centrality) and 0.39 (Closeness Centrality). Sentiment analysis shows that these messages were positive in nature and contained valuable information that stakeholders sought to convey to users.
Thus, the competitive analysis performed with NodeXL showed ambiguous options. On the one hand, there may have been a more comprehensive network map for competitors, responding to more communications in a year, as was shown for @AbbottNews. However, such tweets had a higher number of negative reviews and words of an apology than for the RDA, indicating that the competitor had more frequent problems. On the other hand, RDA had more extended communication than the other three competitors and received encouraging messages from users more often. Thus, it can be concluded that RDA is on the right track to achieve effective communication on Twitter, but the company is advised to invest in increasing referrals to other users and increasing citations to achieve global goals.
References
Aldhous, P. (2022) NodeXL for network analysis.
Jagota, A. (2020) Text sentiment analysis in NLP.
MonkeyLearn (2022) Play around with our sentiment analyzer, below.