Introduction
Over the last one decade, policymakers and regulators have shown an increased and concerted effort towards mitigation of climate change. Market based pollution permit trading programs comprise the chief mitigation strategies that have been implemented to regulate industrial pollution. Tradable permit programs establish a clear price signal that serves as a guiding principle for development and evaluation of efficient pollution control technologies. Emission-trading programs have been regarded as fair mechanisms for alleviating climate change. Therefore, they are more acceptable than other forms of environmental regulation.
They encourage decentralised decision-making. The driving premise of the cap-and-trade (CAT) approach to regulating carbon emissions is that an efficient permit market will direct firms with the lowest abatement costs to reduce emissions first. The aim of tradable permits is to promote reduction of undesired industrial emissions into the environment. The plan is to reverse the adverse effects that such emissions have caused to the environment. The independence of permit market outcomes and initial allocation of permits explains why cap-and-trade systems have emerged as effective instruments in a variety of environmental policy settings. This paper critically examines tradable permit programs in the US and Europe by analysing the programs based on structure, costs, extent, key players, results, and effectiveness.
How Cap and Trade Works
The Cap and Trade is the most efficient approach to safeguarding the environment against global warming. This phenomenon has become the greatest threat to global health and economies. According to Bushnell and Chen, greenhouse gas emissions from industrial and domestic sources have adversely contributed to climate change. This situation has led to change of weather patterns. As a result, human economical and health processes have been affected largely by changing climate patterns. For instance, the rise in temperatures has resulted in melting of ice in Polar Regions. This state of affairs has caused a rise in the sea level. The Cap sets a limit on the maximum tons of emissions that sources can release to the atmosphere. This limit is lowered over time to reduce the amount of emissions.
The trade creates a market for carbon allowances. Montero posits that this situation enables organisations engage in more innovation with a view of meeting the regulatory standards or rather falling within the allocated limits. Less emissions correlate with less payments. This strategy automatically regulates emissions since the firms come up with new production technologies in a bid to cut costs that are related to such emissions. The ultimate result is reduced pollution that promotes a clean environment. Companies that exceed the set limit of emissions are penalised. Therefore, the Cap and Trade system is the surest way to limit pollution as it covers the major sources of undesired emissions from all sectors of the global economy such as natural gas, transportation, electric power generation, and large manufacturers among others. Permits are auctioned to polluting entities whereby the total amount of allowances equals the cap.
Benefits of Tradable Permit Schemes
The Cap and Trade is an effective system to mitigate pollution effects that are caused by deliberate and insensitive production methods. It offers companies a room for innovation as they look for better and environmentally sensitive industrial practices. Failure to innovate attracts abatement costs that reduce profit margins. Consequently, this situation threatens the success of the firms. It calls for such organisations to seek alternative production technologies that reduce costs on permits to remain in vigorous business.
In fact, companies can turn pollution costs into revenue if they can implement cheap mitigation initiatives. They can trade extra allowances with other companies. For instance, a notable advantage of the cap and trade system is that it provides incentives for constant innovation with an aim of reducing industrial emissions. This strategy contrasts the traditional command-and-control regulations whereby such incentives went beyond the guiding standards that were not provided. Indeed, discouragement can arise due to the feasibility of additional effort that can attract future regulations that are more stringent. Therefore, such financial incentives encourage private sectors to constantly seek new emission-reducing technologies that regulators cannot expect under more prescriptive command-and-control regulations.
Most emission reducing systems are achievable through innovations. This phenomenon is particularly important because confronting the global challenge of climate change will require new production technologies to achieve the most significant emission cuts that are necessary. In addition, through trading of allowances, companies with less pollution are able to meet annual caps. This alternative to buy allowances offers firms some degree of flexibility. Finally yet importantly, whilst companies exchange allowances with each other, the number of permits remains the same; hence the annual limit is still reached.
Cap and Trade in Action in Europe and the US
The European Union’s Emission Trading Scheme (EU ETS) is the pioneer cap-and-trade program aimed at reducing undesired greenhouse gas emissions. It was formed to guide the European countries in their commitment to the Kyoto Protocol. The program involves 28 European Union member countries and substantially large industrial firms such as electricity generators and petroleum refiners, as well as those that produce iron, steel, cement, glass, and paper. The EU ETS plays a central role in regulating and reducing industrial greenhouse gas emissions economically. It covers 31 countries with over 11,000 power stations and industrial plants and airlines. The EU ETS projects that emissions from covered sectors will be 21% lower than in 2005. 20 years later, emissions will be reduced further by 43%.
The EU ETS imposes heavy fines for companies that do not surrender enough allowances to cover their emissions. It allows companies to keep spare allowances for future use. Alternatively, the firms can trade them with other companies that have inadequate allowances. This strategy results in trading flexibility that ensures emissions are reduced using less outlays. Tagging a price on carbon (assigning a financial value to each ton of emissions saved) has placed the EU ETS in the forefront to deal with the global climate change menace.
Consequently, companies in Europe have the legal duty of complying with these regulations. Through the cap and trade system, the EU ETS encourages companies to invest in clean, low-carbon technologies. This move has attracted less cost on permits; hence, it has led to saving of energy. Furthermore, the EU ETS allows companies to buy international credits. This phenomenon is a major incentive for investment in clean technologies and low-carbon solutions, particularly in third world countries.
Notable sources of transaction costs in the EU ETS are the obligations that pertain to monitoring, reporting, and verification (MRV). Firms are obliged to calculate emissions. This situation calls for collection of data on emissions at the installation level. The initial level must be analysed for emissions reporting per annum. The fact that emission data needs to be verified by a certified and independent third party, installations have to incur related authentication costs.
Moreover, data must be reported to the national authorities in a homogeneous form. This process requires additional time and costs. The annual MRV process is mandatory for the covered firms in the EU ETS. For phase III of the EU ETS from 2013 to 2020, the EU commission formulated tougher guidelines and new rules to ensure strict adherence and compliance for better results. In this segment, the allocation will be based on the product benchmarks for industrial installations. Although the application process for free allocation demands extra time and is costly, firms will receive indirect subsidies via freely allocated permits after presenting feasible applications.
Extent of Coverage and Results
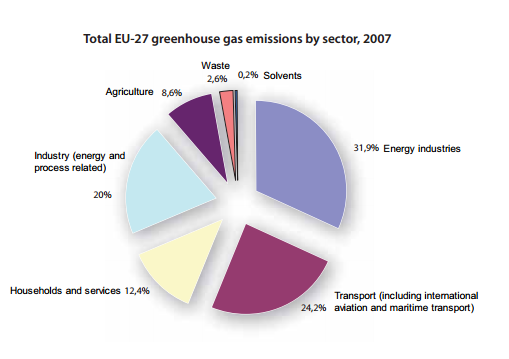
The EU ETS covers approximately 45% of the greenhouse gas emissions from the 28 EU countries. The greenhouse gases covered include carbon dioxide (CO2) and nitrous oxide (N2O) from power and heat generation. The sectors involved include energy-intensive industries such as oil refineries, steel works, and those that produce iron, aluminium, metals, cement, lime, glass, ceramics, pulp, paper, cardboard, acids, and bulk organic chemicals. Commercial aviation is also covered by the EU ETS. See figure 1.0 below for a detailed source of greenhouse gases in Europe.
Emissions trading can cover numerous economic sectors and greenhouse gases. Nevertheless, the EU ETS focuses on measurable emissions that can be reported and verified with a high degree of accuracy. The EU ETS has made involvement of companies operating in the abovementioned sectors. Avoidance of this obligation attracts huge penalties. However, only plants above a particular size are covered in some sectors. Governments exempt small installations from the system in cases where fiscal or other measures are in place to cut their emissions by an equivalent amount. The EU ETS also covers CO2 emissions from flights within and across countries that participate in the system. International flights to and from non-ETS countries are also subject to the system.
The EU ETS program works in phases. The first phase was completed been between 2005 and 2007. However, the first phase was not successful. In fact, it was criticised since it failed to attain substantial emissions cuts. It allowed the involved companies to transfer carbon allowances free of charge; hence, it attracted huge profits. The criticisms were viable since the first phase was deemed to have achieved minimal results. The second phase was accomplished between 2008 and 2012. It coincided with the commitment to the Kyoto protocol. This phase was regarded as an improvement based on the lessons that were learned from the first phase. The average emission reductions results that were obtained in 2008 suggested that the program was effective as compared to that of 2007. Nonetheless, the Cap and Trade program in Europe has not achieved much as compared to that of the US. Furthermore, the second phase of EU ETS does not provide consistent results.
Effectiveness and Compliance
As a market-based instrument that puts a cost on carbon, Parmesan and Yohe reveal that the EU ETS ensures compliance by incorporating a stout outline of measure that also forms a basis to economic and innovative incentives.
Installations ought to submit a number of allowances corresponding to their verified CO2 emissions every year. The system then cancels these allowances to avoid reuse. However, installations with surplus allowances can trade them or bank them for use in the succeeding year. Installations that do not submit enough allowances to cover their corresponding emissions in the previous year of operation face tough punishment, which involves heavy fines. Consequently, they have to obtain additional allowances to compensate for the deficit in the following year over and above having their names published publicly. They must also pay a dissuasive fine for each excess ton of CO2 using the Euro as their exchange currency. Some member states have also laid down further dissuasive sanctions at the national level for any infringements of the EU ETS rules.
This structure of operation has been regarded as an effective approach to ascertain compliance and to achieve the systems mandate and the Kyoto protocol. Since there are no firms intend to incur such additional costs, timely compliance and purchase of allowances or adoption of better, efficient, and innovative technologies remain the only options to sustain production.
Cap and Trade Programs in the US, Extent of Coverage and Results
In the US, the Cap-and-Trade system plays a major role in climate change mitigation. The US government recognises that successful cap and trade programs has the potential to boost innovative and efficient production in firms since it promotes timely actions by providing environmental answerability without necessarily hampering economic growth. Cap-and-Trade programs in the US include the Acid Rain Program (ARP) and the Clean Air Interstate Rule (CAIR). According to the United States Environment Protection Program (EPA), the ARP program aims at reducing the primary precursors of acid rain that include sulphur dioxide (SO2) and nitrogen oxides (NOx) that are primarily poisonous emissions from power sector.
To ensure seriousness and consistent compliance by the sources, the US program puts an unending Cap on the total amount of SO2 that can be emitted by the electric generating units (EGUs) of the bordering states. Since its inception in1995, the ARP program has attained momentous emission reductions.
On the other hand, CAIR focuses on regional inter-state transport and ozone pollution. The program seeks to ensure that certain eastern states limit the annual emissions of SO2 and NOx that cause the formation of fine particulate matter. In addition, it requires those states to reduce the ozone season NOx emissions. They are also expected to minimise the main contributors of smog formation during the summer ozone season. To achieve the target reductions, Stavins reveals that CAIR involves three distinct Cap-and-Trade initiatives namely the CAIR SO2, CAIR NOx annual, and CAIR NOx ozone season trading programs.
The CAIR implementation has seen major achievements including drastic reductions of fine particulate matter emissions (PM2.5) and ozone formation. This situation has resulted in improved health benefits and visibility of national parks and freshwater aquatic ecosystems in the eastern United States. The United States Environment Protection Agency (EPA) releases annual progressive reports on the achievements of the CAIR and ARP programs. Data collected from monitoring networks reveals that there has been a notable decline in SO2 emissions from the power sector. As a result, the quality of the air has significantly improved in the US as compared to previous years. Based on the EPA’s air trends data, the national composite average of SO2 yearly mean ambient concentrations decreased by 85-percent between 1980 and 2012 (See graph 1.0 below. The information is based on state, local, and EPA monitoring sites that are located primarily in urban areas).
Two landmark single-year reductions (each accounting for over 20 percent reduction) were noted in the first year of the ARP program between 1994 and 1995, and between 2008 and 2009 just before the commencement of the CAIR SO2 program. These trends correlate with the regional ambient air quality trends that were evidenced by the Clean Air Status and Trends Network (CASTNET). These results reveal that the programs have been effective and reliable as mechanisms to litigate climate change in the US.
Effectiveness of the Cap and Trade system
The chief reason why the Cap and Trade system has been preferred as the surest way of litigating climate change is its degree of its effectiveness. The system requires constant and accurate monitoring of emissions to assess its efficiency in controlling greenhouse emissions. The Environment Protection Agency (EPA) has developed detailed procedures to ensure that the sources of emissions keep a close track of progression with a view of providing precise and consistent reports.
To achieve this degree of accuracy, the sources use continuous emission monitoring systems (CEMS) or other approved methodologies. As a legal requirement, the emission sources should conduct daily and quarterly calibration tests to ensure high quality assurance. In addition, mid-year and yearly relative accuracy test audits must be conducted to ensure an acceptable level of emissions. 99-percent of the emissions are measured by CEMS. These tests improve the accuracy and consistency of results such that a ton of emissions that is measured at one facility corresponds to the same quantity at a different facility. In this manner, the market stakeholders are assured of reliable data and reports.
The quality of ARP and CAIR data tests are guided by two founding doctrines. The first one entails providing complete hourly reports and recordings of every operation while the second one involves monitoring key restrictions using CEMS or approved alternatives. EPA initiated the quality assurance (QA) program to ensure that the provided data reflects real and accurate emission reductions in the United States.
Recommendations
At the outset, there is need for the program to induce a shift towards low carbon technologies to ensure that the EU ETS remains efficient. This situation will promote the achievement of a sustainable emissions reduction rate. There is no substantial evidence to show that the systems of directly regulated firms had any causal impact on the innovations in phase I and II. The US programs have been proved to have induced innovative technologies in the sources of emissions through stringent monitoring of reduction processes. As a result, the US has realised empirical milestones in climate change litigation. In the US, there are different programs under the two umbrella programs. If the EU ETS will delegate authorities to sub programs in a differentiated manner, each tackling particular types of emissions, it can undoubtedly achieve better and consistent results.
Conclusion
The two leading sources of greenhouse gases (GHG) emissions are Europe and the US. However, they have acknowledged the severe effects that such emissions have on the global climate. The greatest challenge of the present day industrial processes is unremitting emission of toxic gases that continue to alter the weather patterns, a situation that has had profound effects on human health. However, governments around the world have shown a great concern over this subject. As a result, various strategies have been implemented in an attempt to litigate climate change. For instance, the use of the Cap and Trade program the US has made a milestone in reduction of greenhouse gases that are responsible for acidic rain in northeastern America. Similarly, the system has had promising benefits in the reduction of industrial emissions in Europe. The Cap and Trade has proven efficient, extensive, and the surest way to combat climate change. Although the system failed to work in the first trial of phase one in Europe, subsequent phases have shown consistent and feasible results.
Bibliography
Bushnell, James, and Yihsu Chen. “Allocation and leakage in regional cap-and-trade markets for CO2.” Resource and Energy Economics 34, no. 4 (2012): 647-68. Web.
Chapman, James. “Linking a United States Greenhouse Gas Cap-and-Trade System and the European Union’s Emissions Trading Scheme.” Vermont Journal of Environmental Law 11, no. 1 (2009): 45-106. Web.
Ellerman, Denny, and Paul Joskow. The European Union’s emissions trading system in perspective. Arlington, VA: Pew Centre on Global Climate Change, 2008. Web.
Gagelmann, Frank, and Bernd Hansjürgens. “Climate protection through tradable permits: the EU proposal for a CO2 emissions trading system in Europe.” European Environment 12, no. 4 (2002): 185-202. Web.
Hahnemann, Michael. “The Role of Emissions Trading in Domestic Climate Policy.” Energy Journal 30, no. 1 (2009): 73-108. Web.
Koutstaal, Paul, and Andries Nentjes. “Tradable carbon permits in Europe: feasibility and comparison with taxes.” Journal of Common Market Studies 33, no. 2 (1995): 219-233. Web.
Montero, Juan-Pablo. “Marketable Pollution Permits with Uncertainty and Transaction Costs.” Resource and Energy Economics 20, no. 8 (2011): 27-50. Web.
Parmesan, Camille, and Gary Yohe. “A globally coherent fingerprint of climate change impacts across natural systems.” Nature 421, no. 6918 (2003): 37-42. Web.
Stavins, Robert. “A meaningful US Cap and Trade system to address climate change.” Harvard Environmental Law Review 32, no. 1 (2008): 293. Web.
United States Environment Protection Program (EPA). “2012 Progress Report: Clean Air Interstate Rule, Acid Rain Program and Former NOx Budget Trading Program.” Progress reports. Web.