Introduction
The first question this research attempted to explore was how different water treatments affect maximum plant height. The hypothesis stated that the greywater would result in shorter plants in the experiment because such water has potentially harmful chemicals and materials that may have adverse impacts on the soil in the long run. Along with this hypothesis, a prediction was made that, if the greywater negatively influenced the plant height, the tap water would yield taller plants because such water is much cleaner and rich in nutrients. The experiment involved 12 plants – 6 plants for each type of water.
Main body
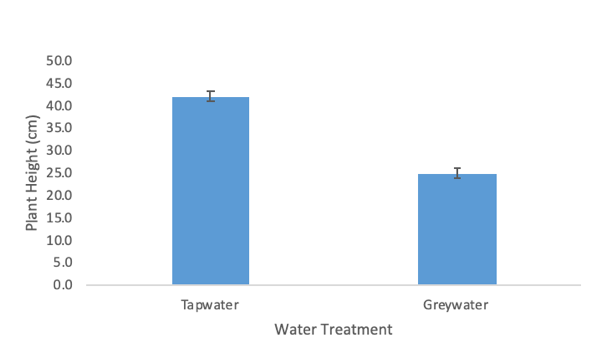
The resulting plant height was used as the response variable for testing this first hypothesis, and tap water and greywater were used as the independent variables. The data was collected and recorded on a spreadsheet, and an analysis of variance was performed on the data. Greywater plant heights ranged from 21.3 cm to 29.0 cm. The mean plant height was 24.9 cm, with an SEM of approximately 1.12 (n = 6). The distribution of the data was normal, and no significant deviations were indicated. For the plants watered with tap water, the minimum height was 40.1 cm, and the maximum height was 49.2 cm. The mean height was 42.0 cm, with an SEM of roughly 1 (n = 6). Similar to the results of greywater use, no substantial deviations were recorded, and the distribution was normal.
There is a significant correlation between the type of water used and the resulting plant heights. For each instance of the sample, the plant height was significantly higher when watered with tap water. The error bars of the two means do not have any overlapping areas. The plant heights for greywater and tap water do not have intersections even when SEM is taken into account. Minitab analysis is provided in Table X (Appendix).
The study also tried to determine whether there is a difference in the relationship between the length of the largest leaf and the width of the largest leaf when different water types are used to grow the plants. The hypothesis for this question was that the leaves of plants that were sustained with greywater would be smaller in both width and length compared to the leaves of the plant that was watered with tap water. Should this hypothesis be proved, using tap water would consistently yield bigger leaves than the plants watered with greywater.
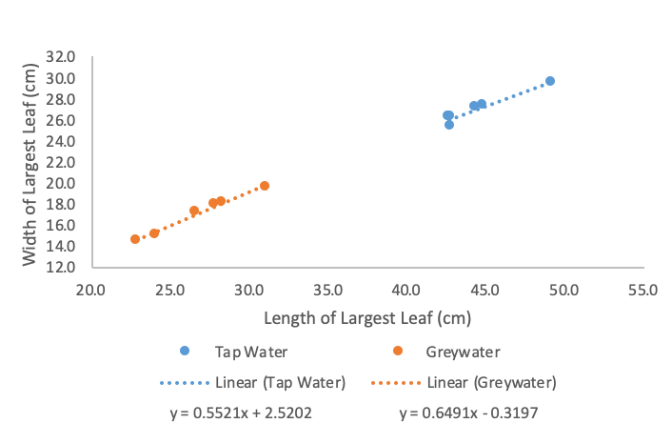
The length of the largest leaf and the width of the largest leaf were used as the response variables for this part of the experiment. As with the previous hypothesis, the type of water was used as the independent variable. Greywater yielded smaller leaves both in length and width – the longest leaf was 31.0 cm and 19.5 cm in width, and the shortest one was 22.8 cm and 14.4 cm in width. The mean length of the biggest leaf was 26.4 cm, and the mean width was 17.0 cm. Tap water resulted in larger leaves – the longest leaf was 49.2 cm and 29.6 in width, and the shortest leaf was 42.6 cm and 26.3 cm in width. The means are – 44.4 cm for the length and 27.0 cm for the width.
To visualize the relationship between the length and the height, the data on both greywater and tap water instances was put on a scatter plot. The graph shows that as the leaves get more noticeable in length, the width grows linearly for both tap water and greywater plants. However, leaf sizes of greywater plants are consistently and significantly smaller than leaf sizes of tap water instances. Minitab analysis is provided in Table X (Appendix).
The last question this experiment aimed to answer was whether there is a relationship between different water treatments and the number of leaves on the plants. The hypothesis stated that plants would have fewer leaves when watered with greywater compared to tap water. If the hypothesis is proved, then the prediction which prognosticates that using tap water results in a greater number of leaves will be correct and further research on the exact causes will be needed.
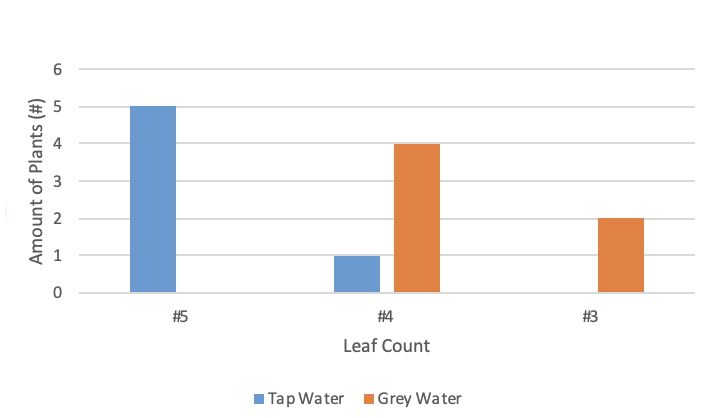
Considering both tap water and greywater instances, Leaf count varied from 3 leaves in the smallest plant to 5 leaves in the largest instance (n = 12). Greywater plants had a fewer number of leaves compared to tap water plants. There were 2 greywater instances with 3 leaves, and 4 plants with 4 leaves. No tap water instances had fewer than 4 leaves – 5 plants from the sample had 5 leaves, and only 1 had 4 leaves.
Conclusion
Like the prediction previously had stated, water treatment had a significant impact on the number of leaves on the plant. On the graph, greywater plants are situated strictly to the right, with no occurrences of plants that have more than 4 leaves. In contrast, tap water plants are on the left of the graph, with no occurrences of plants that have less than 4 leaves.