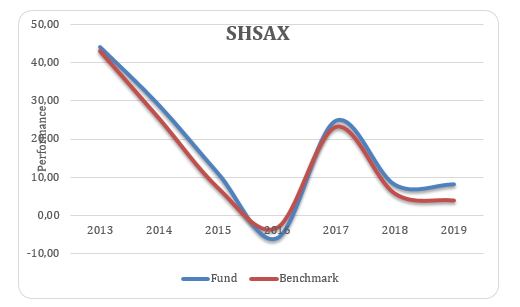
The investment due diligence analysis has been performed to assess the performance of three funds, which are SHSAX, GGHCX, and FHEAX. The obtained results indicate that the best option to invest in is SHSAX. As compared with the other two funds, SHSAX has had the best performance over the last six years, mostly outperforming its benchmark (see Figure 1). Of all the three funds, SHSAX has the lowest maximum drawdown, so the choice of this fund will lower the overall risk of a portfolio (see Figure 2). Given that the demand for healthcare products is expected to grow in the next three years, it is possible to state that this fund will offer a respectable return on investments.
3-year Equity Markets Outlook
There will be a slowdown in the economic growth of the US between 2019 and 2022. The US GDP will stay positive over the next three years, yet the annual growth will slow. The unemployment rate will slightly increase to 3.7% in 2020 and to 3.8% in 2021 (Maher 2019, para. 3). Inflation is going to rise by 0.4% in 2020 and 0.1% in 2021 (Maher 2019, para. 3). With housing comprising a significant part of the US GDP, the real estate market is an indicator of economic health whose stability is driven by the expansion of the US economy.
Given the expected moderate growth both in the GDP and the employment rate for 2020- 2022, the demand for the real estate will remain positive yet become slightly lower as compared to 2019 (Maher 2019). Given the moderate supply, the real estate will be able to generate healthy NOI growth. Thus, through 2022, there is a positive outlook for the US real estate fundamentals.
Healthcare sector is expected to be the most attractive investment option with the demand for healthcare services and products being on the rise. Due to the aging populations and advancements in innovative IT technologies, the healthcare demand will increase in the next three years (The IQVIA Institute for Human Data Science 2019). With the spending projected to grow at the annual rate of more than 5%, the US healthcare expenditures will rise by almost $3 trillion in 2022 (Deloitte 2019, p. 8). However, government actions, coupled with fiscal policy concerns, may be the sources of volatility.
Strategy Choice
The fund strategy chosen is the blend fund, which includes a mix of value and growth stocks, thus allowing investors to combine two types of investments in a single portfolio. The main advantage of the blend fund is its diversification, which makes it a good option for investors desiring to balance the stability of value stocks with high potential of the growth stocks. Often, a blend fund contains other tools of investing, such as money market funds.
As these funds diversify, it becomes harder to predict growth and risk. At the same time, since assets are distributed over diverse funds, an investor is almost immune to huge losses. Costs determine blend funds performance as low expenses partially inoculate a fund from poor performance (Kjetsaa & Kieff 2016). Investors are thus recommended to concentrate on lower-cost funds when assembling a portfolio. From this subset, funds whose net return is higher than the average return in a corresponding category should be preferred.
Asset Managers
Blackrock is the largest global investment management corporation based in New York. As of June 30, 2019, the asset manager had $6.84 trillion in assets under management (BlackRock 2019, para. 5). The company offers investment services, risk management, and strategic advisory. Invesco is the US independent investment management company headquartered in Georgia with regional offices in 25 countries. As of July 31, 2019, the company managed $1,198.7 billion in assets (Invesco 2019, para. 2).
Unlike Blackrock, Invesco offers investment management solely to help its clients achieve their investment objectives. Fidelity Investments (or Fidelity) is an American financial services company headquartered in Boston. As of March 2019, Fidelity had $2.46 trillion in assets under management and $7.4 trillion customer assets (Fidelity 2019, p. 10). The corporation provides financial planning and retirement options, including individual retirement accounts and managed accounts, brokerage, and other financial services.
Funds
SHSAX is the healthcare equity fund, which invests 80% of its assets in equity securities of healthcare companies and related industries. Approximately 39% and 25% of investments are allocated in healthcare products and pharmaceuticals sectors correspondingly (SHSAX quote 2019). The fund mainly invests in North America (85%) and Western Europe (11.7%) (SHSAX quote 2019). As of August 8, 2019, its total assets were equal to $7,142.75.
GGHCX is the Invesco health care fund that invests in equity securities of healthcare-related companies in the US and worldwide. The fund also invests in securities convertible into equity securities and depositary receipts. As of August 8, 2019, its total assets were equal to $1,365.91 (GGHCX quote 2019). Approximately 39% and 25% of investments are allocated in pharmaceuticals and healthcare products sectors correspondingly (GGHCX quote 2019). The fund mainly invests in the companies located in the US, Switzerland, and the UK. FHEAX is the Fidelity Advisor Real Estate open-end fund that obtains above-average income by investing in companies engaged in estate-related industries. As of June 31, 2019, its total assets were equal to $535.19 million (FXEAX quote 2019). The fund invests only in companies located in the US (98.5%).
Fund Performance Analysis
The fund performance analysis was conducted based on the Fama-French three-factor model to calculate the portfolio’s expected rate of return based on historical data. The statistics show a fairly decent fit with the data, given that the values of the multiple R are equal to 0.84, 0.83, and 0.54 correspondingly. This means that 84%, 83%, and 54% of the funds’ returns are explained by the generated models.
For all the three funds, the value of the intercept is very close to zero, which means that the managers, after expenses, determined the regression-based benchmark quite precisely. However, since the p-value is greater than 0.05, the value of the intercept is not statistically significant. The SMB coefficients for SHSAX and FHEAX are 0.37 and 0.3, which means that the funds are primarily mid caps. The SMB coefficient for GGHCX is 0.53, which means that the fond is primarily a large cap.
The negative values of the HML coefficients for all the three funds mean that they behave more like a growth stock portfolio, so the portfolio has higher expected returns when growth stocks outperform value stocks, assuming that portfolios are predominantly growth stocks. That is why all three asset managers are relying on the value premium by investing in stocks with low book-to-market ratios to earn a great return. Since the p-value for the F-statistic for the three funds is lower than 0.05, the regression coefficients are reliable for all the three models.
Fund Total Expense Ratios Analysis
The expense ratio for SHSAX, GGHCX, and FHEAX are 1.14, 1.04, and 1.10 correspondingly. Expense ratios are desired to be not higher than 1.00, which makes GGHCX a more preferred fund from this perspective. Front loads are 5.25, 5.50, and 5.75 correspondingly, which means that FHEAX charges the highest commission and SHSAX charges the lowest one. Fund management fees, which are 0.68, 0.62, and 0.54, may be viewed as the percentage of assets under management. The choice of the fund share class depends on the investor. For investors with a long time horizon, Class A shares are optimal. Class B shares charge higher expense ratios than Class A or Class C shares. Class C shares are good for investors who will be redeeming shares in the short term.
Fund Performance Comparison
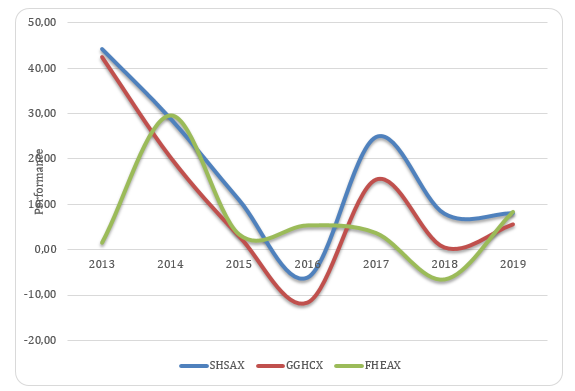
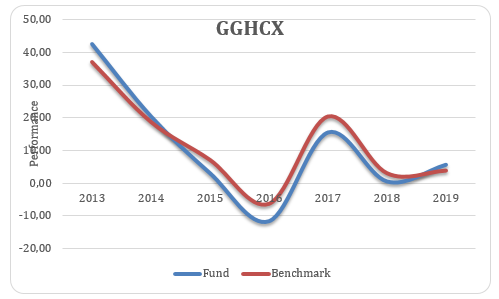
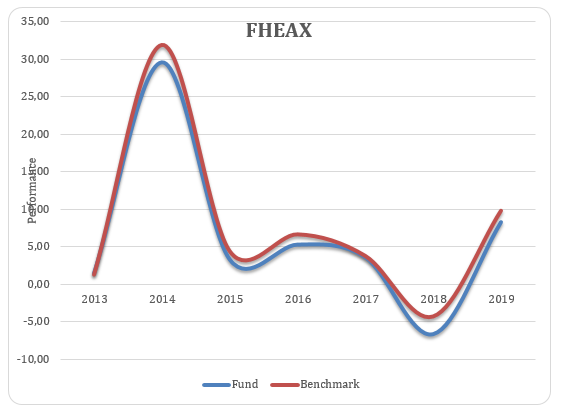
Funds’ performance over the last six years is presented in Table 1 and Figures 3-5. It can be seen that SHSAX consistently outperforms its benchmark over the past six years. FHEAX, however, tends to underperform its own one, and GGHCX does not show a steady historical out- or underperformance.
Table 1. Performance of SHSAX, GGHCX, and FHEAX.
The volatility of the funds’ returns is quite similar over a period 2014-2019. In general, funds’ excess returns differed by 4% from their mean values (as shown in Table 2). The negative skewness for SHSAX and GGHCX indicates that the returns are mainly negatively biased. Small kurtosis for FHEAX indicates a relatively flat distribution of excess returns. The excess return distribution for SHSAX and GGHCX differs more significantly from the normal distribution, which speaks of worse predictability of excess return for these funds.
Table 2. Excess return estimates.
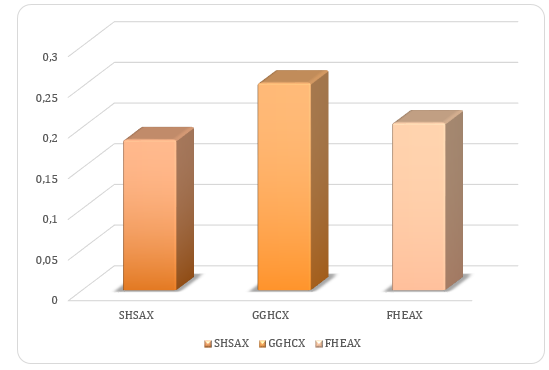
Based on the values of maximum drawdown, the historical risk of investments in SHSAX is lower. In turn, the downside volatility of GGHCX is the greatest (as shown in Table 3). Considering that the drawdown limit is 20%, the most viable investment option is SHSAX.
Table 3. Maximum drawdown.
In summary, the best fund to invest in is SHSAX and the worst to invest in is FHEAX, whereas GGHCX holds the medium position.
Reference List
BlackRock 2019, Introduction to BlackRock.
Deloitte 2019, 2019 global health care outlook.
FHEAX quote 2019. Web.
Fidelity 2019, About Fidelity. Web.
GGHCX quote 2019. Web.
Invesco 2019, Who we are. Web.
Kjetsaa, R & Kieff, M 2016, ‘Impact of expenses, turnover and manager tenure on blend fund performance’, Journal of Business and Accounting, vol. 9, no. 1, pp. 99-114.
Maher, W 2019, Real estate economists forecast slower growth and returns in 2021.
SHSAX quote 2019. Web.
The IQVIA Institute for Human Data Science 2019, The global use of medicine in 2019 and outlook to 2023. Web.