Introduction
The report evaluates supply chain performance using the Zensimu simulator. Zensimu is a training game that engages learners in lean simulations to boost skills, teamwork, and processes in supply chain management (Zensimu, no date). The role in the game is that of a distributor, an intermediary between the manufacturer and the distributor.
Round one of the simulations aimed to minimize backorder, while round two aimed to minimize overall supply chain cost. While playing the game, it was possible to balance various performance metrics to achieve desirable results. A system of metrics, including backorder quantity, stock level, inventory cost, demand, and supplier receipt, provided critical information that guided the distributor’s actions to improve the supply chain’s effectiveness, efficiency, and adaptability.
Performance in the Game Analysis
Comparison and Assessment of Performance in Both Rounds
The main goal in round one was to minimize backorders, while the second round aimed to minimize overall supply chain costs. The focus was to place more orders based on demand and ensure the current stock was sufficient to fulfill customer demand, while keeping backorders to a minimum. As a result, the average backorder for the first round was zero, while the second round was 2.3. The cost was reduced from £785 in round one to £597 in the next, indicating an improvement of 24%.
However, minimizing supply chain costs compromised average order size to 17, down from 13 in the second phase (see Figure 1). The average stock improved significantly in the second round, 20.8 against 34.9 in the first round. It shows performance increased since less stock than necessary was in the distributor store during the 12 weeks than in the first round.

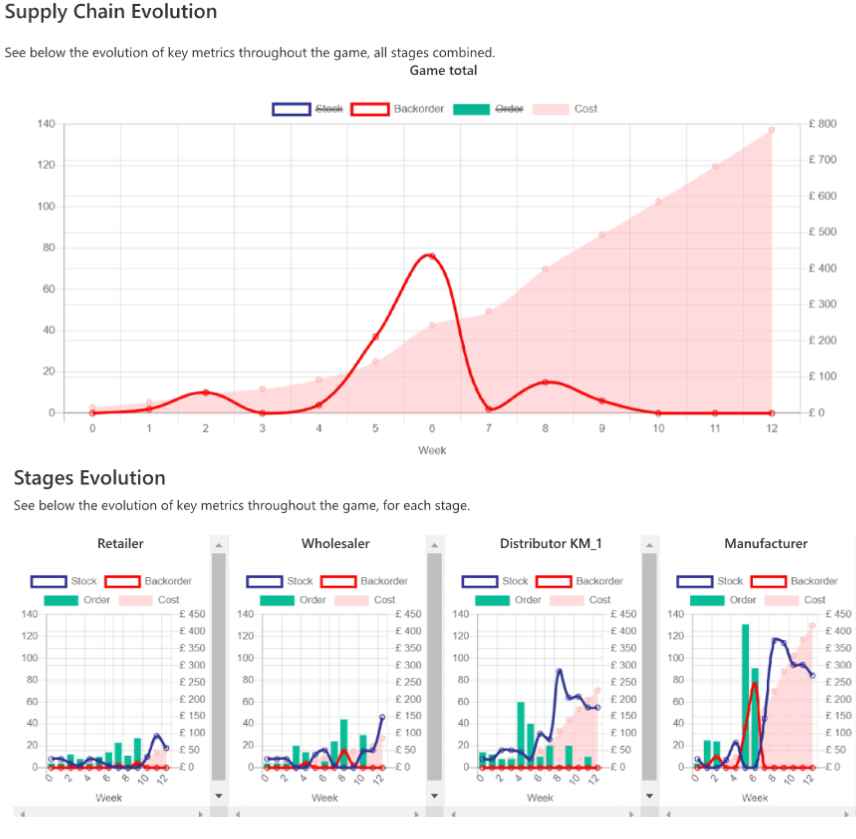
The supply chain evolution in round one shows that backorders were kept to a minimum despite the spike during the week. Therefore, the effort to minimize backorder succeeded, as illustrated in the graph below (Figure 2). However, maintaining a low backorder came at the expense of higher stock levels, as shown in the stages evolution section of Figure 2.
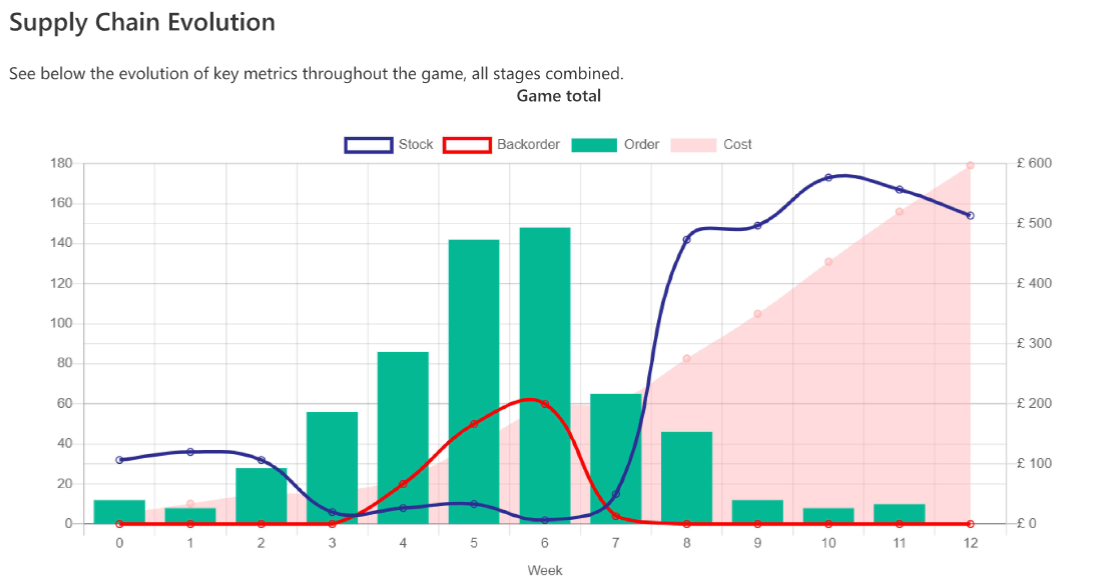
The backorder in round two followed a similar pattern to the first, peaking during week six when demand was highest (Figure 3). Unlike in the first phase, the stock remained relatively low, in sharp contrast to the rising demand around week six. It shows that the reactionary measures to peak demand were untimely, resulting in overstocking from week 6 to week 12, as shown in Figure 3.
The high stock was a response to the backlog of orders that caused a spike in backorders during week six. Overall, the performance in round two was better than in the previous one, as the distributor maintained a lean supply chain, as indicated by reduced total costs and backorders over the 12 weeks. The backorder also improved from 8 weeks to 4 weeks, indicating a better end-to-end supply chain and fewer delays in the system.
Improvements Made from the First to the Second Round
The performance improvements in the second phase involved integrating quantitative skills, psychological understanding, and operational knowledge of the supply chain. There was a need to measure supply chain performance and ensure it worked effectively. The performance measures, such as inventory cost, stock levels, demand, and backorder amounts, highlighted what was working to help address the shortcomings from round one.
For instance, minimizing backorders meant the distributor had to keep surplus tea in stock to fulfill demand. However, keeping a higher-than-needed stock resulted in significant storage and other logistical costs that would otherwise be eliminated by maintaining a leaner stock. Therefore, to reduce the cost from £785 to £597, necessary adjustments were made to minimize stock levels.
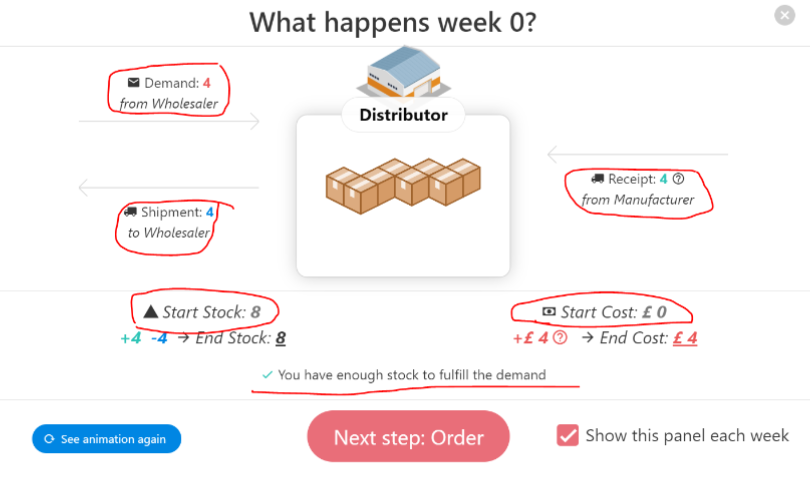
For instance, the wholesaler demand during week 0 for tea was 4, which matched the manufacturer’s receipt (Figure 4). Since the four tea packages are already being delivered or shipped to the end, and the end stock is 8, this stock level should be sufficient to meet the demand for four tea packages. Therefore, no request was made to the manufacturer for tea to minimize storage costs and other logistics. The assumption is that keeping a low stock level makes it easier to move tea from the distributor to the wholesale market.
Additionally, it reduces overhead costs associated with moving massive cargo within the store, record keeping, and potential damage or losses incurred during storage. By retaining only the stock level needed to fulfill current demand, it was possible to minimize supply chain costs, including unnecessary pressure on the supplier to overproduce or operate beyond its limits. These strategic enablers can reduce the average stock from 97 to 7% and result in a 7% performance improvement.
The four areas of the supply chain for cost minimization strategies are as follows: planning, operations, product and service delivery, and supply chain performance. The strategy involved identifying supply chain flaws by reviewing stock turnover and aligning planning with actual production indicators (Breivik et al., 2021). Stock turnover is the ratio of the total sales vs the actual stock or inventory at a point in time (Kwak, 2019). Knowing the stock turnover helped the distributor limit inventory, ensuring stock was available to customers.
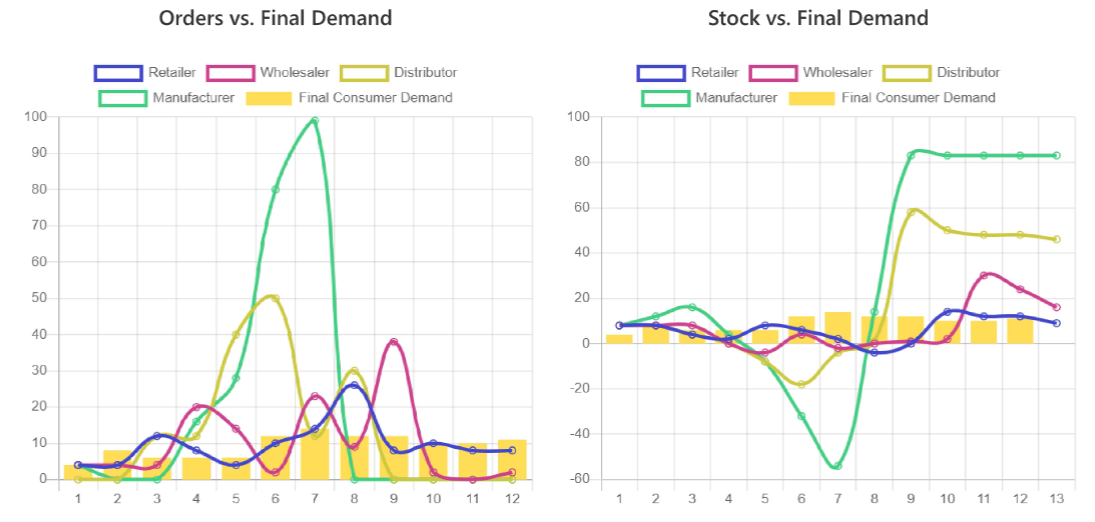
From experience during the first round, it was evident that sales peaked around the sixth week. Therefore, increasing the stock level was necessary as peak demand during week six was anticipated (Figure 5). Additionally, necessary measures were taken to balance backorders resulting from unpredictable demand fluctuations between peak and low periods. As a result, it was possible to reduce average orders from 17 to 13, average stock from 34.9 to 20.8, and cost by £227.
The second area is operations, which ensures customers receive their orders on time. The key operations indicator is lead time, the time from when a customer pays until they receive the order. The total lead time for both rounds was 8 weeks, a significant achievement, as the distributor minimized costs, backorders, and average stock levels while simultaneously improving the overall supply chain.
The third area is the delivery of products and services, with performance indicators including order fulfillment and on-time delivery. Order fulfillment is the number of orders delivered with the correct quantity and quality, and on time, on the first try (Heydari, Lai, and Xiaohu, 2020). Figure 5, the “Orders vs. Final Demand” graph, shows that most orders were fulfilled with the correct quantity and on time, except in weeks 6 and 7.
The strategy entails placing more orders when demand rises and fewer when it declines to clear out the backorders. The available stock and current backorder determined whether the distributor placed more or no orders to fulfill each order, while ensuring a constant supply of fresh tea products from the manufacturer to sustain quality. Overall, key performance indicators for each of the four areas in supply chain management determined the effectiveness of the supply chain management and which aspects needed improvement.
Bullwhip Analysis
The amplitude of variation increased from retailers to manufacturers, a phenomenon known as the bullwhip effect (Figure 5). The bullwhip effect is a frustrating phenomenon that often begins with falling customer demand (Rahman, Rahman, and Talapatra, 2020). However, it can start in reverse with previously unanticipated, rapidly rising customer demand (Slack and Brandon-Jones, 2019). Falling customer demand prompts distributors to under-order to reduce inventory, as illustrated in the order vs. final demand graph (Figure 5).
Therefore, the bullwhip effect is an occurrence observed in the supply chain in which orders sent to the manufacturer and distributor create a larger variance in sales to the end customer (Slack and Brandon-Jones, 2019; Rahman, Rahman, and Talapatra, 2020). For instance, the sudden rise in demand during week six prompted the distributor to order more to boost stock levels in anticipation of further demand (Figure 5). However, demand in the subsequent weeks declined significantly, resulting in overstocking, even though the distributor tried to even out by placing no further orders.
Irregular orders in the lower part of the supply chain can disrupt the smoothness of the supply chain process, as each link will underestimate product demand. It will result in exaggerated fluctuations, erroneous decisions, and unnecessary costs in the supply chain (Peña, Bas, and Maldonado, 2021). In this game, the decision to order more inventory was driven by a dealership’s 30% backorder with the manufacturer. As a result, orders placed with the manufacturer the following week increased significantly to clear the backorders caused by this sharp demand. Ultimately, the distributor faced the same problem it was trying to avoid: overstocking, as demand dropped sharply (Figure 5).
The distributor estimated future customer behavior based on current behavior, often ordering extra as a safety net. Price variation, like in the 30% discount case encountered in the game, disrupts consumer buying patterns and synchronizes everyone to stock up simultaneously. As a result, the bullwhip effect comes from rational decision-making, consumer behavior, and the players in the supply chain (Yang et al., 2021). When orders reach the manufacturer, and a response is initiated (with a 2-week lead time), the over- or under-ordering changes exponentially. Generally, this sudden shift can result in inefficiencies, increased costs, and backorders, as witnessed in rounds 1 and 2.
The supply chain is characterized as a physical journey a product takes from start to finish, from raw material sourcing to arrival at the consumer. Therefore, a typical supply chain consists of many players, and it is expected to slightly overestimate actual demand by placing larger orders to account for uncertainties (Rahman, Rahman, and Talapatra, 2020). Therefore, it is a normal reaction to amplify demand variation to lower costs deliberately.
For example, the distributor increased the tea supply during weeks 6 and 7, confident that subsequent weeks would reflect a similar pattern. The strategy was to ensure sufficient stock was available to fulfill backorders and new orders while minimizing supply costs and lead times. A full container load, for instance, is cheaper than a half container, and, together with supplier price breaks, economies of scale can significantly lower the cost. Therefore, a distributor may place larger orders than frequent small ones that closely resemble consumer demands.
Supply Chain Management Strategy of the Bullwhip Effect
Using better forecasting and visibility tools is an example of a supply chain management strategy that will help the distributor minimize the bullwhip effect. Inventory management software has become a common practice in the supply chain to accurately predict stock levels (Kalaiarasan et al., 2022). Using supply chain optimization tools can help the distributor evaluate sales, promotions, schemes, and other variables more precisely and quickly.
Applications are crucial for improving the planning process through advanced planning optimization and analytics. Some of these tools leverage Artificial Intelligence (AI) to analyze large datasets and provide more accurate insights into market trends, consumer behavior, demand and supply, and other metrics necessary for managing inventory (Kalaiarasan et al., 2022). Using the forecasting and visibility software to gauge real-time demand and trends effectively reduces overall lead time.
The strategy was selected because software programs can analyze massive datasets and give more accurate predictions than humans. Additionally, they are reliable for forecasting complex variables such as demand and supply, consumer behavior, and other supply chain variations more quickly and effectively (Slack and Brandon-Jones, 2019). Research shows that the quality and quantity of information sharing deeply affect the performance; therefore, information needs to be accurate and shared on time (Aqdas et al., 2023).
Overall, the bullwhip effect can be costly to all organizations in the supply chain. Excess inventory can result in waste, while insufficient inventory can lead to increased lead time, poor customer experience, and lost business (Rahman, Rahman, and Talapatra, 2020). Therefore, the proposed forecasting and visibility tools will minimize the effects by streamlining communication between supply chain partners. It aims to streamline processes by providing accurate, on-time information, allowing distributors, wholesalers, and manufacturers to make informed decisions and avoid the ripple effect of unpredictable demand in the supply chain.
Reference List
Aqdas, A. et al. (2023) ‘The impact of bullwhip effect on the supply chain performance with the mediating effect of information sharing among an enterprise and suppliers‘, Review of Applied Management and Social Sciences, 6(2), pp. 189–200.
Breivik, J. et al. (2021) ‘Measuring inventory turnover efficiency using stochastic frontier analysis: building materials and hardware retail chains in Norway’, International Journal of Systems Science: Operations & Logistics, 10(1), pp. 1–20.
Heydari, M., Lai, K.K. and Xiaohu, Z. (2020) ‘Creating sustainable order fulfillment processes through managing the risk: evidence from the disposable products industry’,Sustainability, 12(7), pp.1–32.
Kalaiarasan, R., et al. (2022) ‘Supply chain visibility for improving inbound logistics: a design science approach’,International Journal of Production Research, 61(15), pp.1–16.
Kwak, J.K. (2019) ‘Analysis of inventory turnover as a performance measure in manufacturing Industry‘, Processes, 7(10), pp.1–11.
Peña, J.A., Bas, Á. and Maldonado, N. (2021) ‘Impact of bullwhip effect in quality and waste in perishable supply chain‘, Processes, 9(7), pp.1–18.
Rahman, H., Rahman, A. and Talapatra, S. (2020) ‘The bullwhip effect: causes, intensity, and mitigation’, Production & Manufacturing Research, 8(1), pp.406–426.
Slack, N. and Brandon-Jones, A. (2019) Operations management. Leicester: Pearson Education Limited.
Yang, Y., et al. (2021) ‘The behavioural causes of bullwhip effect in supply chains: a systematic literature review’, International Journal of Production Economics, 1-65(1).
Zensimu (no date) Zensimu – supply chain and lean training games.