Spontaneous Reporting Systems
Polypharmacy refers to using multiple drugs by an individual for therapeutic reasons. Recently, the situation has been identified as a vital social problem because it induces adverse events (AEs) and increases the chances of AEs through drug-drug interactions (DDIs). Pharmacokinetic and pharmacodynamic interactions are two primary types of DDIs. Although pre-marketing in clinical trials focuses on single drugs and excludes patients under multiple drugs, post-marketing uses a spontaneous reporting system for drug safety surveillance where potential AEs induced by the drugs are detected.
Statistical Models
Shrinkage Measure Model (Ω)
The shrinkage model has been used to calculate the observed-to-expected ratio as a spontaneous reporting system to detect the DDIs signals. The shrinkage measure (Ω) is a parameter that allows you to statistically reduce the variation within a sample. Ω is usually sensitive given the spurious reactions hence, false detection during the analysis. However, shrinkage has been used as a practical approach to regulating sensitivity due to the random changes in disproportionality measures based on small data sets. The shrinkage measures, consisting of the information component (IC) and the empirical Bayes geometric mean (EBGM), are primarily used when measuring disproportionality. Both models are based on the observed-to-expected ratios of the rates of ADR and additional drug reporting. During the construction of the shrinkage measure, the observed and the expected reporting rates are expressed as f11 and g11. The actual reflection of specific indices in the variables shows specific combinations between drug intakes, as shown in the equations below:
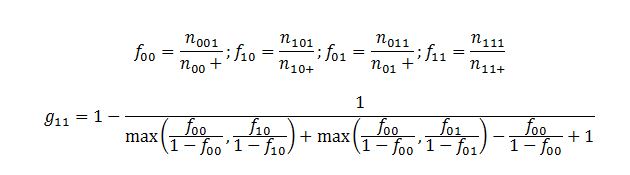
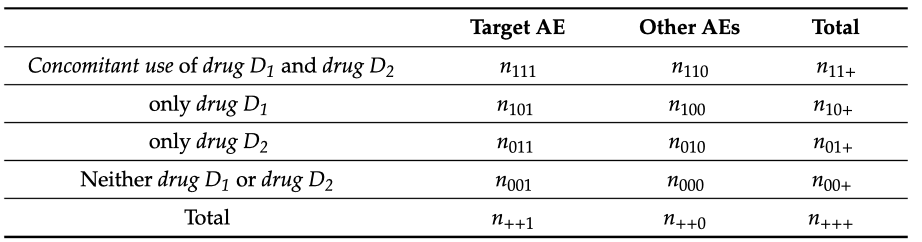
The symbolic distribution of the indices depending on the specific combinations between the drugs is shown in Fig. 1. Hence, the shrinkage measure is defined as
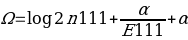 ,
,where α is used as the turning element to determine the shrinkage strength, a higher α means a stronger shrinkage, while a lower alpha means a weaker shrinkage. The parameters n111 and E111 are also used in this equation. These variables denote the reported (n) and expected (E) number of reported AEs from patients taking two drugs at once.
There are no specific ways of choosing alpha values in the shrinkage measure model; therefore, α=0.5 has been effectively used to give good shrinkage. Shrinkage measures can be viewed from two perspectives; frequentist and Bayesian perspectives. According to the frequentist perspective, the shrinkage is biased towards zero in respect to Ω0 but with better variance characteristics. On the other hand, the Bayesian perspective views Ω as a log of the posterior average of unknown incidences. When f10 is less than f00, it is presumed that D1 has no potential risk of AE, while a potential risk is reported when f10 is greater than f00. Where α is the turning component that determines the shrinkage strength, the shrinkage regression can be used as the turning component depending on the cross-validation estimates for the classifier analysis.
Additive and Multiplicative Models
When determining the DDIs signals obtained from the spontaneous reporting system, both the multiplicative and the additive models are used. The multiplicative model assumes risks when the drug multiplies with other risks. On the other hand, the additive model assumes the risks arising when the drug adds to additional risks. When formulating the methodology in the multiplicative and additive models, risk factors such as the incidence rates and the chances of developing the event are denoted by risk (A, B). risk (A, not B) is used to refer to the risk of drug A only, risk (not A, B) refers to the risks of drug B only, while risk (not A, not B) refers to the absence of chances in both the drugs.
Additive Model
Based on the additive model assumption, no drug interaction is identified when there is an excess risk in drug A in the absence of drug B. This can be represented as follows;
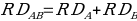 ,
,where RD stands for the generalized Risk that arises from taking the Drug. The measure of the drug interaction is given by the variance, which is obtained by the level in which the risk deviation is associated with the A and B combination. The difference shown by the movement of the variance away from zero determines the level of interactions. If the variance is more significant than zero, it indicates a positive interaction and vice versa. In the additive model, the assumption is that an interaction is not reported when there is a potential excess risk associated with A in the presence of B. Potential interaction with an increased combination risk compared to the expected value of a single drug is identified when RD11 > RD10+ RD01 — in other words, the risk of sharing drugs exceeds the risks of individual drugs by synergistic effect.
Multiplicative Model
The relative risk associated with drug A when the interaction level is not in the multiplicative level is similar in both the absence and presence of the exposure to drug B. This can be represented as follows;
MI = RR11/(RR10×RR01) = (P11/P00)/{(P10/P00) ×(P01/P00)} = (P11×P00)/(P10×P01),
where MI is the value of the multiplicative model of interactions, and RR and P mean the ratio of risks in different combinations of medications (see Figure 1) and the ratio of risks. The evidence of positive interaction is identified when RR11/(RR10×RR01) is more significant than one, indicating the need for safety concerns. The additive model has a greater sensitivity than the multiplicative model in detecting potential signals. When the assumption is based on the idea that there is no interaction, the risk associated with the concomitant combination of drugs is similar to the absence of all the drugs. The statistical testing is achieved through the log-linear regressions; Log (risk of the event), which can be expressed as
=α+β (drug A) +γ (drug B) + δ (drug A and B) + othercovariates
The evidence of positive interaction is identified when the variance is more significant than one, indicating the need for safety concerns
Combination Risk Ratio Model (CR)
Potential risks for drug interaction in this model are obtained through many procedures: PRR as a statistical signal indicator is used to detect an increase in AE due to DDI risk in D1 and D2. The PRR of one drug of the two suspicious medicines can also be obtained individually. In a situation where the PRR ratio of two drugs used by the concomitant exceeds two, it is estimated to be DDI risk.
Logistic regression Model
The model uses a logistic function to create a dependent variable. Reporting odds ratio is one of the statistical models that use the logistic regression model; the adjusted ROR identifies the gender, age, and patient drugs. In the study to determine how the model can be used to detect DDIs signals from the spontaneous reporting system, the study found that if the concomitant used the oral contraceptives and the antifungal itraconazole, withdrawal bleeding was observed.
Multi-Item Gamma-Poisson Shrinker Mode
The model can obtain the score from the “Drug-Drug- Event” and the “Drug-Event-Event.” MGPS model does not provide signal detection limit but uses excess two as an indicator element where any value from the interaction resulting from the concomitant drugs is considered high, and the signals are suspected. In size three itemset in the MGPS model, the detection of DDIs depends on the drugs’ EBGM value being more significant than the 90% confidence interval.
Regression-Adjusted Gamma-Poisson Shrinkage Model
Gamma-Poisson Shrinkage Model (GPS) involves the use of t-tests in the detection of DDIs signals. The RGPS combines the GPS and the linear regression model to form a hybrid detection model. The alpha parameter is used to identify the shrinkage strength in the model. The higher the alpha, the stronger the nature of the shrinkage. The frequency and the Bayesian perspectives can also influence the measure of shrinkage.
Extended Information Component Model
The Information component measures the relationship of pairs of the concomitant drugs and the adverse effects, where there is a high order interaction in size three itemset as DDIs. The model can be represented as:
 ,
,where IC is the information component of Bayesian statistics or, in other words, a measure of the quantitative relationship between a drug and adverse reactions to it. The indices in the equation are coordinates for the three-dimensional calculation of the information component. The IC distribution is primarily unimodal; hence the estimates of the posterior (m.à.p.) mean of the information component can often be used.
Chi-Square Statistics Model
The model compares the differences between the actual and the observed data on the AEs with the drug interactions. When analyzing rare events, the chi-square test with correction is suitable instead of the standard chi-square. The cut-off in determining the DDIs signals depends on the chi-square distribution between 95% and 99% with one degree of freedom. The chi-square statistic model has a higher sensitivity than the Bayesian and frequentist models of the shrinkage model.
Association Rule Mining Model
The association rule model uses a priori algorithm to reduce the number of calculations. There are several indicators of the association rule model. The support is indicated as the percentage of all the items of Y and X. On the other hand, confidence is also used as conditional probability. It measures the interferences made by X and Y. Additionally, the model’s lift is used to represent the probability ratios.
Causal Association Rule Discovery Model (CARD)
CARD models have been used to detect the true causal correlation between adverse effects and the concomitant use of more than one drug. For the model, given a set of variables X and Y, then the structure is X → Y, where X rule is (D1 and D2) → Y (AE). The model has been found to be more accurate when determining known the DDIs with 20% level of accuracy compared to the Harpaz’s model, which has 10% accuracy level.
Shirakuni’s Method of Association Rule Mining Model
The model examines a discrete use of combined drugs utilizing the association rule. In the method, X is given by the drugs D1 D2, and the value Y is given as the target adverse effects. Both the hypothesis and the results in the rule are vital to AE. The support and the confidence of the combined drugs D1 and D2 are dependent on the symptoms of AEs in patients included in the data set.
Harpaz’s and Noguchi’s Method of Association Rule Mining Model
The D1 and D2 show the value X, while Y, on the other hand, is shown by the AE. However, contrary to Shirakuni’s Method, Harpaz’s Method uses the RRR instead of the confidence as a parameter to determine the association rule strength. RRR is the ratio of the frequency of the observed dataset and the prediction. Drugs are divided into three categories, while the AEs are divided into four. On the other hand, Noguchi’s model primarily focuses on how much one drug influences another drug. The method has a higher sensitivity of about 99.05% and a specificity of 92.60%; hence, the model’s detection power is higher than other models in the association rule.
Reference
Noguchi, Y., Tachi, T., & Teramachi, H. (2020). Subset analysis for screening drug–drug interaction signal using pharmacovigilance database. Pharmaceutics, 12(8), 1-9.