Apple Company Returns and Earnings

In the paper, the returns and quarterly earnings of Apple Inc. will be analyzed. The company is a component of the S&P 500 index. The analysis will be carried out for a period of 5 years.

Returns

The share prices for a day before and a day after the announcement of quarterly results are collected. Further, the percentage change of these values is calculated to estimate the impact of the announcement.

Day before announcement Day after the announcement Percentage change
Q4 2014 96.46 101.2 4.9140%
Q3 2014 92.31 95.51 3.4666%
Q2 2014 74.23262 79.26849 6.7839%
Q1 2014 75.78525 70.29359 -7.2463%
Q4 2013 72.57062 71.29019 -1.7644%
Q3 2013 58.43534 60.38177 3.3309%
Q2 2013 54.28733 55.21193 1.7032%
Q1 2013 68.33681 60.98963 -10.7514%
Q4 2012 83.12805 81.399 -2.0800%
Q3 2012 81.0282 77.15546 -4.7795%
Q2 2012 76.71667 81.85616 6.6993%
Q1 2012 57.35432 59.93749 4.5039%
Q4 2011 56.35863 53.49098 -5.0882%
Q3 2011 50.16038 51.91827 3.5045%
Q2 2011 45.33757 47.06058 3.8004%
Q1 2011 46.76268 45.46907 -2.7663%
Q4 2010 42.23509 41.53059 -1.6680%
Q3 2010 32.95448 34.11657 3.5263%
Q2 2010 33.15442 34.78484 4.9177%
Q1 2010 36.48235 36.25422 -0.6253%

There is a tendency to share prices to improve after the announcement of quarterly results if the results met expectations. However, the share prices are affected by several factors and not only the announcement of results.

Earnings

Quarter Earnings for the quarter ($billion)
1 Q1 2010 6
2 Q2 2010 3.07
3 Q3 2010 3.25
4 Q4 2010 4.31
5 Q1 2011 6
6 Q2 2011 5.99
7 Q3 2011 7.31
8 Q4 2011 6.62
9 Q1 2012 13.6
10 Q2 2012 11.6
11 Q3 2012 8.8
12 Q4 2012 8.2
13 Q1 2013 13.1
14 Q2 2013 9.5
15 Q3 2013 6.9
16 Q4 2013 7.5
17 Q1 2014 13.1
18 Q2 2014 10.2
19 Q3 2014 7.7
20 Q4 2014 8.5

The company reported higher earnings in the first quarter, and the earnings dropped as the year progresses.

Descriptive statistics

Earnings for the quarter ($billion)
Mean 8.0625
Standard Error 0.689652802
Median 7.6
Mode 6
Standard Deviation 3.084221091
Sample Variance 9.512419737
Kurtosis -0.483584515
Skewness 0.324007966
Range 10.53
Minimum 3.07
Maximum 13.6
Sum 161.25
Confidence Level (95.0%) 1.443459903

The average of the earnings was 8.0625, while the standard deviation was 3.0842. The highest value of earnings during the entire period was $13.6b, while the least value was $3.07b.

Regression

The regression model will build a linear relationship between the time period and earnings. The regression line will take the form;

  • Y = a + bX

Y represents the earnings, while X represents the time period. The results of the regression are presented below.

Regression Statistics
R Square 0.3297
Adjusted R Square 0.29249
ANOVA
df SS MS F Significance F
Regression 1 59.5952 59.59 8.855 0.00810
Residual 18 121.140 6.73
Total 19 180.735975
Coefficients Standard Error t Stat P-value
Intercept 4.9192 1.205102 4.0819 0.0007
Period 0.2993 0.10059 2.9757 0.008101

The regression will take the form Y = 4.9192 + 0.2993X. The value of R-square (0.3297) shows that the regression line is weak. The estimated earnings for next quarter is $11.21 billion (Y = 4.9192 + 0.2993 * 21).

Test of significance

A two-tailed t-test will be used to test the significance of the explanatory variable.

  • Null hypothesis: Ho: Xi = 0
  • Alternative hypothesis: Ho: Xi ≠ 0

The null hypothesis implies that the variable is not a significant determinant of movements in stock prices. The t-statistic for the time period is 2.975755, while the p-value is 0.008101. Since the p-value is less than α = 0.05, the null hypothesis is rejected. This implies that the time period is a significant determinant of earnings (Evans, 2014).

F – test

The overall significance of the regression model can be analyzed using an F – test at the 5% significance level.

Null hypothesis H0: β0 = β1

Alternative hypothesis H1: βj ≠ 0, for at least one value of j

The null hypothesis implies that the overall regression line is not significant. From the regression results, the value of f-calculated is 8.8551, while the p-value is 0.008101. The p-value is less than α = 0.05. This shows that the overall regression line is significant (Evans, 2014).

Control limits

Mean earnings

= total earnings / total number of days

= 161.25 / 20

= 8.0625

The upper and lower control limit will be calculated using the formula presented below.

Control limits

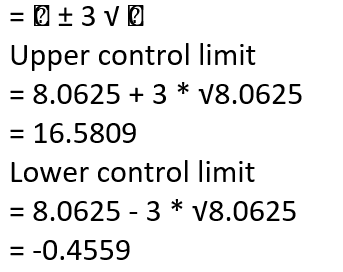
The graph presented below shows the control chart.

Control chart

The graph shows that the process is in control because the quarterly earnings are within the upper and control limit.

3 period moving average

Moving average
1
2
3 4.11
4 3.54
5 4.52
6 5.43
7 6.43
8 6.64
9 9.18
10 10.61
11 11.33
12 9.53
13 10.03
14 10.27
15 9.83
16 7.97
17 9.17
18 10.27
19 10.33
20

Thus, the estimated earnings for the next quarter is $10.33 billion.

Reference

Evans, J. (2014). Business analytics: methods, methods, and decisions. USA: Pearson Education Limited. Web.

Cite this paper

Select style

Reference

StudyCorgi. (2020, September 20). Apple Company Returns and Earnings. https://studycorgi.com/apple-company-returns-and-earnings/

Work Cited

"Apple Company Returns and Earnings." StudyCorgi, 20 Sept. 2020, studycorgi.com/apple-company-returns-and-earnings/.

* Hyperlink the URL after pasting it to your document

References

StudyCorgi. (2020) 'Apple Company Returns and Earnings'. 20 September.

1. StudyCorgi. "Apple Company Returns and Earnings." September 20, 2020. https://studycorgi.com/apple-company-returns-and-earnings/.


Bibliography


StudyCorgi. "Apple Company Returns and Earnings." September 20, 2020. https://studycorgi.com/apple-company-returns-and-earnings/.

References

StudyCorgi. 2020. "Apple Company Returns and Earnings." September 20, 2020. https://studycorgi.com/apple-company-returns-and-earnings/.

This paper, “Apple Company Returns and Earnings”, was written and voluntary submitted to our free essay database by a straight-A student. Please ensure you properly reference the paper if you're using it to write your assignment.

Before publication, the StudyCorgi editorial team proofread and checked the paper to make sure it meets the highest standards in terms of grammar, punctuation, style, fact accuracy, copyright issues, and inclusive language. Last updated: .

If you are the author of this paper and no longer wish to have it published on StudyCorgi, request the removal. Please use the “Donate your paper” form to submit an essay.