Overview of the Company: China and United States
Apple Inc. (also known as AAPL.O, or simply Apple) is an international company from America, which specializes in technology. The enterprise’s hardware production focuses on the iPhone smartphones, Mac computers, the Apple Watch smart-watches, iPad tablets, the iPod media players, as well as the AirPods headphones (Apple Inc., 2020). As for Apple’s software, it comprises a variety of operating systems (macOS, watchOS, iPadOS, iOS), a web browser (Safari), a music identifier (Shazam), as well as numerous computer applications, including Final Cut Pro, XCode, etc (Apple Inc., 2020). In addition, Apple offers customers high-quality online services, which are Apple Music, iTunes Store, iMessage, iCloud, AppleTV+, and many others (Aplle Inc., 2020). Steve Jobs, Steve Wozniak, and Ronald Wayne founded the company in 1976 as Apple Computers, Inc (Reuters, 2020). As of 2020, Apple is one of the most profitable enterprises in the world with a 2019 revenue of more than 260 billion dollars (Reuters, 2020). According to Reuters (2020), the key people in the company are Tim Cook (Chief Executive Officer) and Jeff Williams (Chief Operating Officer). Despite all the successes, Apple continues to grow and expand its global reach.
Apple is a part of the Big Tech conglomerate, which includes Amazon, Google, Microsoft, Facebook, and AAPL.O. It produces products and offers services related to consumer electronics and applicable computer software. This lucrative specialization has led to the company dominating the Americas segment (both North America and South America) and Europe. Moreover, Apple continues to be one of the leaders in the tech markets of China, Japan, Hong Kong, and Taiwan. This report focuses on the Smartphone segment of Apple in two markets: China and the United States. The purpose of the report, compiled by a senior economic advisor to Apple, is to explain how the macroeconomic environment in both countries affects the company’s economic activities.
Analysis of the Market Structure
United States
The smartphone market in the United States is one of the largest in the world due to the multimillion population of the country and its relatively high disposable income levels. The only two markets that the US loses to are China and India. America enjoys strong mobile device penetration levels, with 91% of the country’s households owning at least one smartphone (Mordor Intelligence, 2020). Mordor Intelligence reports that “the smartphone market was valued at USD 714.96 billion in 2019 and is expected to reach USD 1351.8 billion by 2025, at a CAGR of 11.2% over the forecast period 2020 – 2025” (p.1). The US smartphone market generates yearly revenue of more than $75 billion (Holst, 2020). Apple and Samsung continue to dominate this geographical segment, making up nearly ¾ of the country’s entire smartphone market. In regards to competition, Apple has a market share of almost 48%, while Samsung dominates 25% of the market (Holst, 2020). Although the competitive landscape in the US is highly saturated, Apple and Samsung continue to stay on top of the economic food chain. It is extremely hard for a new brand to enter the American market due to various government regulations and distribution implications.
An unfortunate example of global expansion to the US in the international tech giant Huawei. Despite being the largest smartphone supplier in the world, Huawei became a victim of the Trump administration’s executive ban on the company’s operations in the country (Gatnenberg, 2020). Based on the President’s order, the activities of numerous enterprises (including Huawei) are restricted due to national security concerns. Huawei was accused multiple times of industrial espionage, which has tarnished its reputation. Moreover, the government’s investigation demonstrated that Huawei violated US sanctions by misleading banks about its operations in Iran (Smith, 2019). Right now, American companies need to receive government permission to engage in business with Huawei (Gartneberg, 2020). The Chinese tech giant lost access to Android updates and Google services as a result of the aforementioned regulations (Smith, 2019). This means that Apple (at least for now) has one less competitor to worry about. The main competition facing the company in the United States is Samsung.
China
China is the world’s second largest economy, rapidly growing to replace the United States as the global economic leader. Due to the relative ‘youth’ of the Chinese market, the government is more lenient towards new businesses entering the country. Therefore, there are a lot of brands competing for the attention of Chinese consumers, including Huawei, Xiaomi, Apple, Oppo, Vivo, and others. The main difference between American and Chinese competition is that Huawei thrives in China, capturing a 60% share of the 5G smartphone market (Business Wire, 2020). Huawei “accounts for 46 percent of all smartphone sales in China,” which “amounts to more than the market share of its rivals including Oppo, Vivo, and Xiaomi combined” (Gizmochina, 2020). Due to the global pandemic, the smartphone market in China has declined by 17%, with Vivo, Oppo, and Xiaomi each losing around 30% of the market share (Gizmochina, 2020). The second half of 2020, however, presents some positive changes and gradual market stabilization.
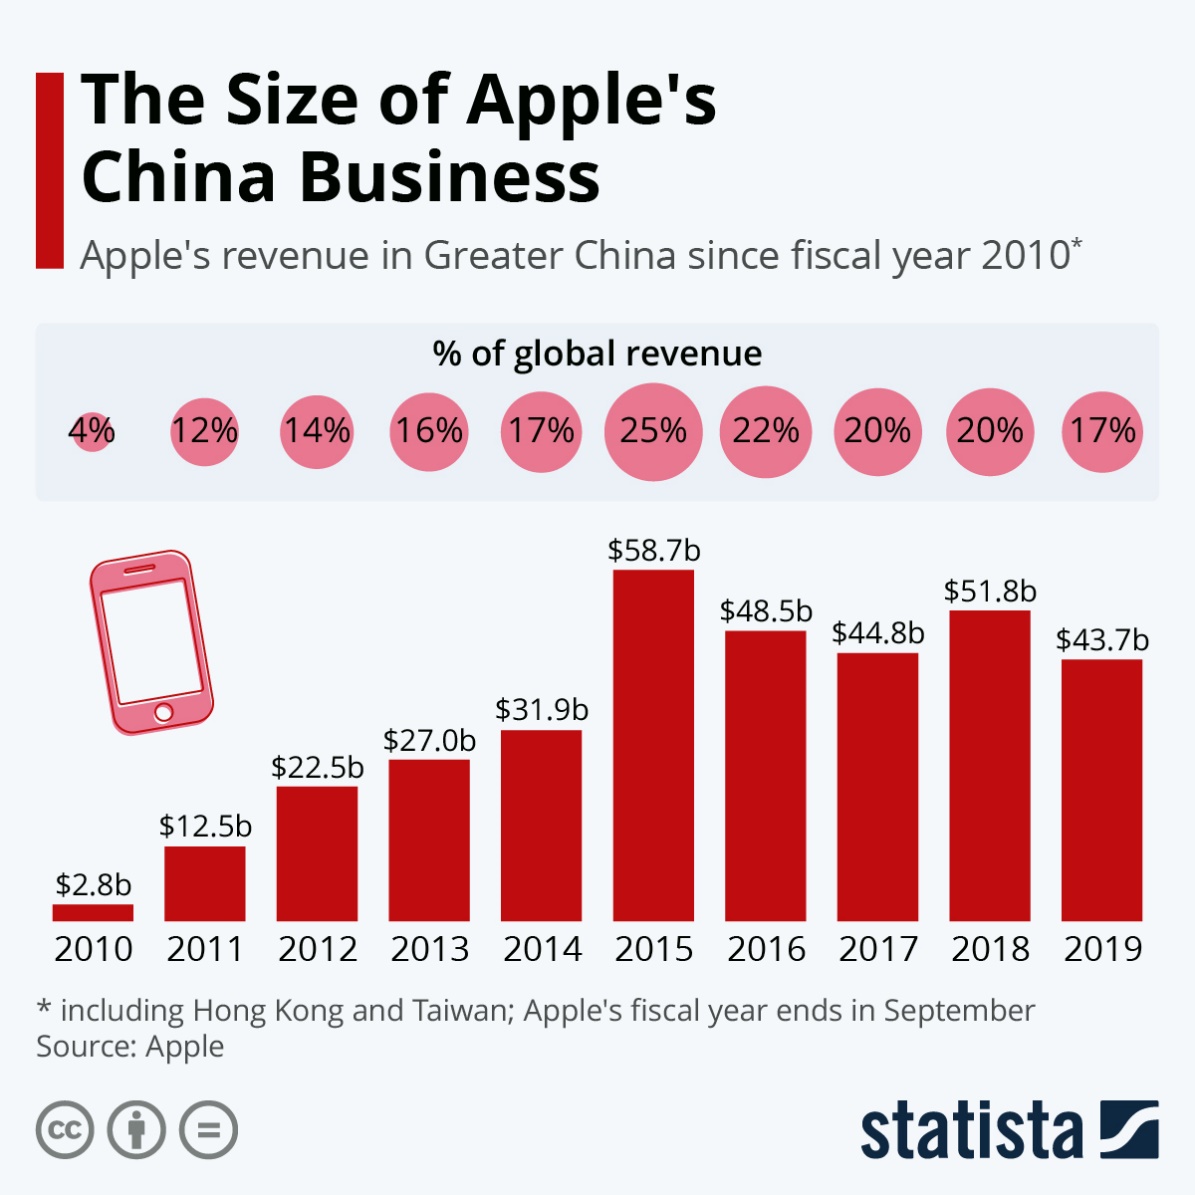
As for Apple’s presence in China, it has experienced some challenges associated with the lockdown measures. Apple has entered the Chinese market in 2010, growing its sales more than twentyfold in only 5 years (Ritcher, 2020). The company’s revenue in China has peaked at $58.7 billion in 2015, which amounted to 25% of Apple’s 2015 revenue (Ritcher, 2020). However, the percentage has decreased to 17% in just four years (Ritcher, 2020). This was the outcome of the economic and political tensions between US and China.
Comparative Analysis of Macroeconomic Indicators
GDP Growth Rate
The global economic crisis of 2007-2009 has affected the majority of the world’s economies, with Chinese and American ones being no exception. Both the Chinese and American economies managed to recover and continue to move in an upwards trajectory, which is demonstrated in the graph. Kalleberg and Von Wachter (2017) argue that the US economy does not enjoy the fast pace of growth evident in the 1980s and 1990s due to increased income and wealth inequality. In nominal terms, the size of the American economy exceeded $20 trillion in 2018 (Silver, 2020). Experts often refer to the US as an economic superpower due to the fact that American economy constitutes a quarter of the total global economy. American economic advantages come from an efficient infrastructure, innovative technology, as well as abundant natural resources.
As for the purchasing power parity, the United States are not the global leaders, losing its spot to China. In terms of GDP (PPP), Chinese economy was at $27.51 trillion, while the US economy was measured at $21.44 trillion (Silver, 2020). The size difference between the American and Chinese economies has decreased significantly over the years. In 1980, China happened to have the seventh largest economy (Silver, 2020). In 2018, the Chinese nominal Gross Domestic Product stood at $13.37 trillion, which demonstrated a gap with the United States by $7.2 trillion (Silver, 2020). Experts believe that by 2023, the difference would be only $5.5 trillion (Silver, 2020). The existing gap between China’s and America’s nominal GDP is expected to shrink.
GDP per Capita at Constant Prices
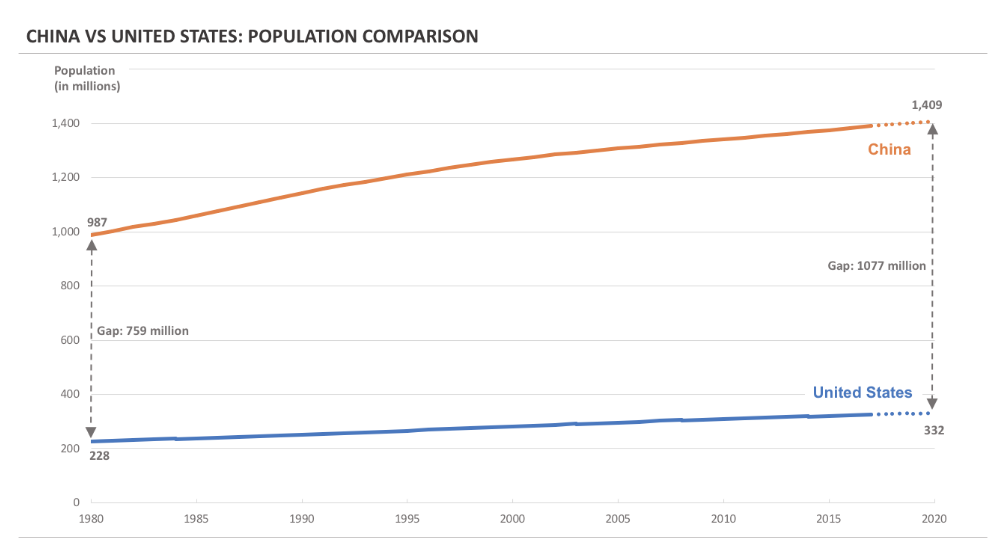
Before comparing the two countries’ GDP per capita, it is important to look at their populations. Experts forecast demonstrates that Chinese population is expected to grow in the same proportion as American. MGM Research (2018) claims that “China had over 4-times more population than that of the US in 1980,” and that “this multiple will remain nearly the same in 2020 as well.” In terms of GDP per capita, China is almost forty years behind the United States since its expected GDP per capita of $10,971 by the end of 2020 is still lower than American GDP per capita in 1980, which was $12,553 (MGM Research, 2018). It is evident that there is a significant distinction between the GDP per capita measures of China and the US. These numbers reflect the differences in consumer behavior between Americans and Chinese. When it comes to making choices in connection to purchases, American households have an increased spending power and a higher disposable income on average. This explains why Americans care less about price, and more about innovation and brand recognition when buying products.
Inflation Rate
The United States enjoyed relatively healthy inflation rates, apart from the period between 2007 and 2009. The global financial crises that took place in 2008 is one of the most impactful economic disasters, which resulted in a rapid growth of inflation rates in both China and America. However, in the US, the rates have gradually stabilized. As a result, Apple did not have to face a lot of challenges in trying to grow organically. The Company had an opportunity to take full advantage of America’s relatively steady economy.
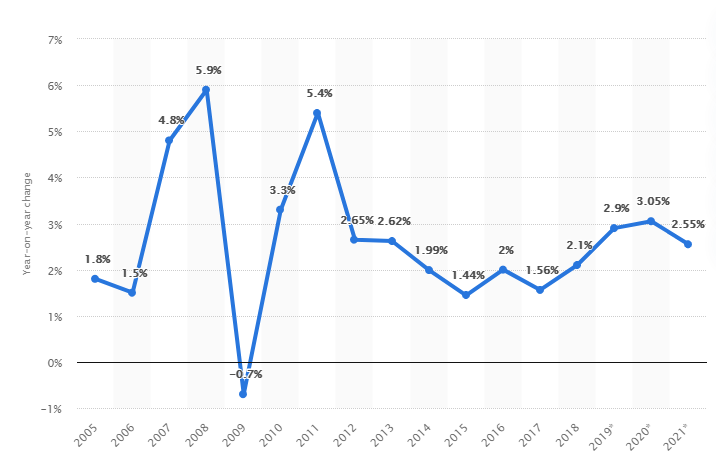
As for China, the average inflation rate in the country was around 2.1% compared to the previous year. China has the lowest inflation rate out of all the emerging countries. It is calculated using the Consumer Price Index (CPI), which “is computed using a product basket that contains a predefined range of products and services on which the average consumer spends money throughout the year” (Textor, 2020). Expenses mostly include rent, groceries, utilities, recreation, entertainment, and taxes. Since the Chinese government started to take economy back to normal, pre-Covid conditions, the country’s “inflation rate eased to 2.4 percent in August 2020 from 2.7 percent in the previous month and in line with market expectations” (China inflation rate, 2020). China’s efficient fight against the virus proves that the Chinese economy is flexible enough to bounce back at record speed.
Unemployment Rate
It is easy to simply look at the numbers and compare China’s unemployment rate with that of the United States. However, the issue lies in the specifics of the Chinese system of collecting data regarding employment. According to China’s National Bureau of Statistics, the country’s unemployment rate at the end of 2019 was 5.2% (Barrett, 2020). Surprisingly, unemployment has risen to just 5.9% during the coronavirus outbreak even though almost half a million businesses filed for bankruptcy during the pandemic (Barrett, 2020). Recently, China has made some improvements in regards to determining the scope of unemployment. Before 2018, Beijing collected the data on unemployment by tracking the number of urban residents, who registered with local governments in order to receive unemployment benefits (Barrett, 2020). As of 2020, the government distributes a monthly survey for city residents to determine unemployment. This system has its flaws:
- Rural population is not included in the national statistics
- This method leads to miscalculation of migrant workers since they are denied the status of an ‘urban resident’
These crucial weaknesses in the Chinese data collection technique lead to the numbers presented by the country’s Bureau of statistics highly unreliable and non-applicable in terms of unemployment comparison with other states.
The global financial crisis of 2007-2009 took a toll on the American labor market, forcing hundreds of thousands of people into unemployment. According to the data presented by the International Labor Organization (2020), the unemployment rate in the United States reached its 25-year high in 2010, with 9.63% of the total population being jobless. Despite the economic decline of 2008, American unemployment rate decreased over the past 10 years. Barrett (2020) reported that the unemployment rate in February 2020 was below 3.5%. However, the novel COVID pandemic led to disastrous outcomes on the employment market. As of April 2020, the unemployment rate in America is 14.7%, a number, which is only expected to grow, according to Goldman Sachs (Barrett, 2020). Americans seem to have much worse employment prospectives than Chinese.
General Government Balances
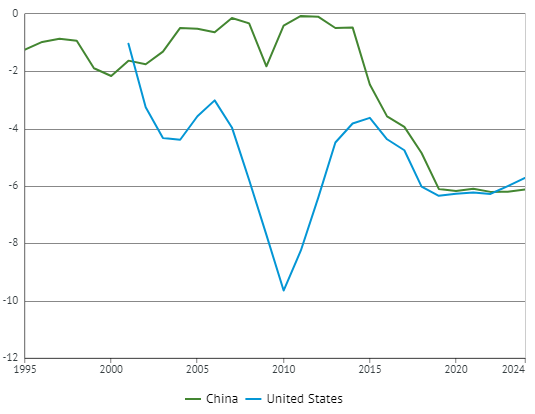
There are very few differences between Chinese and American general government balances. For example, in 2019, China’s general government structural balance was at -6.1 % (International Monetary Fund, 2019). Although the number experienced fluctuation over the past years, it decreased substaintially during 2000-2019. In 2019, America’s general government structural balance was at -6.3 %, up from -6 % in 2018 (International Monetary Fund, 2019). The budget deficit in both countries is actually beneficial for Apple’s operational activity since it aids the company in sustained expansion and growth.
Balance of Payments
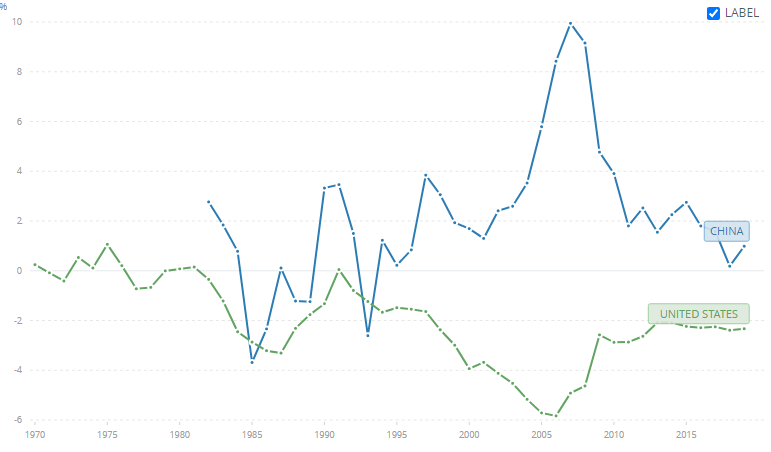
Based on the graph demonstrated below, it is apparent that the economic relationship between China and the US was characterized by American overconsumption and China’s excessive production. However, the situation has changed in the recent years due to the trade conflict between the two of the world’s largest economies. Over the past decade, the two countries have come closer in terms of payment balance. Still, as of 2019, the United States has a negative current account of -2.332, which implies that it cannot produce as much goods as it requires to consume (World Bank, 2019). China, on the other hand, has a positive account of 0.985 (World Bank, 2019). Though the number is much small than what it has been at its peak in 2007 (almost 10), China enjoys a healthy balance of imports and exports, which helps the country’s economy grow at a much faster pace than America.
Analysis of the Monetary and Fiscal Policy
It is important to understand the main difference between the Chinese and American monetary policies, which is the fact that the majority of China’s investments are governmental, and not private. Over the past decades, China had little to no need to utilize fiscal and monetary policy to manage the demand (Ma and Fing, 2011). The country had a lower risk of abrupt economic changes due to the withdrawal of private investments. Therefore, the only possible source of economic instability in China has been the consumption patterns of the household sector (Ma and Fing, 2011). In the recent years, however, Beijing gave up some of the control it has once exerted over the national economy in favor of local businesses. Despite the growing inability of the government to control economic fluctuations, Chinese reforms of the past couple of decades have led to increased productivity and production efficiency. When it comes to the country’s monetary policy, Chinese government keeps it neutral and prudent, while keeping appropriate liquidity levels (Ma and Fing, 2011). Adoption of a proactive fiscal policy also resulted in China’s strategic competitive strength due to the investments in entrepreneurship, innovation, and emerging industries.
As for the United States, the country has an open market policy, which is extremely beneficial for Apple’s operations in the region. The US government often utilizes unconventional policy tools in order to lower borrowing costs as well as facilitate credit availability (Congressional Research Service, 2020). In order to expand the US money supply, the Federal Reserve buys government securities from businesses, banks, and separate individuals (Congressional Research Service, 2020). These securities are paid for by checks, which create new reserves when deposited. Over the past years, there is an issue surrounding the importance of monetary policy vs. fiscal policy. The latter plays a less significant role in economic stabilization, which is needed due to the effects of the pandemic on the global market (Congressional Research Service, 2020). Therefore, monetary policy will likely receive more focus from the government in the upcoming years.
Analysis of Foreign Trade Policy Instruments
As was mentioned earlier, the United States is dependent on the import of resources and export of completed products due to the country’s excessive consumption tendencies. Historically, America has always been in a trade deficit; however, in order to decrease the deficit further, President Donald Trump has initiated certain measures, which led to what is now known as the US-China trade war. In 2018, the President increased tariffs and imposed trade barriers in order to reduce the import of Chinese products (Crabtree, 2020). As a response, the Chinese government raised import duties for all of the goods coming from the United States (Crabtree, 2020). The falling out between two of the world’s economically strong countries has benefitted some enterprises, including Samsung. The trade war allowed non-Chinese manufactures to penetrate lucrative markets without the threat of strong competition.
The situation with Apple, on the other hand, is far from advantageous. Firstly, China is a huge market for the company, which means that the Chinese response to America directly affects Apple’s operations in China. Secondly, China has long been the primary location of Apple’s supply chain, which can be described as “a complex, intricate web that draws components from all around the world to Chinese factories, where they are put together by outsourcers such as Foxconn and Pegatron” (Crabtree, 2020). Therefore, in the light of the recent events, Apple’s reliance on China can be considered its source of weakness. The company’s Chinese sales have declined as patriotic consumers started to show their allegiance to national brands, including Huawei (Crabtree, 2020). The fact that Apple employs more than 5,000,000 Chinese citizens has provided a certain level of political protection (Crabtree, 2020). Despite that, the company removed HKmap.live from AppStore due to the Chinese government’s pressure (Crabtree, 2020). Apple should abandon the hopes of US and China being friendly again. Instead, the enterprise needs to start moving small portions of its production to other locations.
References
Apple Inc. (2020). Shop and learn. Web.
Barrett, E. (2020). The mystery of China’s unemployment rate. Fortune. Web.
Business Wire. (2020). One in three smartphones sold in China in Q2 2020 was a 5G phone. Web.
China inflation rate (2020). Web.
Congressional Research Service (2020). Introduction to U.S. economy: Fiscal policy. Web.
Crabtree, J. (2020). Apple has found itself caught between China and the US. Wired. Web.
Gartnenberg, C. (2020). Donald Trump extends Huawei ban through May 2021. The Verge. Web.
Gizmochina. (2020). Huawei dominates China with nearly half of the smartphone market share. Web.
Holst, A. (2020). Smartphones in the U.S. – statistics & facts. Web.
International Labor Organization. (2020). Country profiles. Web.
International Monetary Fund. (2019). IMF: World Economic Outlook (WEO), October 2019. Web.
Kalleberg, A. L., and Von Wachter, T. M. (2017). The U.S. labor market during and after the Great Recession: Continuities and transformations. The Russell Sage Foundation Journal of the Social Sciences: RSF, 3(3), 1-19. Web.
Ma, J., and Fing, W. (2011). On China’s current economic policy: Active fiscal policy and prudent monetary policy. Asian Social Science, 7(8), 164-166. Web.
MGM Research. (2020). China vs United States – A GDP comparison. Web.
Mordor Intelligence. (2020). Smartphones market – growth, trends, and forecast (2020 – 2025). Hyderabad, India: Author.
Reuters. (2020). Apple Inc. – AAPL.O Statistics. Web.
Richter, F. (2020). The size of Apple’s China business. Web.
Silver, C. (2020). The top 20 economies in the world. Investopedia. Web.
Smith, D. (2019). Here’s why it’s so hard to buy Huawei devices in the US. Business Insider. Web.
Textor, C. (2020). Inflation rate in China 2005-2021. Web.
World Bank. (2019). Current account balance (% of GDP) – China, United States. Web.