Apple is one of the Big Five technology companies, alongside Amazon, Google (Alphabet), Facebook, and Microsoft. Its array of products includes smartphones, tablets, personal computers, and wearable devices, among others. It serves a clientele that seeks authentic and aesthetically pleasing performance products with assured quality and durability. Hence, in this analysis, the author explores the company’s performance between 2006 and 2019 by examining its macro and microeconomic environment and their impact. The author contextualizes the Apple’s performance by comparing it to Samsung and Microsoft.
The Fundamental Economics of Exposure
Business performance is the outcome of organizational strategy, which often represents a response to macro and microeconomic factors. For Apple, an effective response to the prevailing business conditions has always been designing, manufacturing, and marketing its products in a way that addresses changing customer needs. Evidence of excellent strategy of the California-based company is available in its financial reports, with the fiscal year being the 52nd or 53rd week period that ends on the last Saturday of September.
Exposure to the Macroeconomic Environment
Macroeconomics examines the global, regional, or national economy in its entirety as one big market. It considers how the government manages and controls money circulation by, for example, managing its debts or implementing austerity packages to facilitate stable growth (Begg and Ward, 2016). Macroeconomics is important to Apple because it addresses economy-level issues affecting its operational cost and revenues. Figure 2.1(a) concerns critical macroeconomic issues, with the area below and above the blue line representing unemployment and resource scarcity, respectively. At point 2.5, the company produces the same amount of Product Y and Product X using the available resources. At Point 5, the company generates more Product X and no Product Y. Therefore, resources are limited, and companies have to choose what to do with them to improve profitability.
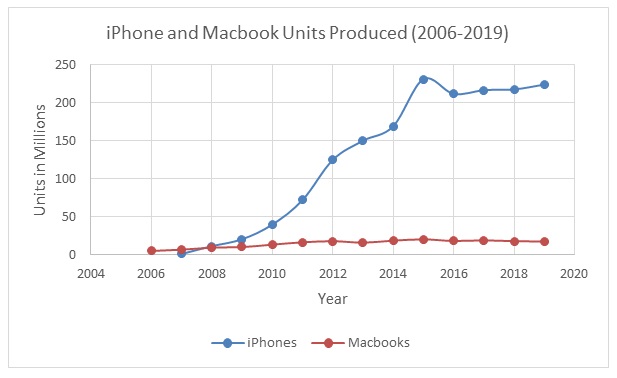
In reality, however, many factors influence the operations of a company. For example, as Apple became profitable from improved customer engagement, it re-invested some of the money back into the business, leading to an increase in its ability to meet demand for iPhones, iPads, Macbooks, and services. Figure 2.1(b), for instance, shows that Apple produced more items progressively from 2006 to 2019. Each year, the number of manufactured units rose due to technological improvements at the company, among others.
Apple Performance from 2006 to 2019 Compared to Samsung and Microsoft.
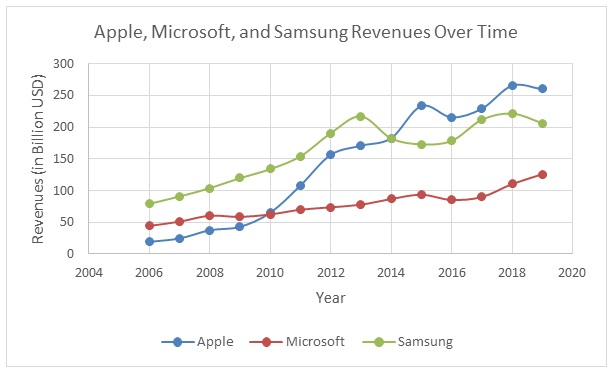
Looking at the available records for the companies from their 2006 to 2019 fiscal years (see figure 2.1.1), Apple’s net income has generally risen faster than its competitors Samsung and Microsoft. Samsung has had almost the same upward trend as Apple, but Microsoft’s revenues increased by a significantly small margin over the period. Apple rose from an underdog in 2006 to have the highest revenues of the three companies in 2019. As shown in Figure 2.1.1, Apple had become a leader in terms of revenues by 2015. The company’s success is due to the effectiveness of its business strategy and focus.
Performance During the 2008/2009 Financial Crisis
When the 2008/2009 financial crisis was deepening and rival sales softening, Apple attained significant sales in 2008’s concluding three months. It sold more than 4.3 million iPhones and 2.7 million Macbooks (Form 10-K Apple Inc. for the period ending September 26, 2009, p. 43). In its first fiscal quarter, ending 31st December 2008, Apple sold 1.8 million notebooks (representing a 34 percent increase) and 728,000 desktops (representing a 25 percent drop over the same quarter in 2007) (Form 10-K Apple Inc. for the period ending September 26, 2009). Although Macbook sale revenues were essentially flat year-over-year in 2008, the company sold nine percent more of the product during the last three months of the period (Form 10-K Apple Inc. for the period ending September 26, 2009). The company’s positive performance during the 2008 crisis confirms that innovation, Apple’s preferred emergency response, can push a business forward, regardless of the prevailing circumstances. For example, the company introduced new all-aluminum “unibody” Macbook notebooks during the 2008/2009 financial meltdown, which became major winners even though Apple’s growth rate slowed down during the period. In terms of stock, its price was a high of $7.64 on December 1, 2009, up from $3.49 on January 1, 2007. See Table 2.1.2.
Table 2.1.2: Apple’s Stock Price Fluctuation During the Global Financial Crisis of 2008-2009 (Source: Apple Inc. historical data, 2020).
Impact of Inflation
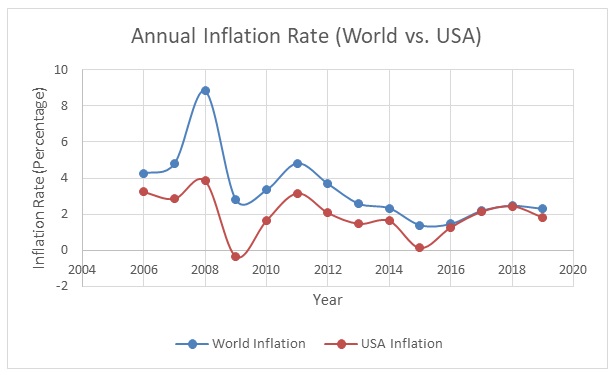
Inflation is the rate of change in the average price level. A three percent inflation rate means that prices have risen by that value over the previous 12 months. Inflation erodes customers’ purchasing power, encourages spending (investing), causes more inflation, may raise or lower borrowing costs, and increases growth. Thus, changes in this fundamental rate over time affected Apple’s potential sales, investment decisions, and borrowing decisions. When inflation rates were low, such as in 2009 (see Figure 2.1.3), customers had more purchasing power, and Apple experienced a surge in product sales. In 2008, when inflation was high, Apple had a reduced growth rate.
Impact of Fiscal, Monetary, and Government Policies
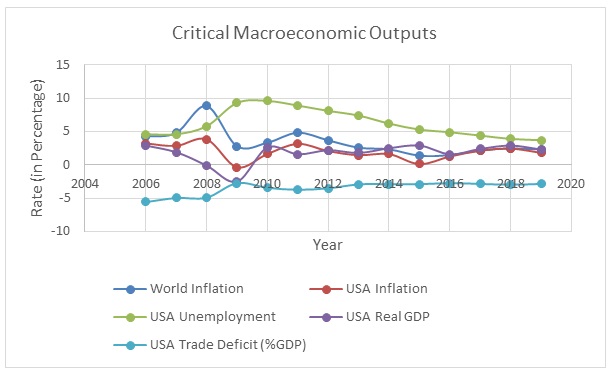
Governments use fiscal, monetary, and other policies to control the economy and influence growth. For example, Figure 2.1.4 shows the critical macroeconomic outputs associated with federal policies. As shown in the graph, inflation was under five percent in the United States from 2006 to 2019, and the government cut interest rates leading to increased borrowing, faster spending growth, and rising GDP. Companies, including Apple, benefitted from these changes. However, the budget deficit in the same period rose due to increased government spending and reduced taxation. Consequently, imports exceeded exports, and a national trade deficit remained. Fluctuating inflation and weak growth led to declining interest rates and growing unemployment. A temporary solution to the problem was implementing tax hikes. Meanwhile, these fiscal, monetary, and government changes affected Apple’s profitability because they influenced money availability.
Impact of International Trade and Exchange Rate
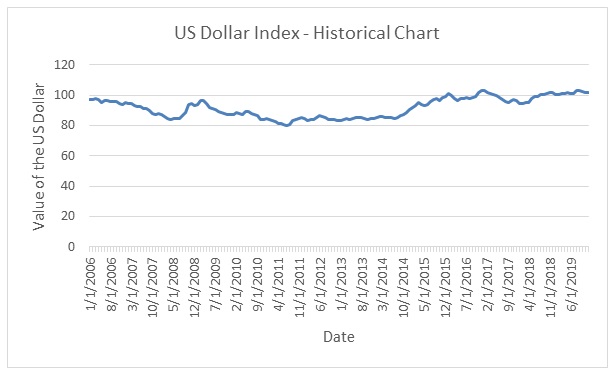
International trade and exchange rates affect Apple’s business because the firm designs and manufactures products and services for the local (US) and the global market. As shown in Figure 2.1.5, the US dollar value has fluctuated over time, affecting the iPhone designer’s revenues. Changes in the US dollar value also affected Microsoft’s and Samsung’ sales volumes because it is a global currency. For example, from Figure 2.1.5, the USD was the strongest on February 1, 2017. Apple, Samsung, and Microsoft revenues increased during this time, which was surprising given that they had significantly dropped in the previous year (see Figure 2.1.1 for revenue trends over time). The trade volume between the United States and other counties globally determines trade deficit levels and the dollar’s value or strength. If the US exports more goods than imports, it reduces its trade deficit while simultaneously increasing its currency value. More exports occur when proper infrastructures that support local production exist. Governments may also give local manufacturers incentives to do value addition to primary goods to encourage more economic engagement with the rest of the world. As a US corporation, Apple sells its products worldwide and this earns the country the much-needed foreign currency.
Exposure to the Microeconomic Environment (Market Exposure)
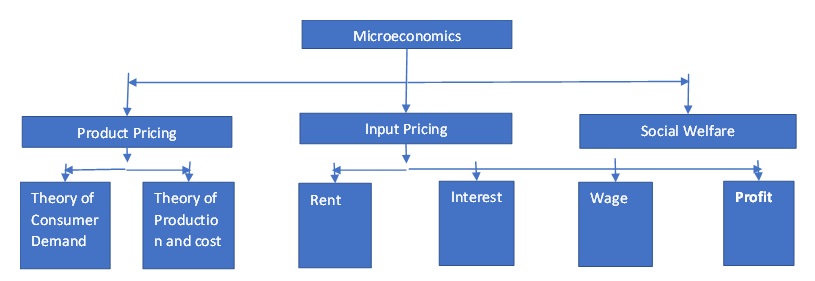
Microeconomics is the study of the reasons for product price changes, influences of firms’ cost, and the determinants of organizational profitability. The work involves examining and comprehending companies, consumers, and workers within markets. It addresses various market forces that affect a company’s revenues, operational costs, profitability, and decision-making (Begg and Ward, 2016). Since its focus is on individual behavior, the study of microeconomics does not consider the whole economy; it shows why buyers prefer certain products instead. Figure 2.2 is an illustration of some components of microeconomics like social welfare and product and input pricing and how Apple and its competitors use them to influence wages, profits, rent, and interest.
Buyers/Aggregate Demand Curve
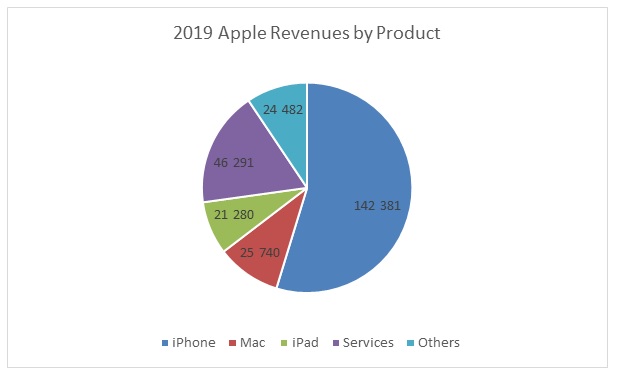
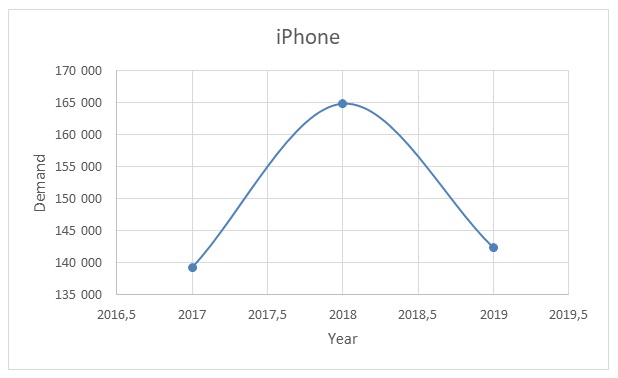
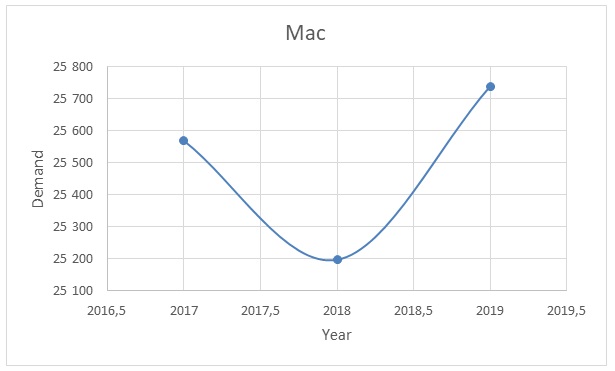
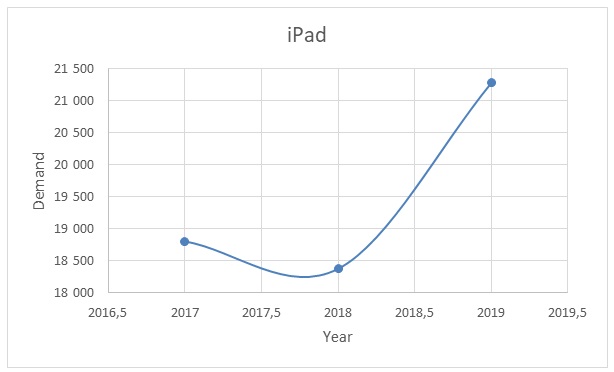
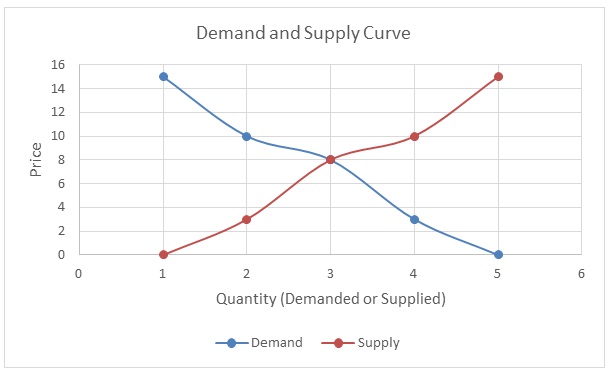
For Apple, microeconomic decisions revolve around anti-competitive conduct. For example, the company’s leading revenue share, lock-in effects, and customer/client bigotry offer the iPhone manufacturer monopolistic power. For this reason, Apple controls 71 percent of the mobile platform market by revenues. Additionally, iPhone users’ switching costs to other platforms are 50 times more than a five percent app price increase. Most importantly, Apple has increased iPhone prices by 33 percent over time without losing sales. Since the firm often produces products according to existing orders, there is no excess demand or supply of iPhones, Macbooks, and iPads (see Figures 2.2.1(a), (b), and (c)). Still, the iPhone smartphone is the leading Apple product in terms of sales revenues (see Figure 2.2.1 (a)).
Suppliers/Aggregate Supply
Apple has hundreds of suppliers from mostly India and China. Indeed, the top 200 Apple suppliers represent 98 percent of procurement expenditures for manufacturing, materials, and assembly of its products worldwide for the 2019 fiscal year (Supplier list, 2019). Every year, the company improves upon its progress to protect the planet and those in its supply chain through deep partnerships and the setting of high standards that suppliers must meet. As shown in Figure 2.2.2, some suppliers depend on Apple almost entirely while others get less than 50 percent of their business from the iPad developer.
Competing Products
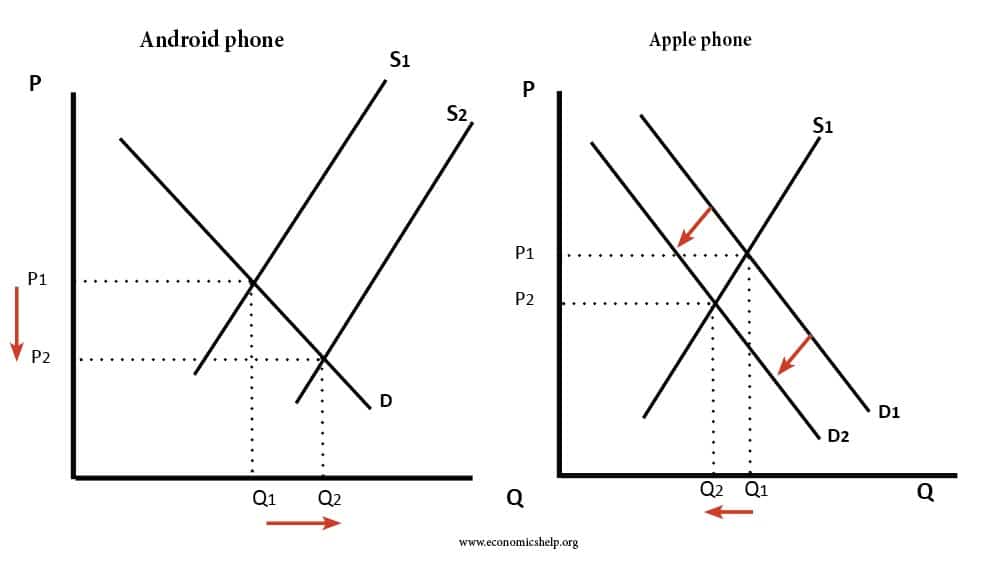
Competing products include Samsung phones and other smartphones on android or other platforms. In the “personal computers” segment, the arch-rival is the Windows operating system. Apple tries to stifle competition by using the lock-in effect, which ties its products and services to proprietary software. For example, iPhones operate exclusively on the iOS platform, while Macbooks use the Macintosh operating system. iPhone users can download the apps they need from the AppStore, which hosts more than two million applications and nearly 50 percent of American Smartphone users. These consumers generate over 20 billion in sales each quarter by downloading eight billion apps. Without a doubt, the Apple ecosystem ignited a social, cultural, and economic phenomenon that altered how people play, work, travel, and meet. Anticompetitive strategies implemented by the institution are the only threats to this thriving ecosystem. As shown in figure 2.2.3, theoretically, a fall in android prices (depicted in the left panel) causes a rise in its demand and a fall in iPhone sales.
Complementary Products
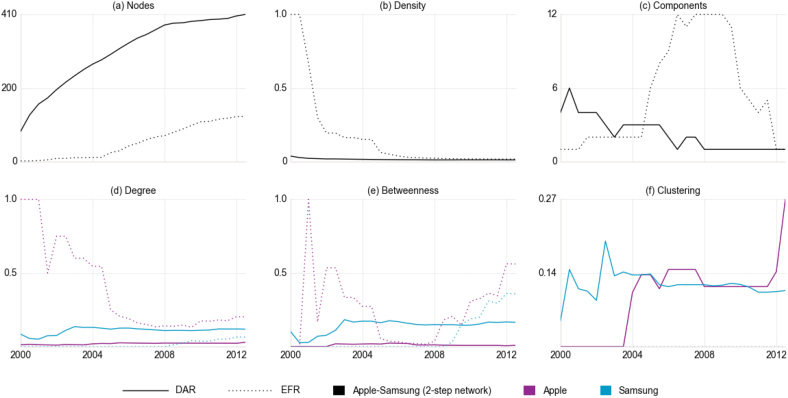
Essentially, Apple manufactures all complementary products for iPhones, Macbooks, and iPads. For example, the iPhone uses the iOS, and Macbooks use Macintosh, all of which are made by Apple. For mobile applications that improve user experience, iPhone owners rely on the AppStore only. Apple’s wearables (such as Apple Watch and Fitness products) are tied to the iPhone as well, meaning that it is easier for users to pair Apple products than use competing goods. The complementarity of these devices increases the company’s sales volume, user convenience, and brand loyalty. Nonetheless, as shown in Figure 2.2.4, business ecosystems have a heterogeneous and ever-evolving array of interconnected firms and individuals relying on a complex, international network of associations.
Impact of Consumer Income
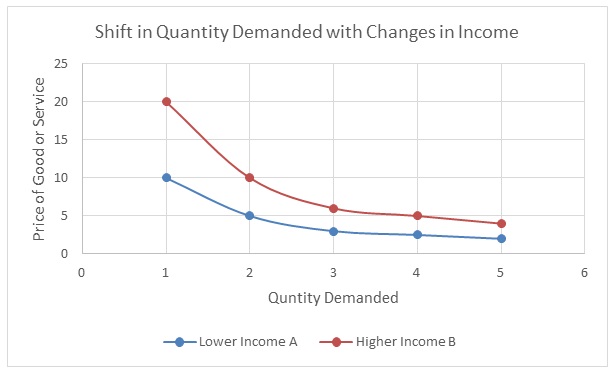
Increases in the buyer’s disposable income should result in more demand for products and vice versa in a perfectly competitive market. As shown in Figure 2.2.5, an advancement of the purchaser’s monetary strength from “Lower Income A” to “Higher Income B” led to an upward shift in the quantity of demanded products at each price level. The same applies to Apple products, as the company manufactures high-quality, expensive products. With increases in people’s spending abilities, Apple can sell more products because the buyers circumvent the cost barrier. However, other factors in the market like government regulations, price of Apple products, accessibility, and close substitutes availability may affect the quantity demanded.
Price Elasticity of Demand
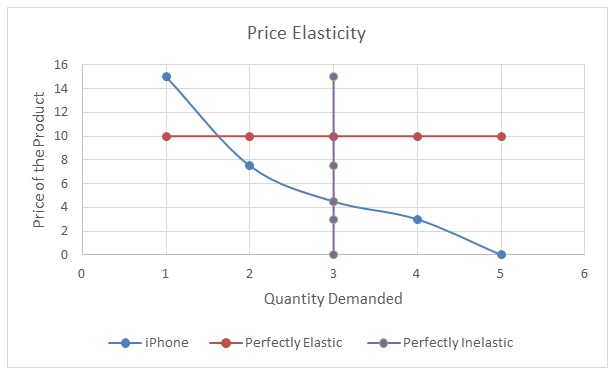
Apple offers normal products because their demand is neither perfectly elastic nor inelastic. Changes in these goods’ prices are indirectly proportional to the demanded quantity; high prices lead to low demand and vice versa. However, Apple has successfully overcome this economic reality by introducing minimally upgraded versions of existing products periodically at a higher price. Sometimes, these “updated” versions have no significant functionality improvements, except for size alterations and name changes. Indeed, using this technique, Apple has increased the price of its products by at least 33 percent over time without experiencing a decline in demand.
Price Elasticity of Supply
As noted earlier, Apple supplies what customers order, therefore, there is no surplus demand or supply. However, because the company operates in a normal market, it wishes to supply more products at high prices, as shown in Figure 2.2.7. Indeed, the organization has been scaling up its production abilities over the years to ensure it can always meet buyer demand.
Apple’s Handling of the Microeconomic Environment
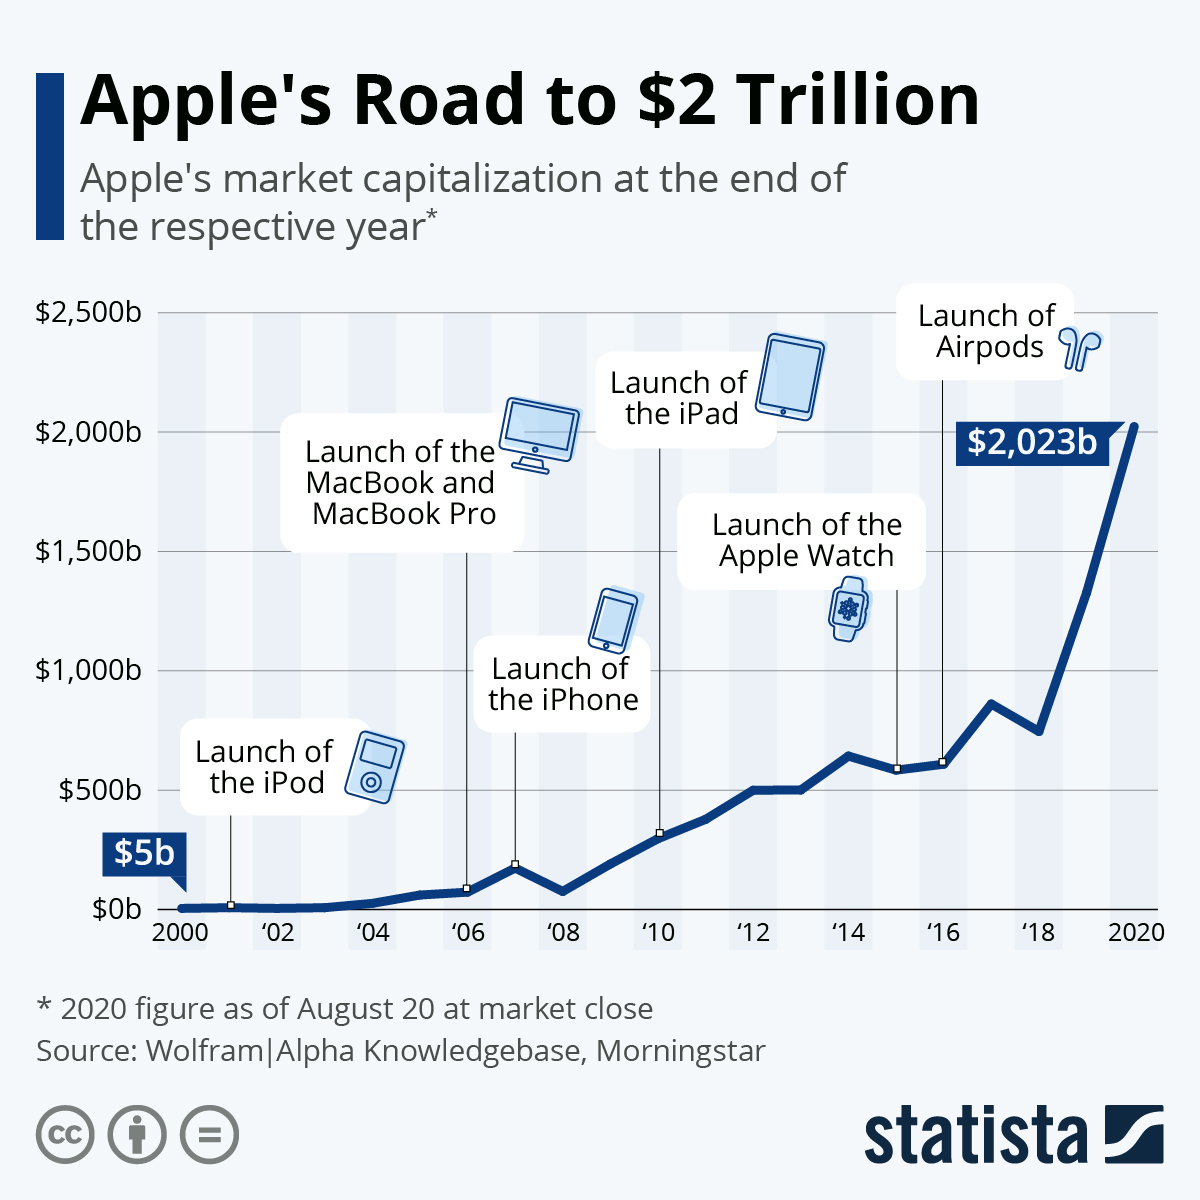
Apple has effectively handled its microeconomic environment, leading to its development into one of the world’s most significant and most valuable firms. The company has used persuasive tactics to address microeconomic issues and take advantage of existing market opportunities. As shown in Figure 2.2.8, strategic decisions that have facilitated the growth have included the launch of several products at different times, including the iPod, Macbook, iPhone, iPad, Apple Watch, and AirPods. With each new product, the company captured a bigger market and positioned itself well for an industry takeover. The California company updates these products periodically and packages them as more premium items compared to last versions.
Recommendations for Handling Pandemic and Beyond
Having survived the 2008/2009 financial meltdown, Apple is no stranger to dealing with crises. Even during the ongoing COVID-19 pandemic, the company continues to display positive performance and ability. For example, as more people resolved to work and study from home, there was a significant uptick in the sale of Macbooks and iPads. Thus, the only recommendation for Apple during the epidemic and beyond is for it to remain strategic and innovative by investing more money in research and development (R&D). As shown in figures 2.2.9(a) and 2.2.9(b), Apple has been investing significantly less money, both in absolute and relative terms, in R&D compared to its rival Microsoft. With more investment in R&D, future product updates will contain better features and functionalities that make users want to buy them. Also, separating products and their accessories and creating an array for different price ranges may help the company in the future.
Exposure to Government and Regulation
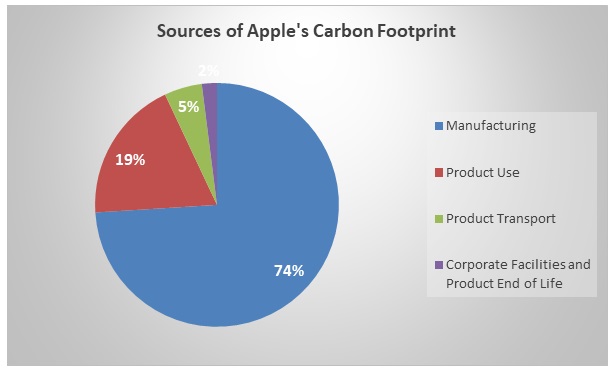
Within an economy, a government collaborates with existing systems to provide incentives, structures, and institutions that promote and foster development. Indeed, around the globe, national leaders, aided by voluntary private individuals and organizations, solve fiscal problems through joint law or policy formulation and implementation. They create regulations that improve the business environment while simultaneously ensuring corporate activity does not harm people or the environment. Apple has responded to government regulations over time by improving its products’ design and availability, changing its terms and conditions, and investing more money in corporate social responsibility. Thanks to stricter government requirements about pollution, Apple is keener on its carbon footprint now more than ever. It calculates it annually to determine priority areas to concentrate pollution reduction efforts. As shown in Figure 2.3, most of the company’s negative impact on the environment comes from its manufacturing activities.
The Fundamental Economics of Cost Vulnerability
Business operations are risky undertakings that rely on the entrepreneur’s ability to face and overcome challenges. Since its founding on April 1, 1976, Apple has faced various circumstances, ranging from financial crises to epidemics, that threatened its existence. These situations created vulnerabilities that have included human-social, physical, economic, and cultural-environmental risks. Table 3 below summarizes these issues and the associated indirect and direct losses. All these issues have hidden costs as Apple often evaluates and addresses them in monetary terms.
Table 3: Vulnerability Types and Associated Losses (Source: created by the author).
Impact of Uncontrollable Macro Forces on a Firm: The Role of the Internal Economics (Production, Inputs, and Costs)
Uncontrollable macro forces include demographic, economic, natural, technological, political, and cultural trends. Table 3.1 summarizes information about these macroeconomic factors with a view of aiding firms to benefit from them. The table shows the role of internal economics like production, inputs, and costs on uncontrollable macro forces’ impact on an organization. As noted earlier, a company’s success is often due to its effective and reliable business strategy, which usually affects the internal business environment.
Table 3.1: Macro Forces Description and Impact (Source: created by the author).
Fixed, Variable, Total, and Average Costs and Short Run Average Costs
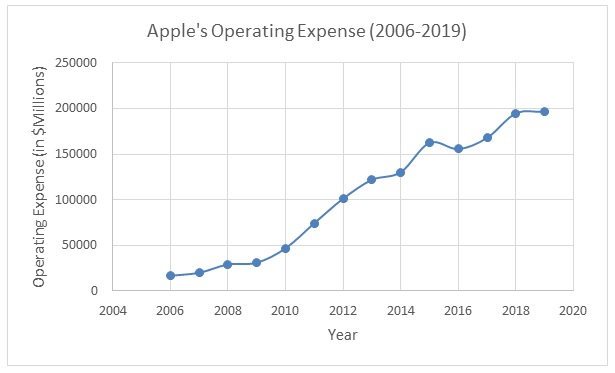
Fixed costs include permanent expenses like machinery and office infrastructure, and variable costs consist of the price of production factors (like electricity and water) whose amount changes depending on the volume of outputted goods. Total cost is derived from adding variable and fixed expenses together, while the average cost is equal to dividing total costs by the quantity produced. For 2019, Apple’s annual operating fee stood at $196.244 million compared to $194.697 million in 2018. In 2006, Apple spent only $16,862 million in total operational cost as shown in Figure 3.2. Apple is a big company that benefits from economies of large-scale operations. Therefore, its short-run average cost, obtained from the addition of average fixed costs and average variable cost, is significantly low.
Type 1 Vulnerability and How Apple is Mitigating Against It
Type I vulnerability refers to the level to which the size of a company’s fixed costs affect the institution’s strength. Apple has mitigated against type I exposure by outsourcing most manufacturing work to institutions in China and India. Therefore, Apple has not invested in fixed infrastructure and manufacturing machinery. Instead, it seeks qualified suppliers to engage in this work and to deliver quality products on time. It places strict quality requirements on its suppliers, some of whom depend almost entirely on Apple to survive.
Type 2 Vulnerability How Apple is Mitigating Against It
Type 2 vulnerability includes interest rate increases and other costs incurred due to borrowing. One may also argue that Apple has another type 2 vulnerability emanating from high fuel and electricity requirements. Since it has a human-capital intensive environment, Apple’s need for power to run offices, residential spaces, labs, recreational centers, and other structures that are part of its community remains high. The firm is mitigating against this vulnerability type by innovating.
Protection and Management
Apple understands that the protection and management of fundamental economics are critical in securing improved performance. The company is continuously examining its business environment to determine what it needs to improve to maintain market leadership. Innovation and lock-in effects have been the dominant drivers of the company’s performance over the years. Competitors, including Microsoft and Samsung, have found it difficult to overtake Apple due to its design and complementarity. Customers also love Apple products because they are of good quality and represent premium services. Moving forward, Apple will continue relying on its unique product design, ecosystem, and innovation to maintain customer loyalty and profitability within the highly dynamic contemporary business environment.
Reference List
Apple Inc. historical data (2020) Web.
Basole, R.C. et al. (2015) ‘Understanding business ecosystem dynamics: A data-driven approach’, ACM Transactions on Management Information Systems, 6(2), pp. 1-32.
Begg, D. and Ward, D. (2016) Economics for business. Maidenhead: McGraw-Hill.
Form 10-K Apple Inc. for the period ending September 26, 2009 (2009) Web.
Richter, F. (2020) Apple’s road to $2 trillion, Web.
Supplier list (2019) Web.