Company Background
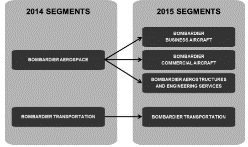
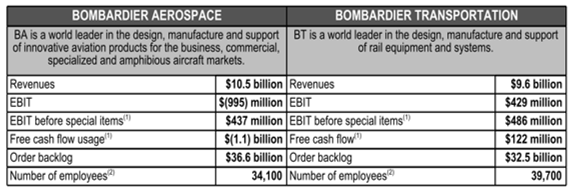
Bombardier Inc. (Bombardier) was incorporated in June 1902 and today leads the global market in manufacturing planes and trains. The company is headquartered in Montreal, Canada and has recently gone organizational restructuring which has resulted in dividing the company into two segments; Bombardier Aerospace (BA) which encompasses Bombardier Business Aircraft, Bombardier Commercial Aircraft, and Bombardier Aerostructures and Engineering Services and Bombardier Transportation (BT). BA is responsible for the design, manufacturing and support for the company’s aviation products and BT focuses on rail transportation equipment and services offering products such as railcars and locomotives.
The financial position of the company has been questionable of late with a net income loss of $1246 as reported at the end of their fiscal year in 2014. Bombardier suggests this is normal in their industry and that they are at the end of an investment cycle and will become profitable again once the restructuring of the company has been completed.
Corporate Governance Analysis
Board of Directors
Bombardier’s board of directors is mandated to have 5-20 members. Currently 14 directors sit on the board, 8 of whom are independent. Five out of the six non-independent directors are members of the Bombardier family, including the Chairman of the Board, Pierre Beaudoin. The sixth is Alain Bellemare, who is also the President and CEO of the company.
The company’s website discloses that, as of March 2015, the Bombardier family owns, directly and indirectly, 79.29% of class A shares, and 0.08% of class B shares. Since class A allows the holder ten votes per share, the family controls 54.35% of all voting rights. The family clearly retains tight control over the company and this affects the company’s choice in financing and voting structure.
The members of the board of directors are elected by the shareholders at the annual shareholder meeting. Since the Bombardier family controls the majority of the votes, it is therefore the Bombardier family who decides on the composition of the board.
The company website’s also states that the board is heavily involved in corporate decision-making with Alain Bellemare suggesting the corporate strategies and then the Board deciding on its appropriateness and supervises its implementation process.
Management and Shareholders
Bombardier offers both common and preferred shares. There are two types of common shares, class A and class B, and as mentioned above, they offer multiple voting rights and subordinate voting rights respectively. There are three types of preferred shares; series 2, 3, and 4. Both common and preferred shares can be bought or sold through financial institutions that offer brokerage services, Bombardier does not trade directly with investors.
Bombardier hosts an annual meeting for shareholders, quarterly conference calls, roads shows, plant tours and even individual meetings however in 2014 Bombardier announced they would issue $600 million in equity and $1.5 billion in long-term debt, diluting the shareholder’s voting power.
While there is a gap between management and shareholders since the family controls most of the voting power in the company, this year in March 2015 former Bombardier CEO Pierre Beaudoin has his pay cut by 14% after he failed to meet performance targets.
Bombardier and Financial Markets
Current share prices and volume as well as dividend information can be found on the Bombardier website. The company’s main shares are sold on the TSE, while other shares are sold on the QTQX.
Bombardier releases detailed quarterly reports as well as yearly financial and activity overviews on their website, which give investors complete access to information on the company’s past results as well as future plans.
Social Obligations
Bombardier has created a mandate called the Sustainability Approach which they have aligned with their corporate growth strategy. It is comprised of three subsections in which they outline their intentions in regards to ethical business practices and company transparency, their responsibility to build products that meet societal needs, and their environmental protection plans. Information on their yearly sustainability performance is included in their annual activity report.
Bombardier has also created a gender diversity policy for their board and management team. The policy states that by January 2018, the Board of Directors will be comprised of a minimum of 30% women and management will be comprised of a minimum of 25% women.
Shareholder Analysis
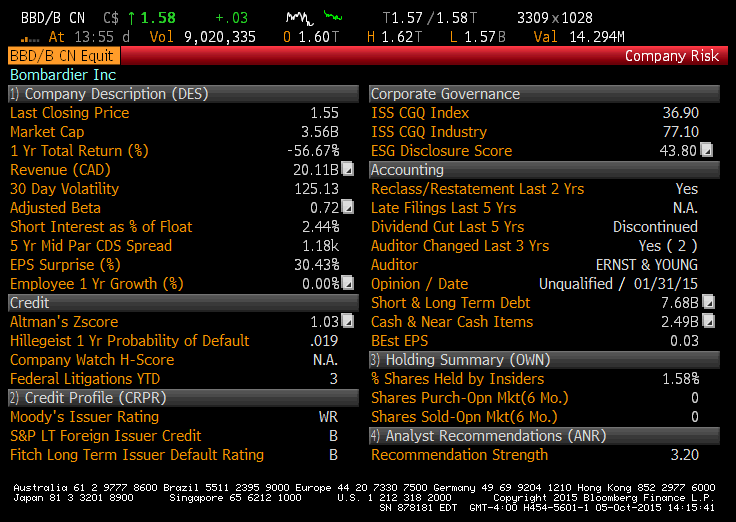
As of October 5, 2015, 61.95% of Bombardier investors are Canadian, followed by the United States who owns 23.15%. The geographic location of the remainder of investors is either unknown or located in various countries across Europe. Furthermore 90.14% of the shares are owned by investment advisors followed by 5.86% owned by individuals, and 2.82% owned by the government. Investment advisors buy or sell shares on behalf of clients, either individuals or institutions, but we are not given information on behalf of whom these advisors own shares.
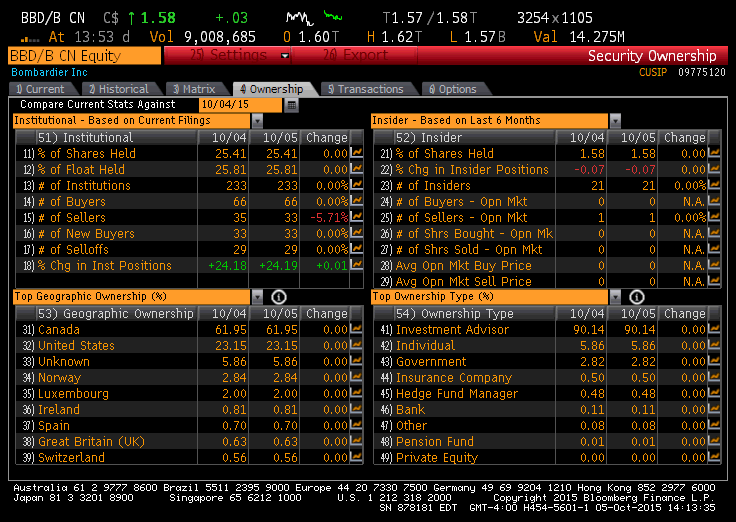
Institutions own 25.41% of securities spread across 233 institutions and insiders own 1.58%, spread across 21 individuals, making the marginal investor for Bombardier institutional investors. On October 5, 2015 the percent change in number of institutional sellers decreased by is 5.71% in one day showing that they are active traders who will influence the stock price.
Risk and Return
Risk Profile
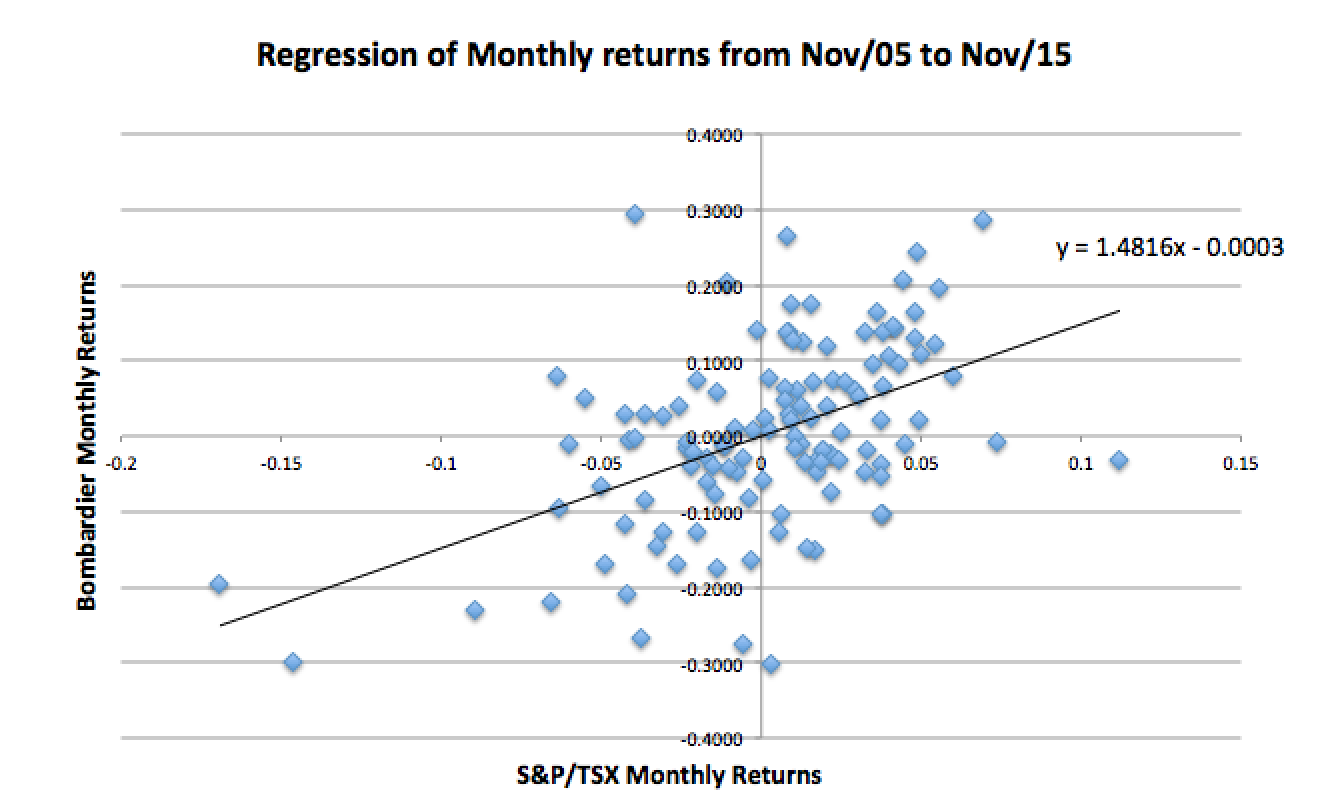
In order to determine the risk profile of Bombardier, we conducted a regression of monthly returns from November 2005 to November 2015 against the S&P/TSX. The unadjusted beta, which is also the slope of the regression, is 1.48. We then adjusted the beta to account for its tendency to move towards 1 over time:
Adjusted beta = 0.3333 + 0.6667(1.4816) = 1.3211
Beta represents the level of correlation between the returns of Bombardier and the S&P/TSX, with a value of 1 being perfectly correlated. A beta higher than 1 indicates that Bombardier is riskier than the market index which is the case for Bombardier.
The R2 for Bombardier is 0.2370 which tells us that 23.7% of the risk is market risk and the remaining 76.3% is firm-specific or industry-specific risk. Since Bombardier is in the Transportation Equipment industry, this percentage would be representative of that.
Performance Profile
The regression equation also gives us the value of alpha, which is -0.0003. The risk-free rate we will use is 3.5% which is the 30-year benchmark bond taken from the Bank of Canada. Using this value and the monthly risk-free rate (0.0029) we can calculate Jensen’s alpha:
Jensen’s alpha = -0.0003 – 0.0029(1-1.3211) = 0.0006
This represents the monthly alpha, and the annualized value is:
(1+0.0006)12 – 1= 0.0072
This tells us that from November 2005 to Nov 2015, Bombardier performed 0.72% better than the market on a yearly basis.
In order to separate firm and industry-specific risk, we ran a regression of Power Shares Aerospace & Defense ETF (PPA) against the S&P/TSX.
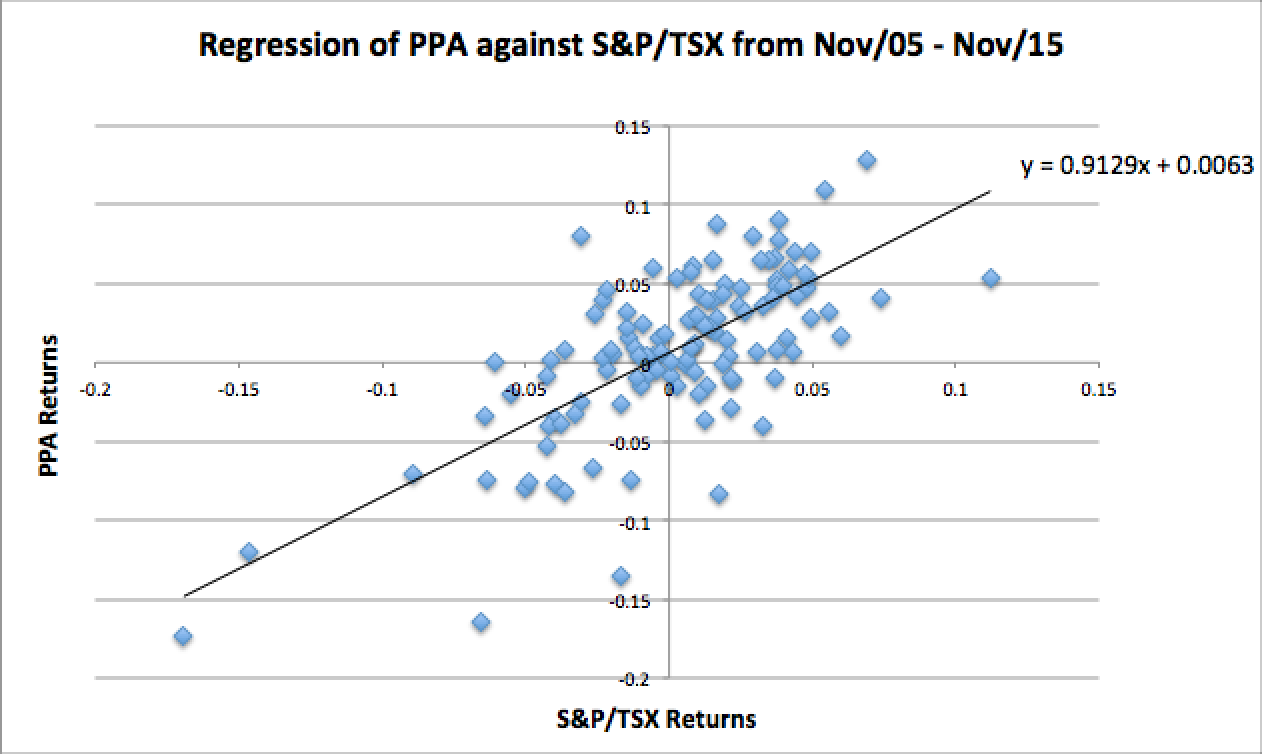
The analysis gave us an alpha of +0.0063 and a beta of 0.9129.
Adjusted beta = 0.3333 + 0.6667(0.9129) = 0.9419
Jensen’s alpha = 0.0063 – 0.0029(1-0.9419) = 0.0061
The annualized industry alpha then is (1.0061)12 – 1 = 0.0757, which means the industry performed 7.57% better than the market annually from November 2005 to November 2015. Since the industry alpha is greater than Bombardier’s we can assume that Bombardier’s performance in comparison to the market can be attributed to the industry, so none of the positive performance can be attributed to management. We can however attribute to management a negative performance of 6.85% compared to the industry.
Jensen’s industry alpha- Jensen’s firm alpha= 0.0757-0.0072=0.0685
The R2 for the industry was 0.4977. Since Bombardier’s R2 was lower, this tells us that Bombardier has more diversifiable risk than the industry.
Cost of Equity
To calculate the company’s cost of equity we will use the adjusted beta from the regression analysis and the 3.5% risk-free rate from above. For the market risk premium we used the historical premium approach. The values were taken from 20 years of historical data which is why we did not use the risk-free rate from the Bank of Canada. We used a longer time period for the market risk premium because shorter time periods caused negative values due to the effects of the 2008 financial crisis.
Ke = Rf+β(Rm-Rf)= 0.029 + 1.3211(0.067-0.029) = 0.0792
Cost of Debt
To calculate the cost of debt, we estimated a synthetic rating by calculating the interest coverage ratio, and from there added it to the risk-free rate to come up with a before-tax cost of debt.
Interest Coverage Ratio (ICR) = EBIT/Interest Expenses
= 944 M5/500 M CDN
= 1.89
Since Bombardier’s market capitalization is $3.26 billion, the ICR-Default Spread Chart for Firms with Market Capitalization of Less than $5 billion was used.
Bombardier has a B- rating, which is equal to a 6% default spread. The rating listed on the Bombardier website as of August 13, 2015 is B, which is more or less consistent with our calculation.
We used the listed rating for our cost of debt calculation where the default spread of a firm with a B rating is 4%.
Estimated pre-tax cost of borrowing (Kd) = Rf + default spread
= 0.035 + 0.04
= 0.075
Cost of Preferred Stock
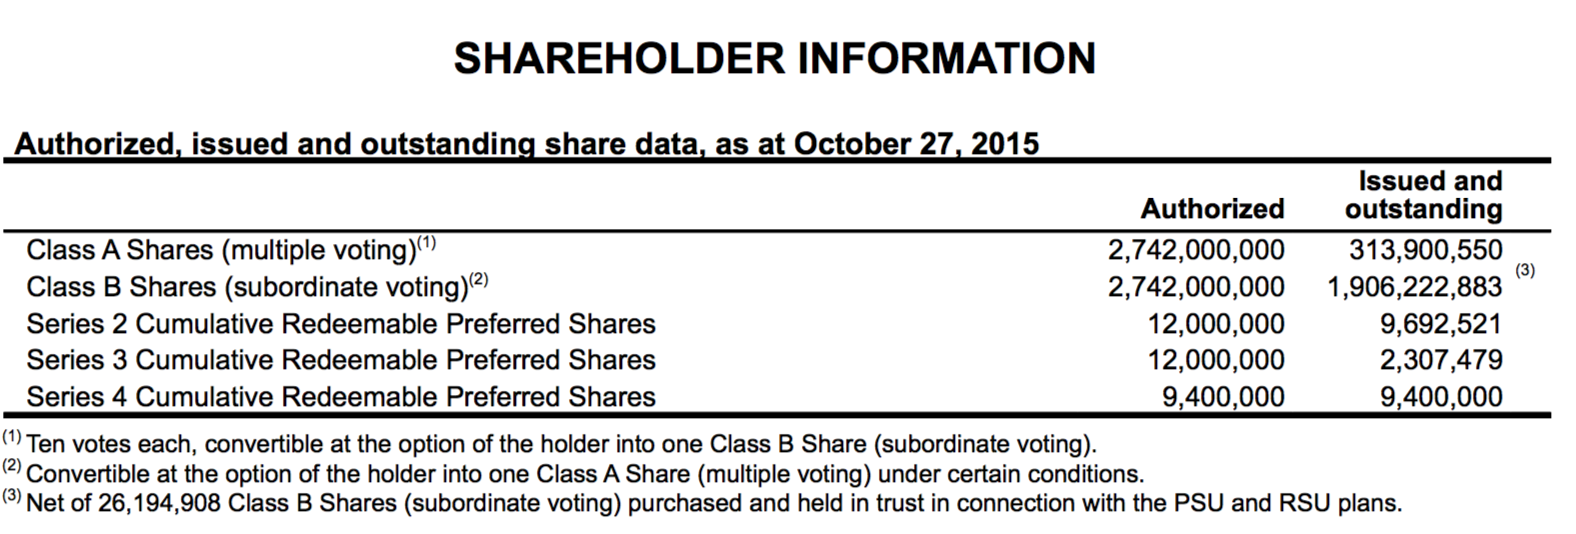
Bombardier has 3 types of preferred shares: Series 2, 3, and 4. In order to calculate the dividend and share price we used the weighted average based off the number of shares outstanding as of October 27, 2015.
Total of Preferred Stocks Outstanding= 9,692,521 + 2,307,479 + 9,400,000 = 21,400,000
Weight of Series 2: 9,692,521/ 21,400,000 = 0.45
Weight of Series 3: 2,307,479/21,400,000 = 0.11
Weight of Series 4: 9,400,000/21,400,000 = 0.44
Price = 5.70(0.45) + 6.75(0.11) + 12.45(0.44) = 8.79 USD = $10.43 CDN
Dividend = 0.6756(0.45) + 0.7835(0.11) + 1.5625(0.44) = $1.08
The cost of preferred shares is equal to the dividend per preferred share divided by the market price per preferred share.
Kps = Dividend/Price= 1.08/10.43 = 0.10
No convertible bonds were mentioned on the balance sheet so we assumed Bombardier has not issued any or does not have any issues outstanding at this time.
Cost of Capital
Market Value of Equity
The prices per share and number of shares outstanding were taken from the Google Finance listing of Bombardier’s historical prices and balance sheet as of September 30th and converted to CDN using exchange rate: 1.339 per USD[LV1]
MV of Equity = Price per Share x Number of Shares Outstanding
= 2.24(2,220.12 M)
= 4,973.07 M CDN
We came up with a market value of equity for Bombardier of $4,973.07 million.
Market Value of Debt
To estimate the market value of debt we used the book value and the current cost of borrowing method with the following equation:
MV of Debt = Interest Expense (1/r – 1/r(1+r)n) + FV/(1+YTM)n
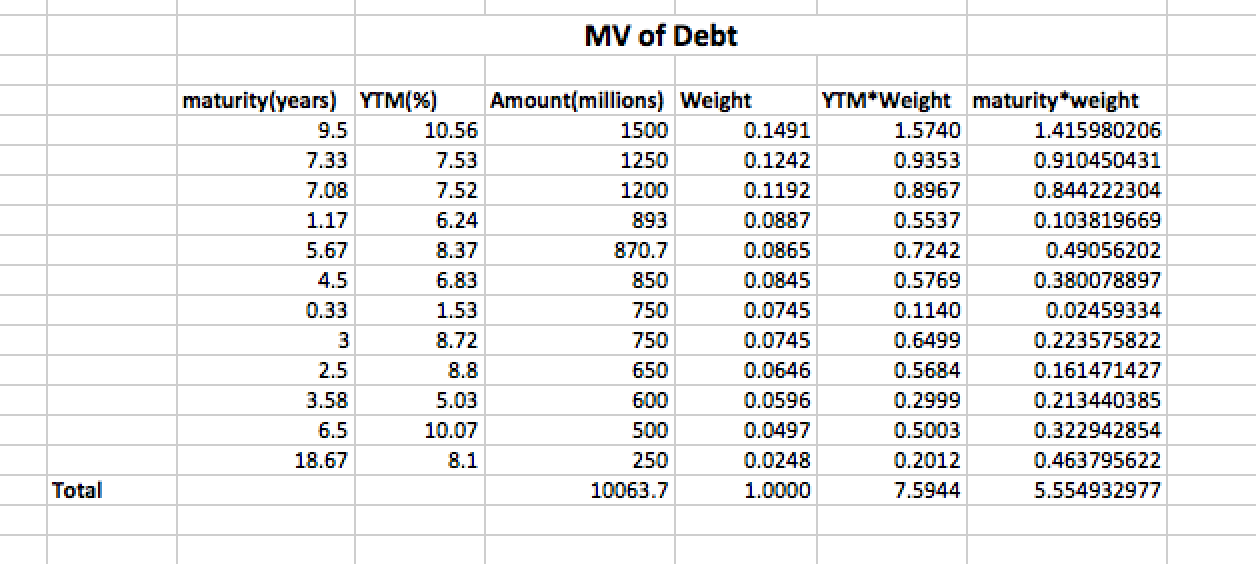
Interest expense is $500 million based off Bombardier’s third quarter earnings report. Using excel we took the bonds listed for Bombardier on Morningstar.com and found the weighted average yield to maturity and time to maturity, which are 7.59% and 5.55 respectively. Using a financial calculator we calculated the future value as $9 100 million. From here we used the equation above to calculate the market value, which came to approximately $8 262 million.
MV of Debt = 500M(1/0.075 – 1/0.0759(1.0759)5.55) + 9,100M/(1.0759)5.55
= $ 8,261.61 million CDN
MV of Preferred shares
The market value of preferred shares was listed on Google finance under Bombardier’s balance sheet as $464.63 M CDN.
The sum of the market values of debt, equity, and preferred shares is 13,663 M.
Total MV = 4,937.07 M + 8,261.61 M + 464.63 M = 13,663.31 M
The weights of each component are as follows:
We = 4,937.07/13,663.31 = 0.36
Wd = 8,261.61/13,663.31 = 0.60
Wps = 464.63/13,663.31 = 0.04
To calculate the weighted average cost of capital (WACC), we used the weights and costs of debt, equity and preferred shares calculated above, and a 38% tax rate.
WACC = KeWe + KdWd(1-T) + KpsWps
= 0.0792(0.36) + 0.075(0.6)(1-0.38) + 0.1(0.04)
= 0.0307 + 0.0279 + 0.004
= 0.0604 or 6.04%
The value we came up with for the cost of capital is 6.04%
= 0.0307 + 0.0279 + 0.004
= 0.0604 or 6.04%
Measuring Investment Returns
Projects
The company is a leader in aircraft and train manufacture. Since these projects are long-term and capital intensive, Bombardier must offer products globally in order to recoup the costs and more importantly, make a profit. The projects are divided according to the organization of the firm and thus can be segmented into two sections; Aerospace and Transportation projects. Aerospace is further divided into 5 sub-sections; Commercial Aircraft, Business Aircraft, Aerostructures and Engineering Services, Amphibious Aircraft and Specialized Aircraft.
Bombardier’s projects come in a large range including the manufacturing and servicing of large business and commercial aircraft, design of complex materials, aftermarket components repair, locomotive manufacturing and more. A typical project includes research and design of an airplane or train, testing it in the market and eventually marketing it to potential clients. After that, the company continues servicing orders, completing repairs or providing engineering services for the project until it is retired. It is also important to note that once an order has been placed, it takes a couple of years before Bombardier can deliver the goods resulting in significant order backlogs for the company.
An example of such a project is the C-Series commercial aircraft, a 100 to 150 seat passenger airplane. Development took two years and involved several postponements before completion. Even then the company did not receive any orders right away but had to wait a couple months. This is normal in the aviation manufacturing business.
On the other hand, Bombardier’s rail transportation division is currently more in demand with governments from Europe, Asia-Pacific and the North America providing the bulk of orders. Current projects for Bombardier include regional and commuter trains for the United Kingdom, double-deck trains in France, operation and maintenance contracts in the United States and freight trains in India.
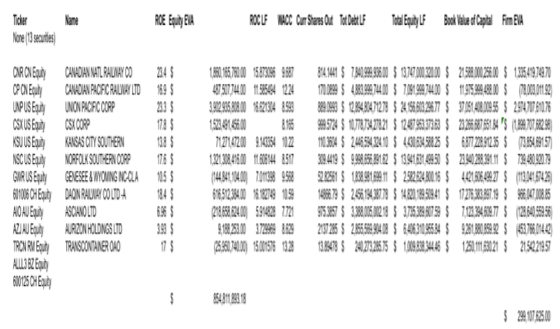
The calculations below show that the firm has significant Economic Value Added for its investments.
To analyze the returns of these projects we calculated Bombardier’s Return on Equity (ROE) and Return on Capital (ROC) compared to Bombardier’s WACC and Ke that was calculated previously in the report.
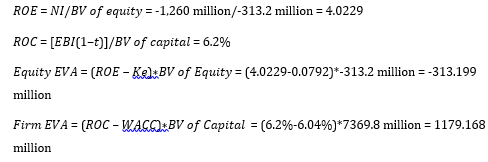
From the 2014 report, the net income is $(1,260 million). In addition to that, the Book value of per common share was $(0.18) total number of shares is 1740 million, therefore BV of equity is -313.2 million. The BV of capital = BV of equity+ BV of interest bearing debt, which is -313.2 million + 7,683 million = 7369.8 million. EBI = -740 million. Therefore, [????????????(1−????)] = -740 million (1- 38%) =-458.8 million. This brings ROC as -458.8million /7369.8 million = -0.062 = 6.2%.
Future Projects
In its 2014 report, Bombardier stated the company is at the end of an investment cycle, indicating that they should generate higher returns on their projects soon.
Since Bombardier is the leader in its industry which has high barrier of entry due to the intensive capital requirements and expertise needed, Bombardier’s return on capital should remain positive as the company expects to focus operations on new growth areas of the aero structures business as explained in 2014 annual report. This is expected as demand in the future will be driven by an increase in urban populations, infrastructure maintenance and demand for travelling. Bombardier is continuously innovating its products, spending % and will therefore maintain demand and it is predicted that the company is expecting US$159 billion worth of upcoming opportunities for new high speed train projects.
Capital Structure Choices
Current Financing Mix
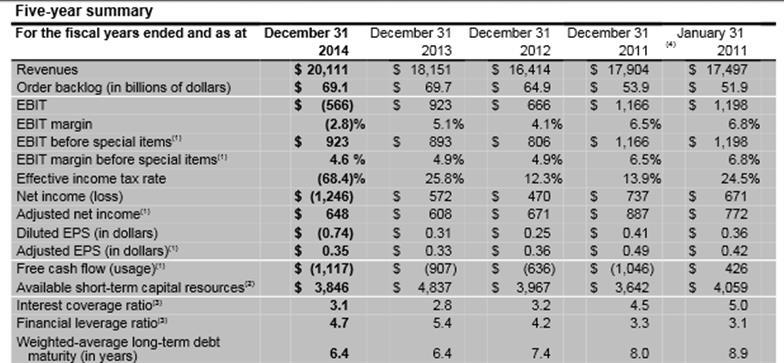
The 2014 financial statement for Bombardier shows that the company is using long-term debt of $1.5 billion and will access capital markets for equity of approximately $600 million. This will generate significant cash flows that are important for Bombardier’s operations. The company has several orders that must be completed for it to continue to earn revenues, and having capital helps to provide necessary money for operations to complete the order. Thus, its debt is important for handling the $69.1 billion manufacturing backlog that represents about three years of Bombardier’s revenue. The backlog represents 36.6 billion for Bombardier Aerospace and 32.5 billion for Bombardier Transportation.
Tax Advantage
The company has relied on long term debt financing as source of capital. This has the effect of allowing the company to defer taxes on that would be charged on it market value of debt that stands at 8,261,610,000 Canadian dollars.
Discipline Advantage
It has a strong financial discipline. The annual report for 2014 shows that the company’s management monitors liquidity levels, including available short-term capital resources and cash flows from operations. It does so to meet expected requirements. Management also considers the support of product development initiatives as requirements. Thus, the company has a discipline advantage that will allow it to continue enjoying financial flexibility.
Bankruptcy Costs
Possibilities of defaulting on debt increased as the company raised more financing through debt in 2014. It relied on refinancing to gain additional liquidity of 0.5 billion as reported in the 2014 annual report.
Agency Costs
Stockholders will be experiencing increased agency costs as company continues to refinance its debts as a way to gain additional liquidity. However, liquidity is also helping the company reduce its backlog and unlock revenues from sales.
Financial Flexibility
Other than raising new debt, Bombardier has focused more on refinancing its existing debt. This shows that it does not have too much engagement in overall debt market and can still exercise the option to raise more funds in future. It is also taking the debt capital market advantages in different countries.
Trade-Off Analysis
The company has a strong financial discipline. It management ensures that choices are appropriate by first using scenario analyses to stress-test cash flow projections. It also checks, historic volatility and seasonal needs, the maturity profile of long-term debt, the funding of product development programs, the level of customer advances, working capital requirements, the economic environment and access to capital markets as important factors for evaluating debt financing potentials. Refinancing has also ensured that the company is able to defer its debt obligations to maintain liquidity, thus, the advantages of its current debt structure outweigh its costs.
Optimal Capital Structure
Reasonable Constraints
The company needs to continue focusing on long-term growth, and this requires prudent management of funds. Its current limitation in cash flow has ensured that management prudently manages resources to sustain company operations. The company faces a high risk of cost overruns that affects its revenue projection and increases its cash flow problems. Besides that, the number of projects handled by the company is very many compared to its competitors. If the company does not get enough orders for its current projects, it will have to reschedule most of its debt payments.
To prevent the scenario, the company should maintain the current debt ratio, which is 1.67 for debt to capital ratio. The net income of the company has been slightly falling in the past few years due to increased costs of capital that eat into increased revenue. Thus, to maintain profitability, the company has to reduce its cost of capital relative to the overall capital base. Assuming the present business forecasts are obtained, the company will increase its revenues and maintain project costs at present values. Thus, it will be able to improve its position regarding debt, if the debt remains at the present ratio
Rating Constraint
Increased debt from the current levels amid income stagnation due to delays in current projects will lead to lowering of credit ratings of the company. If this happens, cost of debt will be significantly higher for the company. Thus, it must first seek new ways of increases cash flow and revenue with the current liquidity before seeking more debt.
Sensitivity Constraint
The company operations and debt uptake as forms of capital acquisition affect its share price. Production challenges are also very critical to the reputation and external environment reception of the company is very critical. Therefore, management has a limited avenue for exercising its freedom of increasing debt. The 2014 annual report shows that for investments in foreign operations exposed to foreign currency movements. It expected a 1% fluctuation of the relevant currencies as at December 31, 2014 would have impacted equity by 11 million dollars. This would happen before the effect of income taxes, by $11 million.
Relative to Sector
The company’s debts exceed those of the sector. The plane and train manufacturing business are not very rosy, which demands use of debt as projects take the time to convert into revenue streams. The plane and train manufacturing sector is capital intensive and requires heavy initial investments and operation costs before firms can recoup their investments. As a result, train manufacturers must turn to credit markets to get debt and fund their capital intensive activities.
A minor change in the credit markets is also a reason that can lead to significant additional overhead costs for companies like Bombardier, causing them to incur additional debt. Companies like Airbus and Boeing has been cutting their supply chain costs to keep up with their cash flow problems. Other than cutting supplier costs, Bombardier has been accepting cost overruns for its projects, leading to a problematic cash flow position that warrants higher debt financing for its operations.
Relative to Market
The company has too much debt relative to the market. Many investment analysts are advising investors to hold on to their position in the company, and this has been the position held since January 2014. The fundamental financials of the company have not changed but earlier forecasts that the company was going to outperform the market did not materialize. If present conditions do not change, and the company continues incurring cost overruns for its projects, then it will have to lower its forecasts for investment earnings and jeopardize its position for using equity to finance its capital requirements.
Its share price has slipped 68.78% throughout the year, which is an indication of the market’s reaction to the current capital structure of the company. Too much debt will increase the risks for the company and jeopardize its future forecast. Already the company has committed its three-year revenue equivalent to long-term debt, which highlights the possible time that investors have to wait for full returns as explained in the 2014 financial statement for Bombardier.
Summary
The company is enjoying tax deferment advantages by relying on debt refinancing to increase its liquidity. It faces constraints of sensitivity and rating but is fairly safe from bankruptcy. Management shows high discipline for managing debt financing choices.
Mechanics of Moving to the Optimal Structure
The company maintains a financial covenant for its revolving credit facilities that peg management actions on predetermined minimum levels of EBITDA and a fixed charges ratio. Failure to honor covenants results in default, thus, these serve as mechanism for returning the company to its optimal structure.
Dividend Policy
According to 2015 quarterly reports, Bombardier has announced that they will be suspending the declarations of dividends until further notice. The Board of Directors concluded that reinvesting the corporation’s free cash flow is more beneficial as opposed to distributing dividends.
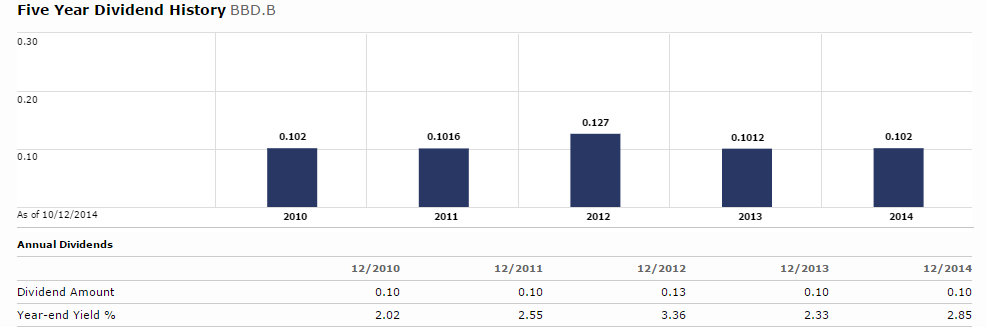
The excess cash flow will be applied to strengthening the corporation’s financial structure and investing in its core programs and businesses. In order to fund these expenditures and access new capital markets, Bombardier has issued equity for approximately $600 million increasing the outstanding shares from 1,892,000,000 to 2,742,000,000. Bombardier has a history of declaring a consistent dividend payout ratio throughout the years as displayed in the graph below, maintaining a $0.10 annual dividend from 2002 with an average yield of 2.62%.
In addition, Bombardier’s dividend ratio is higher than 59% of companies in the Global Aerospace and Defence industry. According to the Peer Group Analysis this implies that Bombardier’s dividend policy is optimal. However, due to the high volatility in the industry and Bombardier’s mature life cycle the Peer Group Analysis proves to be an inaccurate analysis.
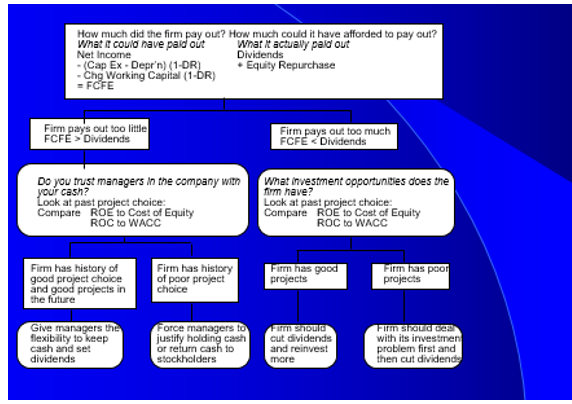
In order to assess the dividend policy effectively, the Cash Assessment was applied. According to the company’s negative Free Cash Flows to Equity (FCFE) it is evident that Bombardier should have retained their dividends. The FCFE measures how much cash remains after all debt and preferred holders have been paid, and after any reinvestments were required to maintain the company’s assets.
It would have been more beneficial if Bombardier cut dividends and reinvested in potential projects as total dividends were greater than FCFE. In 2015, Bombardier finally decided to suspend dividends. Investors seemed to respond positively, evident in the slight increase in share price, implying that investors trust the new management decisions. However, assessing the share price is not the most practical as the low share prices attract many day traders, thus increasing volatility. In general, the dividends suspensions sent a positive signal to investors about the company’s growing investment opportunities.
In General,
Net Income
- + Depreciation & Amortization
- – Capital Expenditures
- – Change in Non-Cash Working Capital
- – Preferred Dividend
- – Principal Repaid
- + New Debt Issued
- = FCFE
Compare to Dividends (Common)
- Stock Buybacks
- Compare your firm’s dividends to its FCFE, looking at the last 5 years of information.
- Based upon your earlier analysis of your firm’s project choices, would you encourage the firm to return more cash or less cash to its owners?
- If you would encourage it to return more cash, what form should it take (dividends versus stock buybacks)?
Valuation
The valuation is provided in Canadian Dollars (CAD). The exchange rates used throughout the valuation calculations were an average of the given year’s exchange rate (USD/CAD). Please see the Table of Exchange Rates.
To ensure the correct valuation the right valuation model must be used. All discounted cash flow models are founded on estimating four inputs: current cash flows, an expected growth rate in these cash flows, a point in time when the firm will be growing at a rate it can sustain forever, and a discount rate used to discount these cash flows (Damodaran, 2015). Furthermore, when valuing the firm it is important to consider whether the firm has non-operating assets and if so, it is critical to include them in the valuation; otherwise the firm will be undervalued. Bombardier does not have any non-operating assets. This valuation was based on the year-end 2014 as this is the most recent fiscal year.
This report uses the Free Cash Flows to the Firm (FCFF) model and concludes the value of Bombardier to be $52692.41 million.
The model used to analyse Bombardier is the Free Cash Flows to the Firm (FCFF) discount model as it provides a practical, conclusive analysis. Practically, estimating FCFF is less difficult and most often used in practice as the cash flows are pre-debt cash flows and are unaffected by changes in financial leverage, as they do not consider the firm’s capital structure (Damodaran, 2015). It is important to note that, with evidence from Bombardier’s 2014 Annual Report, Bombardier had a negative effective tax rate in 2014 of -68.4%. This valuation will firstly calculate the value of the firm and then subtract the market value of debt to provide an equity value.
The formula used to calculate the FCFF was:
FCFF = EBIT(1-T) + Depreciation – Capital Expenditure – Changes in Working Capital
Growth Pattern
It is assumed that the company will experience growth momentarily, before dropping and stabilizing in its growth. It is assumed that Bombardier will experience a substantial period of high growth as there are high barriers to entry, and there is political support behind the firm; these characteristics inspire a longer high growth period than would be assumed for a mature firm. However, due to its size and maturity the high growth period will be shorter than that of a new, smaller firm. Therefore, it is concluded that Bombardier will enjoy a high growth period for 5 years.
The growth rates should be consistent with the cash flows used (Damodaran, 2015). The operating earnings growth rate is most commonly used when analysing the FCFF. A proposition of firm valuation is that no firm can expect its operating income to grow over time without reinvesting some of its operating income in net capital expenditures and/or working capital. This is reflected in the below formula:
g = Reinvestment Rate * ROC.
However, as Bombardier has been experiencing financial difficulty the growth rate in operating earnings is not the optimal growth rate for this valuation. As Bombardier is an airplane manufacturer it would be appropriate to assume that it would have a high reinvestment rate due to the need for Bombardier to finance new projects. Withal, as Bombardier is a mature firm its preference of financing would be retained earnings.
However, due to its current financial situation Bombardier have an average negative reinvestment rate. Therefore, it was advised to calculate the growth rate in revenues to provide a more conclusive, justified valuation for this report. Bombardiers growth rate – which is an average of the past 4 years’ revenues – for its high growth period is 7.72%.
Moreover, the average GDP growth rate in Canada during the period 2011-2014 was 2.35% (World Bank, 2015). As Bombardier is a mature firm it is assumed that it should not generate a growth rate greater than the economic growth rate of 2.35% when it reaches its stable growth rate. Therefore, the growth rate used for the stable period is 2.35% as it is assumed the firm will grow with the economy.
These growth rates illustrate fundamental assumptions within the valuation and will be discussed further in section 9.4 Key Variable.
Value of the Firm
Bombardier is valued at $52692.41m: the present value of the FCFF, discounted using the WACC, plus the present value of the terminal value, also discounted using the WACC. As the formula’s below shows:
Vf = Σ n, i=t[FCFFi/(1+rwacc)i] + [TV /(1+rwacc)n]
(TV = FCFF n+1/ (rwacc – g)n = [FCFF * (1+g)] / (rwacc – g)n])
The WACC was used as the discount rate as the use of the cost of equity would have undervalued the firm: the cost of equity is less than the weighted cost of capital. The WACC used was the wacc provided in section III. It is assumed Bombardier has an indefinite life and therefore to apply closure to the valuation, the terminal value is calculated to reflect this assumption. Bombardiers Present Value of its FCFF in its high growth phase is $12591 million and its Present Value of its Terminal Value is $40101 million.
Value of Equity
The choice between FCFE and FCFF is a choice between valuing equity and valuing the whole firm, however, both should yield the same values for equity in a business if done correctly (Damodaran, 2015). Discounting dividends provides the most conservative estimate of value for equity in the firm because most firms pay less in dividends than they have to (Damodaran, 2015). Therefore, it was discarded as a choice for this valuation.
The analysis would suggest Bombardier is significantly undervalued. This report calculates Bombardier’s EPS to be $25.60. It is important to note that current financial analysts and reports have calculated a negative EPS for Bombardier. Due to the advised assumptions for this report the value provided assumes that Bombardier does have an indefinite life and that a negative EPS is not possible. Inevitably, the assumed values of growth within this report may be overestimated which would create the high value for the firm.
Key Variable
The fundamental variable in this analysis is the growth rate. The growth rate is critical to a sound analysis as it is the most significant factor in estimating the future FCFF. Due to Bombardier’s current financial situation an operating growth rate was not useful to this analysis. Therefore, it is concluded that the growth rate is the most important aspect of the valuation. By using a growth rate in revenues it allowed two-stages of growth to be analysed. Therefore, it is important to be aware that by using a different growth rate the value of Bombardier would be significantly different.