Amazon
Company Performance
Amazon is among the top online retailers as well as one of the highest-earning e-commerce aggregators with three hundred and eighty-six billion dollars in net sales. It also has approximately five hundred and seventy-eight billion dollars in digital online and physical gross merchandise volume in 2021. During a time, many companies especially the ones in the retail business had to close most of their operations, the company experienced immense growth since it catered for the needs at the time. The pandemic forced many countries and governments to set restrictions that affected businesses. People could no longer go out and buy products or services as before to avoid the infection mainly by contact. Since the firm sells its items online, it was easier for many individuals to turn to them for their various needs. Retail associated revenue depicts approximately eighty percent of total, followed by Amazon Web Services’ cloud storage, computing, database as well as other offerings. Global segments comprise of twenty-five to thirty percent of the company’s non-AWS sales led by the United Kingdom, Germany plus Japan.
The company reported a relatively modest eighteen percent in sales in North America for 2021 which is a rare below-twenty percent rise. Sales gains of about nine percent in the last quarter fell short of the anticipations and dragged down the whole year total. However, there was still lots of great news for the firm which for another time was the leader in market share in the United States online retail. Its net income for the year increased by fifty-six percent to over thirty-three billion dollars, in great measure due to an increase of almost twelve billion dollars in the organization’s stake in electric car-maker Rivian.
Amazon also declared that it would increase the yearly subscription price for its Prime loyalty program to one hundred and thirty-nine dollars from one hundred and nineteen, a twenty-dollar raise. The monthly fee is also increased to fifteen dollars from thirteen dollars. This is the first time since 2018 that the company announces a rise. If it were not for the vehicle manufacturer’s gain, the firm’s profit would have been flat for the year as the costs increased greatly in multiple areas. In 2021, the company’s fulfilment charges rose twenty-eight percent year over year to seventy-five billion. Expenditure on technology as well as content increased by thirty-one percent to fifty-six billion plus marketing costs rose forty-seven percent to thirty-two billion.
The increase in revenue in North America including the company sales of merchandise it owns, advertising income and fees from marketplace sellers recorded a twenty percent rise for the first time in a while. The increase in revenue in North America including merchandise sales, advertising income, and fees from marketplace sellers rose by about twenty percent for the first time in many years. Nevertheless, in 2021 in the United States online retailing, the company took market share. The total value of goods usually referred to as GMV sold to the consumers in the country rose by seventeen percent in the same year o three hundred and sixty-four billion. The digital retail sales only increased by fourteen percent.
In 2021, due to the above-market growth, the company’s share of United States retail ecommerce increased to forty-two percent from forty-one percent in the previous year. The firm accounted for about fifty percent of the country’s online retail growth last year. One of the bright spots for the organization is the constant increase in revenue it obtains from third-party sellers on its web marketplace. The services, for instance commissions charged on sales as well as fees from Fulfillment by Amazon, rose by thirty-three percent to one hundred and seven billion dollars.
Ratio Analysis
Amazon company’s gross profit margin ratio decreased from 2019 to 2020 and then showed an increase from that year to the following in 2021, a figure that exceeded that of two previous years ago. The above margin is important in ratio analysis since it indicates a percentage of revenue that is available to cover for the operating as well as other expenses. Its operating profit margin ratio rose from 2019 to 2020 and then decreased even a little further from 2020 to 2021 and failed to reach the level set in 2019.
The net profit margin ratio showed an improvement from 2019 to 2020 plus from that year to 2021. Return on Equity, which is similar to the profitability ratio computed as net income divided by the equity of shareholders, saw an increase from 2019 to 2020 and even the following year. Return on Assets which is same as the profitability ratio computed as net income divided by total assets, witnessed an improvement from 2019 to 2020 as well as from 2020 to 2021. Amazon has grown so much especially in the recent years and the main reason is due to its ratio analysis impressing different investors in the online retail business. Many people are drawn to the company and desire to partner with the firm.
Honda
Company Performance
The company has been growing for a long time and continues to do so due to its efforts towards improving its vehicles and thus the lives of people buying them. Many businesses wish to generate huge profits without focusing on the client who is the one enabling the growth of the business. For instance, a car manufacturer is supposed to think towards the direction of sustainability. Companies that have failed to do have had to pay a steep price. For example, Volkswagen which was a top car manufacturer in the past failed to maintain that position as it was discovered to lie to the public concerning its cars’ emissions. Honda is moving in a different direction and the customers have noticed that.
The firm records a score of about 7 out of 20 on performance versus a well below two-degree pathway. The mark is lower than what it recorded in 2019, that is 10.2, when it was examined against the less ambitious two-degree pathway. The company clearly reports the particular amount it spends on low-carbon study as well as development. This is an unusually high plus transparent level of disclosure and suggests that its score in this area has increased since the previous time. Its R&D spend is same as seventy percent of capital expenses greatly going above the five percent edge for low-carbon R&D spend deemed as necessary for the low-carbon transition. This makes the company a leader in this area of examination.
Since 2014, Honda has reduced manufacturing emissions by 0.2 tons per vehicle. It plans for two-thirds of its cars to be electric in eight years to come. There will also be manufacturing of battery electric vehicles as well as plug-in hybrids to consist of fifteen percent plus traditional hybrids fifty percent. The BEVs are most preferred since they produce less emissions. A focus on traditional hybrids will make it hard for the company to accomplish emissions decrease in line with its well below the two-degree pathway. It lacks a science-based target, as suggested by (Belhadi et al., 2021). It however has set combined targets for both scope 1 as well as 2 emissions plus scope 3 emissions together but it is hard for outside examiners to assess and audit consolidated targets. The firm can become better by setting up a science-based target program. It needs to also share scenario evaluation plus stress testing outcomes as well as extend its low-carbon planning beyond ten years from now. Furthermore, the low-carbon vehicle share of 0.3% is way below the level needed by its de-carbonization pathway. The firm does not do much to offer incentives to customers in efforts towards switching to low-carbon cars plus no evidence of other business models to help its transition.
Ratio Analysis
Honda records a price to free cash flow of 14.07 as compared to 204.32 for industry average. This type of ratio is a stock valuation indicator that checks for the value of the stock price relative to operating cash flow per every share. Similarly, to price to earnings ratio, the lower the mark, the better. This suggests that the company is at a good place in the car manufacturing business. The ratio also supports the positive company performance data above. It is important that companies follow the direction Honda has taken in its operations. For instance, choosing to pursue sustainability has helped the company gain a positive reputation among customers and even governments of various countries. Every individual wants to associate with a good image and it is why many countries allow the organization to start a plant in their land.
Looking at expansion efforts and vision by the firm, it is clear that Honda will most certainly achieve more and gain a larger market as compared to other car manufacturers. Global warming has become an issue that every country is encouraged to tackle using various measures. Vehicles that emit less harmful substances to the atmosphere are allowed more freedom than others. For instance, as mentioned earlier, Volkswagen was fined for producing cars that emitted very harmful particles in the air. This allowed a chance for other manufactures to sell their cars to take up the space left in the market. Apart from causing harm to the environment, these cars can also harm people’s health. The World Health Organization is working closely with governments of various countries to ensure that people’s quality of life is improved. This means that soon only vehicles from companies such as Honda and others that produce similar vehicles will be allowed on the roads.
Lastly, the price to cash flow ratio not only supports the notion that the customers have accepted the company as a safe bet but also the investors have approved its stocks. An investor is interested in spending money on stocks that guarantee safety and where they see more growth in future. For instance, Honda plans to have electric cars by 2030 which is revolutionary in the automotive industry. This means that whoever partners with the company now stands a chance to benefit much in future.
Volkswagen
Company Performance
In spite of a difficult year in the automotive industry regarding sales, the world’s second biggest car-maker managed to withstand the pandemic mainly due to a rapidly recovering Asian market. This is, especially the Chinese market, the biggest market globally. Also its success can be attributed to the healthy demand for its luxurious vehicles. The company has faced many issues in the last decade including the scandal that claimed it lied about its mechanism of cleaning diesel. In an attempt to become a top seller of vehicles in the world market, the organization advertised new models whose main feature was having an engine that cleans the NOx particles before emission. After several tests by various agencies in the United States, it was discovered that the company misinformed the public and were fined heavily (Secinaro et al., 2020). The matter ruined its reputation as many people were made aware of the level of damage the particles from the cars could cause.
Parents, especially, with children who had previously suffered from such emissions campaigned against purchase of the brand’s vehicles. This led to a drop in sales especially in markets such as Europe and the U.S. Additionally, in the wake of the COVID-19 pandemic, the company similarly to others in the same industry lost a significant portion of its market. Despite all this, the firm has still maintained great figures in the market in comparison to others. Outcomes from the third and fourth quarter of 2020 were stronger, plus the firm continued with the momentum into 2021. Regarding figures, whereas Volkswagen managed to earn about eleven billion dollars in profits, sales revenue went down twelve percent to around two hundred and sixty-seven billion dollars.
The unit sales dropped by sixteen percent to nine million vehicles, surrendering the spot for the top car manufacturer in the globe to Toyota. What is even more stark is the comparison to the company’s performance in 2019 showing a thirty-seven percent decrease from the previous year. The fiscal outcome currently is by far better than initially anticipated plus shows what the firm is able to accomplish particularly during a crisis. It is the intention of the organization to sustain the strong momentum from the more significant second half into the next year. The programs for decreasing the fixed expenses as well as in procurement will make the company more robust in the long-haul.
Ratio Analysis
For the three quarters that ended on the 30th of September last year, the company’s revenues improved by twenty percent to one hundred and eighty-six billion Euros. The net income that is applicable to common stockholders also increased from 1.38B to 10.87. The revenue reflects passenger cars segments increase of twenty percent to one hundred and thirty-two billion, and commercial vehicle segment rise of forty percent to twenty billion. Additionally, it reflects the fiscal services segment rise of twelve percent to thirty-one billion, Europe as well as other areas segment rise of seventeen percent to one hundred and nine billion.
The company’s price-to-earnings ratio stands at 5.23 which is slightly lower than that of the industry average which is 5.51. The dilemma of what a good or a bad P/E ratio looks like mainly depends on the sector in which a company operates. Some will record a higher average ratio whereas others lower. For instance, at the start of 2021, publicly sold broadcasting organizations had a mean trailing a P/E ratio of only twelve in contrast to over sixty for software firms. Majority of investors claim that it is better to purchase shares in firms with a lower ratio since it means that one is paying less for each of earnings that they receive.
In that regard, a lower P/E is similar to a cheaper price tag which makes it more attractive to many investors searching for a bargain. It is important that one remains cautious of how a company gained a low price-to-earnings ratio since some obtain that due to the business models declining which suggests that the bargain is not there. Volkswagen has a low P/E ratio which means that it can attract many investors showing that it is a good place (Belhadi et al., 2021). Apart from that, the company’s price to sales ratio is also slightly below the industry’s mark at 0.45. This metric is used for the purpose of valuation of stocks.
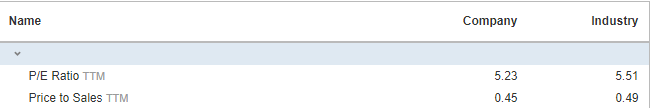
The one between one and two is assumed to be good whereas that less than one is great. As with every equity valuation metric, the P/S ratio can differ between sectors. It indicates how much an investor is willing to pay per every dollar of sales for a single stock. A low ratio implies that a stock could be undervalued whereas one that is greater than average suggests that it is overvalued. Looking at the mark set by Volkswagen, it is clear that its P/S ratio is slightly below the industry mean showing that investors are attracted to it. This allows the company to continue growing despite the harsh realities of the pandemic and bad reputation after the scandal.
Hyundai
Company Performance
In 2021, Hyundai Motor Company declared the business outcome for the last quarter of 2020. The revenue improved by about five percent over the whole of 2020 to KRW twenty-nine trillion. The firm sold one million, one hundred and thirty-nine thousand, five hundred and eighty-three units globally in the period between October and December which is a five percent drop from the previous year. Sales in markets out of Korea dropped by around six percent to more than nine hundred thousand units as the demand remained low in majority of markets around the Elantra sedan and gTucson. The G80 sedan as well as GV80 SUV of Genesis luxury brand as well assisted in boosting the sales momentum.
The company’s operating profit in the last quarter increased by forty percent from a previous year to KRW one and a half trillion with the margin reaching 5.6%. The figure is the greatest since the first three months of 2017. Net profit improved to KRW around 1 trillion from KRW seven hundred and seventy-two billion in the same duration. Strong sales of the SUV as well as Genesis luxury models and the declining incentives assisted increase revenue in the last quarter in spite of harsh economic times. Market share expansion as well as sales recovery in North America, Russia and India also led to more revenue. In 2020, the company’s international sales totaled to more than three million units, a figure that shows a fifteen percent drop from the previous year. The revenue decreased by almost two percent from 2019 to KRW one hundred and four trillion whereas the operating profit decreased by twenty-three percent to KRW 3 trillion. The net profit which includes non-controlling interest declined by thirty-three percent to KRW 2 trillion.
Ratio Analysis
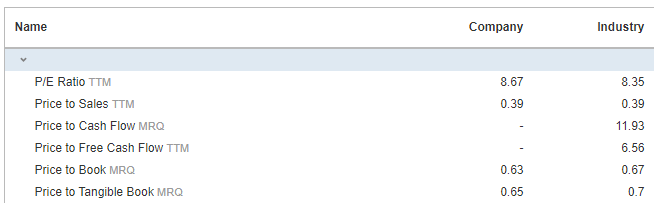
Hyundai has a price-to-earnings ratio of 8.67 which suggests that it is a mature company. Experts claim that a mature firm has a P/E ratio that falls between five and ten, moderate-growth organizations have one that is between eleven and twenty (Baynal, Sari & Akpinar, 2018). The last type is the aggressive growth firms that have one falling between twenty-one and forty. Others claim that the right mark relies on the sector and one needs to take the average price-to-earnings ratio in a particular industry to check if a firm is below or above such mean. This helps in determining whether the company is underpriced or overpriced. Recently, car manufacturing organizations are recording very low P/E ratios.
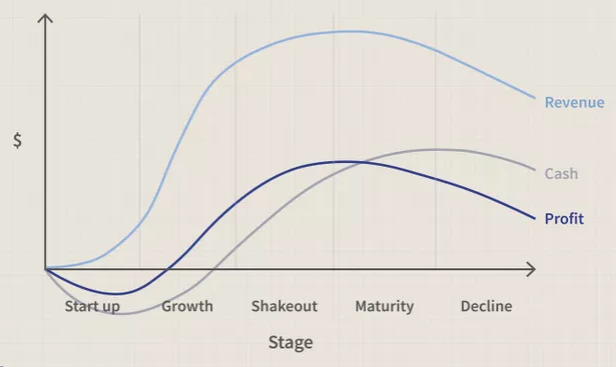
A mature company is one that has exceeded the emerging as well as growth stages of industry growth. They tend to be older, larger as well as more stable. Ultimately, growth is forecasted to slow as new innovative products or services replace already-existing offering plus start a new sector lifecycle. This stage usually starts with a shakeout duration, during which there is slow growth, focus changes towards reducing expenditure and consolidation happens. Some organizations accomplish economies of scale, thereby hampering the smaller rivals’ sustainability. As maturity is attained, hindrances to entry become greater, and the landscape of competitiveness becomes clearer (Baynal et al., 2018). Market share, profitability and cash flow become the main objectives of the remaining mature firms once growth is less essential. Price competition becomes much more relevant as the product differentiation drops with consolidation.
The company’s price-to-sales ratio stands at 0.39 which is similar to the industry average. It is important to note that this metric is used in valuation of a stock. An investor will easily be drawn to this firm’s stocks simply due to it not being undervalued or overvalued. This is based on the principle that a lower ratio in comparison to sector’s average always implies that a stock is undervalued while a greater one shows that it is overvalued. More investors mean that Hyundai is at a great position to expand as a car manufacturer in the automotive industry. Expansion is a venture that requires large capital which can be obtained from the new investments.
Hyundai has a price-to-book ratio that stands at 0.63 while the industry average is 0.67. This type of ratio is favored by value investors and widely utilized for market analysis. Conventionally, any value that is under one is interpreted as good which indicates that a stock is undervalued. The lower a firm’s P/B ratio, the better the value of its stock particularly when it is less than one. This means that Hyundai is attractive to investors since they will feel safe purchasing stocks from the company. This usually means that it trades for less than the assets’ value. Purchasing an organization’s stock for less than book value allows for safety for the investors. Nevertheless, a very low ratio might indicate trouble thus needs to be utilized as a component in the analysis of a stock. Similarly, to the P/S, this type of ratio can be useful especially for companies with negative or inconsistent earnings.
References
Baynal, K. A. S. I. M., Sari, T., & Akpinar, B. (2018). Risk management in automotive manufacturing process based on FMEA and grey relational analysis: A case study. Advances in Production Engineering & Management, 13(1). Web.
Belhadi, A., Kamble, S., Jabbour, C. J. C., Gunasekaran, A., Ndubisi, N. O., & Venkatesh, M. (2021). Manufacturing and service supply chain resilience to the COVID-19 outbreak: Lessons learned from the automobile and airline industries. Technological Forecasting and Social Change, 163, 120447. Web.
Secinaro, S., Brescia, V., Calandra, D., & Biancone, P. (2020). Employing bibliometric analysis to identify suitable business models for electric cars. Journal of cleaner production, 264, 121503. Web.