Nintendo and Sony Companies’ Financial Strategies

In order to predict the company’s financial performance and profitability during the next several years, it is important to focus on financial forecasting and develop pro-forma statements (Hillier, Clacher, Ross, Westerfield, & Jordan, 2014; Piper, 2010). The purpose of this paper is to demonstrate how pro-forma financial statements are used to forecast changes in businesses’ profitability, competitive advantage, and funding. Therefore, the paper presents pro-forma financial statements for Nintendo and Sony, the discussion of current strategies and future investments, and the ratio analysis.

Pro-Forma Financial Statements

The data provided in the U.S. Securities and Exchange Commission (SEC) 10-K reports for Nintendo and Sony are used to develop pro-forma financial statements for these companies. Appendix A presents the pro-forma statements (2016-2020) that are prepared for both companies with the focus on the certain assumptions. For Nintendo, it is possible to predict the tax rate in 25%. The interest rate will not change because the company does not depend on borrowings, but it is possible to increase the sales rate by 5% each following year due to the success of Mario Kart 8 and other games for Wii U (Nintendo, 2015). In addition, the launch of three new products is planned in 2017 to improve the company’s position in the market. For Sony, the interest rate is 30% because of the dependence on borrowings, and the sales rate will increase by 5% each following year (Sony, 2015).

Current Strategies and Future Investments

Nintendo actively develops the strategy oriented to the further global market expansion. The reason is that Nintendo has released successful products, and the company plans to enter new markets around the world. However, negative changes in the global market and the purchasing power of buyers can influence Nintendo’s liquidity and profitability. As a result, it is important to refer to investments while increasing the numbers related to global sales (Brigham & Houston, 2012; Moore, 2012). Overseas investors are planned to be attracted in order to reduce the impact of negative external factors and realize strategic plans regarding sales. Therefore, it is possible to expect the stable growth in the sales rate. The similar strategy is typical of Sony, but investors from the Asian region and North America are planned to be attracted in order to support the company’s production.

Ratio Analysis

While forecasting the future profitability of the company, managers also need to conclude regarding its potential liquidity and competitive advantage during the next five years. For this purpose, it is important to conduct the ratio analysis and calculate profitability, activity, leverage, and liquidity ratios for Nintendo and Sony as its competitor. The focus is on the data for 2016.

Profitability Ratio

To conclude regarding Nintendo’s future profitability, it is necessary to apply the formula for calculating Gross Margin Ratio (millions of yen): Gross Margin Ratio = Gross Margin/Net Sales.

Gross Margin Ratio for Nintendo = ¥202,044/¥577,269 = 0.35.

Gross Margin Ratio for Sony = ¥3,163,114/¥9,037,468 = 0.35.

The companies have equal gross margins projected for the end of 2016, and they are high enough in the context of the electronics (entertainment) industry. The next step is to calculate Return on Equity (ROE) following this formula: Profit after Taxes/Shareholders’ Equity.

For Nintendo, ROE = ¥81,633/¥13,029 = 6.2%, and for Sony, ROE = ¥169,728/¥37,510 = 4.52%. For 2016, it is possible to forecast the higher ratio for Nintendo because of increases in sales.

Activity Ratio

Activity ratios demonstrate how the company can use the available assets. Total Asset Turnover Ratio is calculated using the following formula: Total Asset Turnover Ratio = Net Sales/Total Assets.

For Nintendo, Total Asset Turnover Ratio = ¥577,269/¥1,362,958 = 0.4, and for Sony, Total Asset Turnover Ratio = ¥9,037,468/¥4,945,963 = 1.8. By the end of 2016, Sony will improve its approach to utilizing the assets, but more attention should be paid to managing assets in Nintendo in order to affect the ratio.

Leverage Ratio

The financial state of the company is determined with the focus on Total Debt Ratio that is calculated using the following formula: Total Debt Ratio = Total Liabilities/Total Liabilities + Market Value of Equity.

For Nintendo, Total Debt Ratio = ¥59,980/¥83,569 = 0.7, and for Sony, Total Debt Ratio = ¥12,178,180/¥12,122,787 = 1. By the end of 2016, Nintendo will be less dependent on loans than Sony because of the ratio.

Liquidity Ratio

Liquidity is measured with reference to Current Ratio that is calculated using the following formula: Current Ratio = Current Assets/Current Liabilities.

For Nintendo, Current Ratio = ¥1,276,958/¥47,980 = 26, and for Sony, Current Ratio = ¥2 345 751/¥661 708 = 3.54. According to the ratio, Nintendo will be able to meet the short-term obligations easily. The ratio for Sony will also increase in comparison to the previous years.

For both companies, Nintendo and Sony, it is possible to project positive changes in liquidity. As a result, the companies will become more competitive, and it is important to note that the position of Nintendo can improve in the market. Still, changes in profitability are predicted to be slow because of the specifics of strategies followed by Nintendo and Sony.

Conclusion

The pro-forma financial statements (2016-2020) were developed for Nintendo and Sony as the main competitors in the electronics industry. The perspectives for the future investments were analyzed for both companies. The ratio analysis demonstrates that Nintendo and Sony preserve the stable leading positions in the market with the focus on high liquidity ratios.

References

Brigham, E. F., & Houston, J. F. (2012). Fundamentals of financial management. New York, NY: Cengage Learning.

Hillier, D., Clacher, I., Ross, S., Westerfield, R., & Jordan, B. (2014). Fundamentals of corporate finance. New York, NY: McGraw Hill.

Moore, C. W. (2012). Managing small business: An entrepreneurial emphasis. New York, NY: Cengage Learning EMEA.

Nintendo. (2015). Annual Report 2015. Web.

Piper, T. (2010). Assessing a company’s future financial health. Harvard Business School Review, 91(11), 1-17.

Sony. (2015). SEC Report 2015.

Appendix A

Table 1. Assumptions for Nintendo.

Assumptions for Nintendo
Period Year 1 Year 2 Year 3 Year 4 Year 5
Interest Rate 10,00% 10,00% 10,00% 10,00% 10,00%
Tax Rate 25,00%
Sales Increase Rate 5,0% 10,0% 15,0% 20,0% 25,0%
Margin Percentage 35,0% 35,0% 35,0% 35,0% 35,0%

Table 2. Nintendo Balance Sheet Data.

Nintendo Balance Sheet Data
Year
2015 2016 2017 2018 2019 2020
Assets
Cash ¥612 936 ¥1 127 797 ¥1 175 340 ¥1 264 605 ¥1 655 679 ¥1 783 197
Receivables 534 706 55 355 60 890 70 024 73 525 80 877
Inventory 76 897 93 806 103 187 118 665 124 598 137 058
Total Current Assets 1 224 539 1 276 958 1 339 417 1 453 293 1 853 802 2 001 132
Plant Assets 91 488 110 000 150 000 160 000 160 000 160 000
Accumulated Depreciation 12 000 24 000 36 000 48 000 60 000 72 000
Net Plant Assets 79 488 86 000 114 000 112 000 100 000 88 000
Total Assets 1 304 027 1 362 958 1 453 417 1 565 293 1 953 802 2 089 132
Liabilities
Accounts Payable 58 460 35 980 39 579 45 515 47 791 52 570
Other Payables 12 000 12 000 12 000 12 000 12 000 12 000
Total Current Liabilities 70 460 47 980 51 579 57 515 59 791 64 570
Long Term Debt 13 000 12 000 11 000 10 000 9 000 8 000
Total Liabilities 83 460 59 980 62 579 67 515 68 791 72 570
Common Stock 811 223 812 000 812 000 812 000 811 000 811 000
Retained Earnings 409 344 490 977 578 839 685 778 1 074 011 1 205 562
Total Equity 1 220 567 1 302 977 1 390 839 1 497 778 1 885 011 2 016 562
Total Liabilities & Equity 1 304 027 1 362 958 1 453 417 1 565 293 1 953 802 2 089 132

Table 3. Nintendo Income Statement.

Nintendo Income Statement.

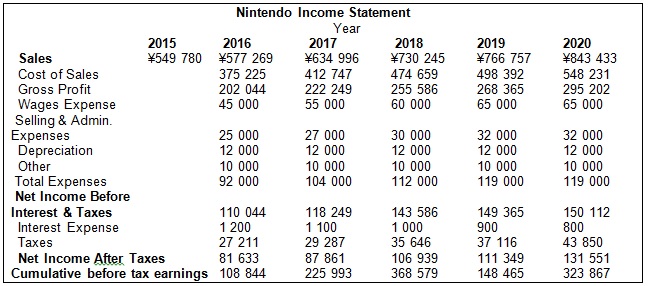
Table 4. Nintendo Cash Flow Statement.

Nintendo Cash Flow Statement
Year
2016 2017 2018 2019 2020
Sales ¥577 269 ¥634 996 ¥730 245 ¥843 433 ¥969 948
Change in Receivables 479 351 -5 535 -9 134 -7 352 -12 132
Cash From Sales 1 056 620 629 460 721 112 836 081 957 816
Cost of Sales 375 225 412 747 474 659 548 231 630 466
Change in Payables 22 480 -3 598 -5 937 -4 779 -7 886
Change in Inventory 16 909 9 381 15 478 12 460 20 559
Cash Cost of Sales 414 614 418 530 484 201 555 912 643 139
Cash Margin 642 007 210 931 236 911 280 168 314 677
Cash Wages 45 000 55 000 60 000 65 000 60 000
Selling & Administrative 25 000 27 000 30 000 32 000 30 000
Other 10 000 10 000 10 000 10 000 10 000
Net change in other current items 0 0 0 0 0
Total Cash Expenses 80 000 92 000 100 000 107 000 100 000
Net Cash From Operations 562 007 118 931 136 911 173 168 214 677
Income Taxes -27 211 -29 287 -35 646 -43 850 -56 620
Interest Expense -1 200 -1 100 -1 000 -800 -1 000
Investment and Financing Transactions
Sale of (Purchase) Plant -18 512 -40 000 -10 000 0 0
Issue (Retire) Longterm Debt -1 000 -1 000 -1 000 -1 000 2 000
Issue (Retire) Stock 777 0 0 0 1 000
Total Nonoperating Cash Changes -47 146 -71 387 -47 646 -45 650
Net Cash Increase (Dec) 514 861 47 543 89 265 127 518 160 057

Table 5. Assumptions for Sony.

Assumptions for Sony

Period Year 1 Year 2 Year 3 Year 4 Year 5
Interest Rate 30,00% 30,00% 30,00% 30,00% 30,00%
Tax Rate 35,00%
Sales Increase Rate 10,0% 15,0% 20,0% 25,0% 30,0%
Margin Percentage 35,0% 35,0% 35,0% 35,0% 35,0%

Table 6. Sony Balance Sheet Data.

Sony Balance Sheet Data.

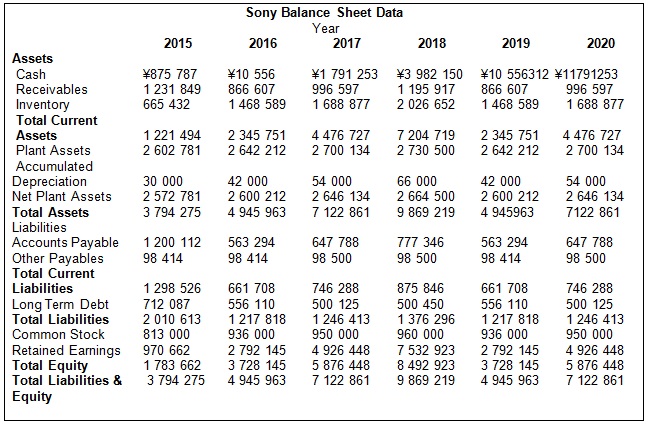
Table 7. Sony Income Statement.

Sony Income Statement
Year
2015 2016 2017 2018 2019 2020
Sales ¥8 215 880 ¥9 037 468 ¥10 393 088 ¥12 471 706 ¥15 589 633 ¥19 487 041
Cost of Sales 5 874 354 6 755 507 8 106 609 10 133 261 12 666 576
Gross Profit 3 163 114 3 637 581 4 365 097 5 456 371 6 820 464
Wages Expense 112 000 112 000 113 000 113 000 112 000
Selling & Admin. Expenses 50 000 60 000 60 000 60 000 60 000
Depreciation 12 000 12 000 12 000 12 000 12 000
Other 20 000 20 000 20 000 20 000 20 000
Total Expenses 194 000 204 000 205 000 205 000 204 000
Net Income Before Interest & Taxes 2 969 114 3 433 581 4 160 097 5 251 371 6 616 464
Interest Expense 166 833 150 038 150 135 166 833 150 038
Taxes 980 798 1 149 240 1 403 487 1 779 588 2 263 249
Net Income After Taxes 1 821 483 2 134 303 2 606 475 3 304 950 4 203 177
Cumulative before tax earnings 2 802 281 6 085 824 10 095 786 5 084 538 11 550 965

Table 8. Sony Cash Flow Statement.

Sony Cash Flow Statement
Year
2016 2017 2018 2019 2020
Sales ¥9 037 468 ¥10 393 088 ¥12 471 706 ¥19 487 041 ¥23 384 449
Change in Receivables 365 242 -129 991 -199 319 -373 724 -373 724
Cash From Sales 9 402 710 10 263 097 12 272 386 19 113 317 23 010 725
Cost of Sales 5 874 354 6 755 507 8 106 609 12 666 576 15 199 892
Change in Payables 636 818 -84 494 -129 558 -242 921 -242 921
Change in Inventory 803 157 220 288 337 775 633 329 633 329
Cash Cost of Sales 7 314 329 6 891 301 8 314 826 13 056 985 15 590 300
Cash Margin 2 088 382 3 371 796 3 957 560 6 056 332 7 420 425
Cash Wages 112 000 112 000 113 000 112 000 113 000
Selling & Administrative 50 000 60 000 60 000 60 000 60 000
Other 20 000 20 000 20 000 20 000 20 000
Net change in other current items 0 -86 0 0 -86
Total Cash Expenses 182 000 191 914 193 000 191 914 193 000
Net Cash From Operations 1 906 382 3 179 882 3 764 560 5 864 418 7 227 425
Income Taxes -980 798 -1 149 240 -1 403 487 -2 263 249 -2 740 298
Interest Expense -166 833 -150 038 -150 135 -150 038 -150 135
Investment and Financing Transactions
Sale of (Purchase) Plant -39 431 -57 922 -30 366 -57 922 -57 922
Issue (Retire) Longterm Debt -155 977 -55 985 325 -55 985 325
Issue (Retire) Stock 123 000 14 000 10 000 14 000 10 000
Total Nonoperating Cash Changes -1 220 039 -1 399 185 -1 573 663 -2 910 474 -2 513 194
Net Cash Increase (Dec) 686 343 1 780 697 2 190 897 3 351 224 4 316 951

Cite this paper

Select style

Reference

StudyCorgi. (2020, September 4). Nintendo and Sony Companies’ Financial Strategies. https://studycorgi.com/nintendo-and-sony-companies-financial-strategies/

Work Cited

"Nintendo and Sony Companies’ Financial Strategies." StudyCorgi, 4 Sept. 2020, studycorgi.com/nintendo-and-sony-companies-financial-strategies/.

* Hyperlink the URL after pasting it to your document

References

StudyCorgi. (2020) 'Nintendo and Sony Companies’ Financial Strategies'. 4 September.

1. StudyCorgi. "Nintendo and Sony Companies’ Financial Strategies." September 4, 2020. https://studycorgi.com/nintendo-and-sony-companies-financial-strategies/.


Bibliography


StudyCorgi. "Nintendo and Sony Companies’ Financial Strategies." September 4, 2020. https://studycorgi.com/nintendo-and-sony-companies-financial-strategies/.

References

StudyCorgi. 2020. "Nintendo and Sony Companies’ Financial Strategies." September 4, 2020. https://studycorgi.com/nintendo-and-sony-companies-financial-strategies/.

This paper, “Nintendo and Sony Companies’ Financial Strategies”, was written and voluntary submitted to our free essay database by a straight-A student. Please ensure you properly reference the paper if you're using it to write your assignment.

Before publication, the StudyCorgi editorial team proofread and checked the paper to make sure it meets the highest standards in terms of grammar, punctuation, style, fact accuracy, copyright issues, and inclusive language. Last updated: .

If you are the author of this paper and no longer wish to have it published on StudyCorgi, request the removal. Please use the “Donate your paper” form to submit an essay.