Financial ratios
Group one
The first group contains the returns on capital employed. It is a fundamental ratio that is used to assess the financial health of an institution. Return on capital employed is obtained by dividing operating profit and capital employed. It is a suitable measure of the profitability of an entity. Even though it is not adequate, it provides a good indication of how a business makes use of total resources to generate profit. A high value of return on capital employed is preferred at a low cost.
Group two
The second group is made up of liquidity ratios. The ratios measure the ease with which an entity can pay current liabilities using current assets. A sound financial institution should have adequate current assets that can quickly pay off current liabilities. The current ratio is obtained by dividing current assets and current liabilities. A ratio that lies between 1.5 times and 2.5 times is regarded as suitable.
On the other hand, the acid test ratio is a conservative ratio that measures the ability of a company to pay current assets. Acid test eliminates assets that cannot be quickly converted to cash, such as inventory from the existing assets. The resulting quick assets are divided by current liabilities to obtain the quick ratio. Apart from measuring the ability of a company to pay off current liabilities, the ratio also indicates how a company manages existing assets. An extremely high liquidity ratio could indicate that a company keeps a lot of money as liquid assets which might not be productive or that cannot be used to generate sales. Thus, corrective measures can be taken in such instances.
Group three
The third group comprises of turnover ratios. The ratios measure the efficiency of a company. Inventory turnover measures the number of times within an accounting period that a company replenishes its stock. A high turnover ratio is favourable. Accounts receivable ratio shows the efficiency of a company in collecting debts. A high ratio might indicate that a company operates on a cash basis. Accounts payable turnover measures the speed at which a company pays its creditors. A high accounts payable turnover ratio indicates that the company pays the creditors at a faster rate. Finally, the total assets turnover ratio measures the number of sales that are generated from a unit of the assets. A high ratio is favourable since it indicates that the company can generate many sales from each unit of assets. Thus, high-efficiency ratios are favourable and preferred.
Group four
The ratios in the fourth group measure the profitability of a company. Return on equity shows the amount of profit that is generated for each unit of shareholders’ equity. Return on total assets measures the amount of net income that is generated from each unit of total assets. Finally, operating profit margin measures the ability of the company to manage the cost of operating the business to generate an operating profit. Thus, the profitability ratios measure the ability of the company of a company to use resources available efficiently to generate profits. High profitability ratios are preferred.
Group Five
Earning per share is the ratio of total net income attributable to shareholders divided by the number of weighted average outstanding shares. Earnings per share is an indicator of a company’s profitability. High earnings per share indicate that the profitability of a company is high. Dividends pay per share shows the number of dividends paid per share. A high ratio of dividend pay per share is preferred to low ratios.
Group six
The sixth group measures the leverage of the company. Debt to equity ratio is a ratio of debt to equity. A high debt to equity ratio is not favourable since it shows that the company if highly levered. This might not be a good indication for a potential investor. Interest coverage ratio shows the number of times that interest can be paid from operating income. A high-interest coverage ratio is suitable since it shows that the company can pay for interest expense. Finally, gearing ratios also look at the leverage of the company. It focuses on the ratio of total assets to total equity.
Discussion of ratios for the entities
Middle State bank
As mentioned in the case, the bank is a potential debt provider. The bank would be interested in ratios in group six. These are debt-equity ratio, interest coverage and gearing. From the table, the debt to equity ratio of the company was high. It ranged between 1.37x and 1.41x. Besides, the ratios were above the industry average. The interest coverage ratios were high. They ranged between 3.70x and 6.80x. However, they were declining over the period. Besides, they were below the industry averages. The ratios do not show a good indication since the company is highly levered, and the company is also facing difficulties in paying interest expenses.
Another set of ratios that would be of concern to the bank is the profitability ratios. These are ratios in group four. The ratios for the company are low and declining. Further, they are below the industry average. The ratios do not portray a good indication of the financial health of the company. The two groups are vital for a potential debt provider would be interested in the trend of profitability.
Majestik Company
The supplier would focus on the efficiency of the company. These are the ratios in group three. More specifically, the supplier will focus on the inventory turnover and the accounts payable turnover. The ratios will show the number of times the company buys assets and how frequently the company settles accounts payable. This information is suitable for deciding on whether to interact with the company. From the data of the company, it is evident that efficiency ratios of the company are declining and below the industry average. The trend of the ratios is not suitable for a potential supplier. Also, a supplier would be interested in the profitability of the company. These ratios are in group four.
Investment trust
Ms Lisa Brown, the analyst, will focus on ratios in group five. The earnings per share will show the amount of profit that is attributed to each share. It indicates the amount of profit per share. The ratio is suitable since it will show the investor the profitability of each share in comparison to other companies. Dividend pay per share also shows how much a potential investor will earn periodically. The productivity of the shares and the earnings of the share is necessary when deciding to include the shares of Smart electronics in the new proposed portfolio. These two ratios are declining, and the shares are not suitable for inclusion in the portfolio.
The working capital management committee
The committee will focus on the return on capital employed. It is the ratio in group one. The ratio shows the profitability of capital employed. It shows the profitability of capital employed in the business. This ratio indicates how the company would efficiently use capital employed and working capital to generate returns. Another important ratio for the committee will be the efficiency ratio. These ratios will provide the underlying operational efficiency of the company in the management of capital employed and working capital.
Additional ratios for the entities
The ratios mentioned in the section above are fundamental in analyzing the financial position of the company. However, there are other additional ratios that four entities might require to make information on the financial health of the company. For instance, the working capital management committee will need to review the return on assets and return on equity so as assess the profitability of the company. This is necessary when estimating the optimal amount of working capital.
Further, they will also need the liquidity ratios. Secondly, the investment trust will require the return on equity of the company. This would be vital in indicating how efficient the company is in managing shareholder’s funds to generate revenue. The Majestik company will also be interested in the liquidity position of the company. This will indicate the ability of the company to meet its current obligations. The ratio is important for the supplier, especially when it will provide goods on credit to the supplier.
Finally, the Middle State bank will also require the efficiency ratios of the company. The shows will be relevant to the bank since they show efficient the company is in managing resources.
The financial position of Smart Electronics
Financial statements provide the users with a narrow insight into the financial strengths and weaknesses of business because reported values do not give an in-depth depiction of the performance of an entity. Financial analysis using ratios breaks down the financial data into various components for better understanding. It helps in giving trends in performance over time. Various ratios are discussed below.
Profitability
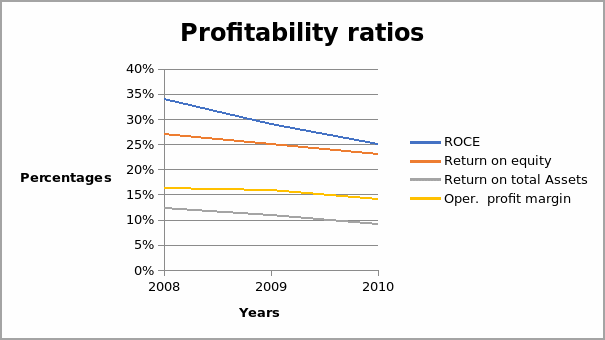
The profitability ratios of the company declined over the three years. Return on capital employed declined from 34% in 2008 to 25% in 2010. Similarly, the return on equity declined from 27% in 2008 to 23% in 2010. Further, the return on total assets declined from 12.3% in 2008 to 9.1% in 2010. Finally, the operating profit margin declined from 16.2% in 2008 to 14.1% in 2010. On average, the profitability of the company was below the industry average. The declining trend in profitability is a bad indication of the financial health of the company. The graph below shows the trend of profitability of the company.
Liquidity
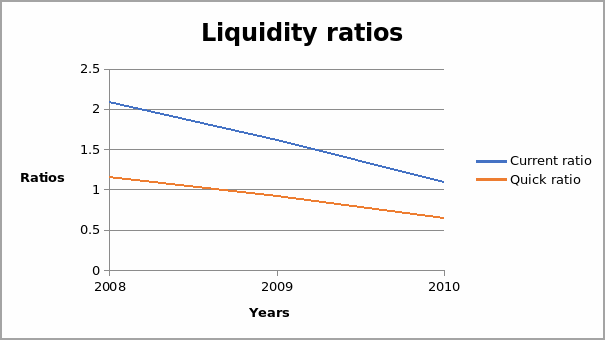
The current and quick ratio indicates the liquidity position. The current ratio declined from 2.09x in 2008 to 1.09x in 2010. Similarly, the quick ratio declined from 1.15x in 2008 to 0.65x in 2010. The ratios are below the industry average for the three years. Besides, they are declining, as shown in the graph below. This is a bad indication of the liquidity position of the company.
Leverage
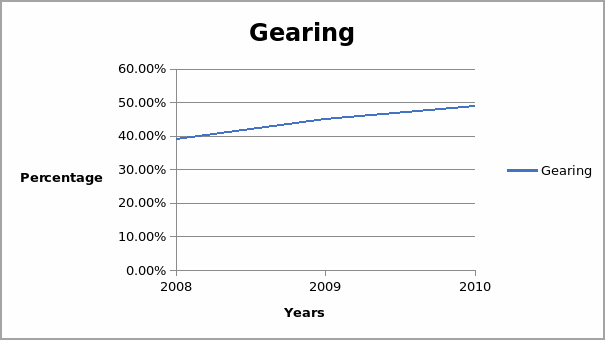
The leverage ratios show the level of debt financing of the company. The debt to equity ratio increased from 1.41x in 2008 to 1.44x in 2010. Similarly, gearing ratio increased from 39% in 2008 to 49% in 2010. The ratios were higher than the industry average. This is unfavourable. Finally, the interest coverage ratio declined from 6.08X to 3.70X. Besides, they were lower than the industry average.
Efficiency
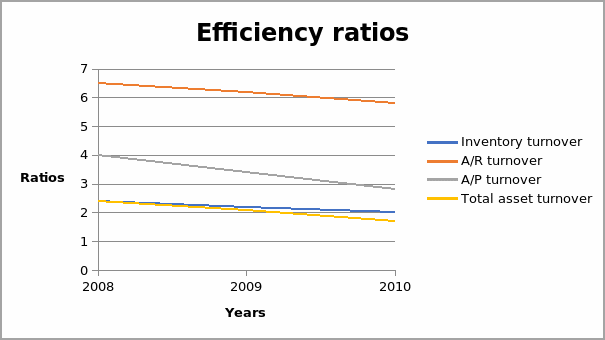
Inventory turnover declined from 2.40x in 2008 to 2.02x in 2010. Similarly, accounts receivable turnover declined from 6.50x in 2008 to 5.80x in 2010. Also, accounts payable turnover declined from 4.00x in 2008 to 2.80x in 2010. Finally, total asset turnover declined from 2.40x in 2008 to 1.70x in 2010, as shown in the graph below. All the ratios were below the industry averages apart from accounts receivable turnover. The high accounts receivable turnover can be attributed to more sales in cash. The declining ratios are not favourable.
Investment ratios
The investment ratios indicate the performance of the shares of the company. This is indicated by the earnings per share which declined from $2.15 in 2008 to $1.75 in 2010 and dividend pay per share which also declined from 50% in 2008 to 35% in 2010 as shown in the graph below. The earnings per share were below the industry average.
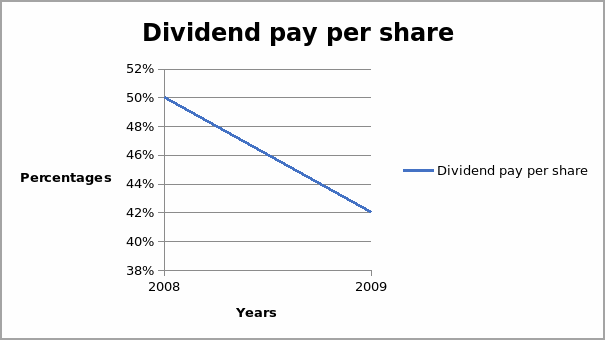
From the analysis above, it is evident that the financial health of the company is deteriorating. This is indicated by the decline in key ratios of the company.
Ethical issues
An ethical issue arising in the case is the use of insider information to make decisions about the future relationship with the company. This is evident in the conversation between George Meckler (new supplier) and Ms Lind Brown (analyst at the brokerage firm). George is aware of a potential loss that may arise from the sale to one of the potential customers that are the government. The sale of the company might have serious consequences on the financial position of the company. Use of such information in making decisions gives the two-player undue advantage over the other players in the market. Insider trading is unethical, and it is an unfair trade practice.