Introduction
The transport sector is the most affected by the volatility of oil prices. Therefore, any change in the price of fuel greatly affects transport, regarding cost, demand, and externalities. High fuel prices lead to increased expenditure on transport and hence reduced demand for transport services. This situation is the case for both domestic and international transport. Additionally, any change in fuel prices affects all modes of transport uniformly.
The past decade has seen an upward trend in fuel prices after a period of stability in the 1990s (Firestine & Guarino, 2012). The discussion below will focus on how fuel prices have influenced the various modes of transport in the United States.
The Aviation Industry
In June 2011, the US airliners spent an average of $2.94 per gallon. This figure amounted to a five percent increase from what was spent in June 2010. Going back to June 2000, the change in average fuel expense per gallon represented a 51 percent increase (Firestine & Guarino, 2012). This trend is a manifestation of the upward trend in oil prices and the impact that such an increment has on transport expenditure. This change in fuel costs has rendered fuel a significant operating expense in the aviation industry. In 2000, air carriers spent 2.5 more times on labor expenses compared to the expenditure on fuel. By 2010, the cost of fuel was at par with that of labor at 25% of the total operating expenses.
Firestine and Guarino (2012) sought to examine the impact of the rising fuel cost on the profits of both high-cost and low-cost air carriers. It was established that both carriers registered a decline in profits from the mid-1990s. However, after the September 11 terror attacks, high-cost carriers experienced relatively higher losses as compared to the low-cost carriers. This major difference in losses has been attributed to the different purchasing strategies that both carriers adopted in the wake of September 11.
In anticipation of the increased oil prices, the low-cost carriers fixed the prices for a substantial amount of fuel, a move that cushioned them when the oil prices began trending upward. The high-cost carriers had employed the same strategy only to a small extent. This situation exposed them to the sharp rise in fuel prices in the days that followed.
The lock-in strategy, popularly known as hedging, worked for the small carriers for the period after 9/11 until some time in 2008. The effect of hedging demonstrated itself in several ways. First, the low-cost carriers continued to enjoy low fuel prices for nearly a decade.
Secondly, only a moderate rise in fuel prices was witnessed on the part of low-cost carriers while the increase was much substantial for the large carriers. Thirdly, the lack of connection between fuel cost and profit margins for the low-cost carriers was notable. However, the hedging strategy ended in 2008 due to the faltering prices of oil. With hedging rendered ineffective, low-cost carriers began experiencing high fuel prices close to those of the high-cost carriers.
Energy Expenses in Sea and Domestic Transport
Just like in aviation, sea and domestic transportation industries have experienced their fair share of increased fuel prices in the past decade. The increment has been estimated to be between five and eight times the cost that prevailed in 2000 (The US Department of Transportation, 2008). This increase, which has resulted in a major “dislocation” in the industry, may have adverse effects on the distribution pattern or trade commodities.
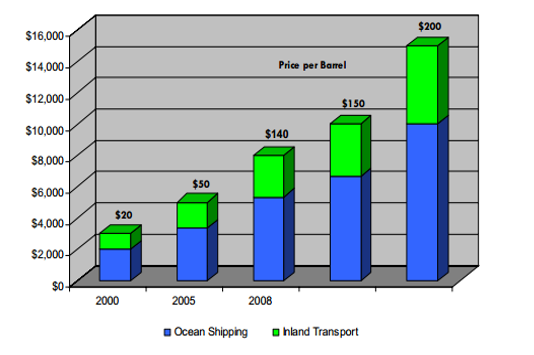
In 2000, the energy fee stood at only 20% of the total sea and domestic shipping business expenses. With the barrel retailing at $140, the cost of fuel had risen to represent 50 percent (The US Department of Transportation, 2008). A further rise to $200 for each container would propel the charge to 70% of the total production expenses. These statistical observations indicate the sensitivity of fuel costs in the shipping industry.
Meanwhile, transport prices increased commensurately with oil prices between 2002 and 2008. The prices in 2008 represented nearly a 100 percent increase in the prices in 2002. Should the price of a barrel increase to $200, transport prices would spiral up by another 300%. An increase of one dollar in the world oil prices would result in a 1 percent increase in transport prices in the shipping industry. The price tag of moving a 40-foot truck between China and the US was roughly $3100 fourteen years ago. However, it had risen to $8000 by 2008 after the price of a barrel of oil changed from $20 to $140 as shown in the graph below.
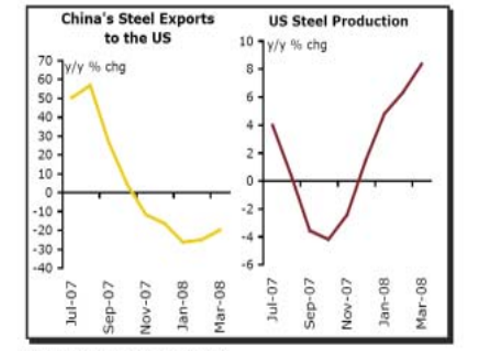
The prices of other commodities such as food, consumer goods, and capital are also affected by increased oil prices. This situation would have a ripple effect on the shipping industry (Avent, 2008). An excellent illustration of how energy costs affect shipment fees is demonstrated by the fluctuations in the requirement and delivery factors that are in play in the steel industry. China’s steel exports to the US dropped by 20% annually in the years before and including 2008.
This decrease was occasioned by the increased transport costs that made the exported steel unable to compete with steel that was locally produced in the US as shown in the figure below. The new equilibrium would bring about a short-to-medium term transformation in the market. The implication of this trend has been the harmonization of China’s extended logistics network by the elevated energy rates. This trend may eventually result in a competitive market as the demand falls. Manufacturers will then seek a reprieve in inexpensive means to deliver to the clients. On the other hand, consumers will become choosier when shopping for good prices.
An Aggressive Affiliation
In the sea shipment process, elevated energy overheads and their effect on the bazaar are likely to compel delivery services to become more aggressive. The carriers are also likely to focus on securing both economies of scale and operating savings as leverage for the high fuel prices. An example of operating savings in play is where carriers decide to slow their fleet to save oil consumption. Carriers have opted to drive their ships at lower speeds.
Economies of scale would be demonstrated where the ship industry stakeholders move toward the manufacture of larger ships to offset the high fuel costs by reducing the number of trips per unit freight. Part of becoming competitive may also require carriers to maximize on marine transport while minimizing on inland shipping because distribution costs per ton are much higher in inland compared to marine transport.
The truck industry has been badly hit to the extent of causing many small-scale truck owners to close shop due to the high prices. The high cost of fuel adds to an existing list of challenges that the truck industry faces, including high traffic congestion and labor shortages. A solution to these truck operators may be found in consolidation as a way of increasing truck rates. However, the benefits of consolidation will still fare badly against the high fuel costs.
Conclusion
In recent years, the price of oil has risen sharply to the extent of causing a ripple effect across many industries. The transport industry has been the most affected. Transport prices have increased across the various modes of transport. In the aviation sector, the increase in fuel prices has resulted in low-profit margins and losses in some cases. In the US, the high-cost air carriers have been more adversely affected by the lower-cost carriers. Such carriers have suffered relatively lower losses. The marine and inland shipping industries have also experienced increased costs, which have resulted in abnormally high transport prices. Subsequently, high freight costs have led to low demand for commodities transported by marine and inland carriers.
Reference List
Firestine, T., & Guarino, J. (2012). A decade of change in fuel prices and U.S. domestic passenger aviation operations. Web.
The US Department of Transportation. (2008). Technical report – impact of high oil prices on freight transportation: Modal shift potential in five corridors. Web.