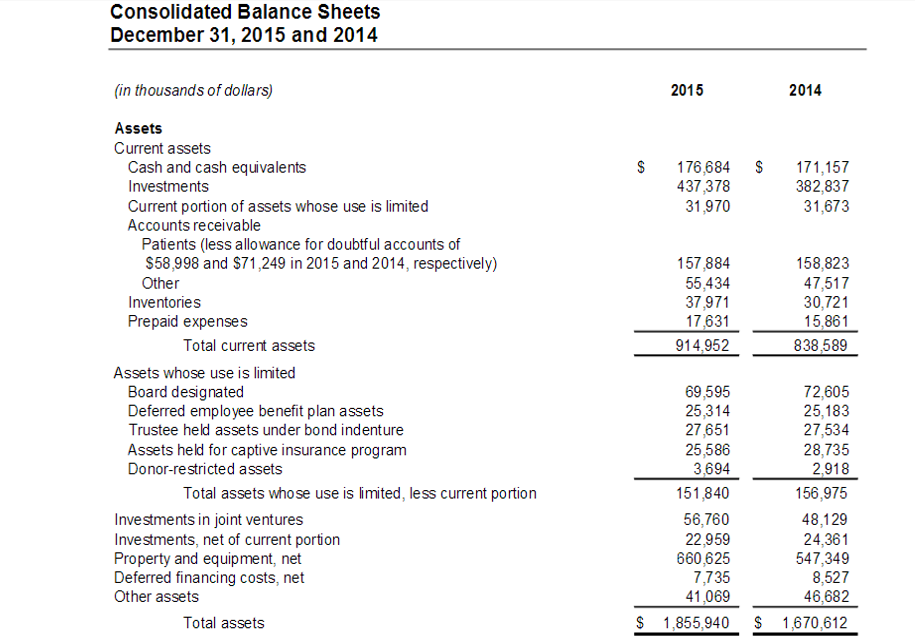
Hackensack University Medical Center’s Financial Analysis

Liquidity ratios

Ratio 2015 2014 Industry average
Current ratio
Current assets/current liabilities
914,952/291,969
3.13:1
838,589/266,158
3.15:1
2.2
Collection period
(Accounts receivables * 365) / total revenue)
(157,884 * 365)/1,631,737
35 days
(158,823 * 365)/1,564,562
37 days
23 days
Days cash-on-hand (cash + short term investment) * 365 / total expenses –depreciation (176,684 + 437,378) * 365/(1,545,921 – 62,505)
151 days
(171,157 + 382,837) * 365/(1,472,121 – 60,880)
141 days
74 days
Average payment period (current liabilities * 365) / (total expenses – depreciation) (291,969 * 365) / (1,545,921 – 62,505)
72 days
(266,158 * 365) / (1,472,121 – 60,880)
69 days
34 days

The calculations above show that there was a slight drop in current ratio. However, the values are high and greater than industry average. This shows that the Hackensack University Medical Center has a strong liquidity position. It can also imply that the company is holding a lot of cash in the form of current assets (Atrill & McLaney, 2013). The collection period dropped. This shows an improved efficiency in collection of accounts payable. The day’s cash-on hand and average payment period increased.
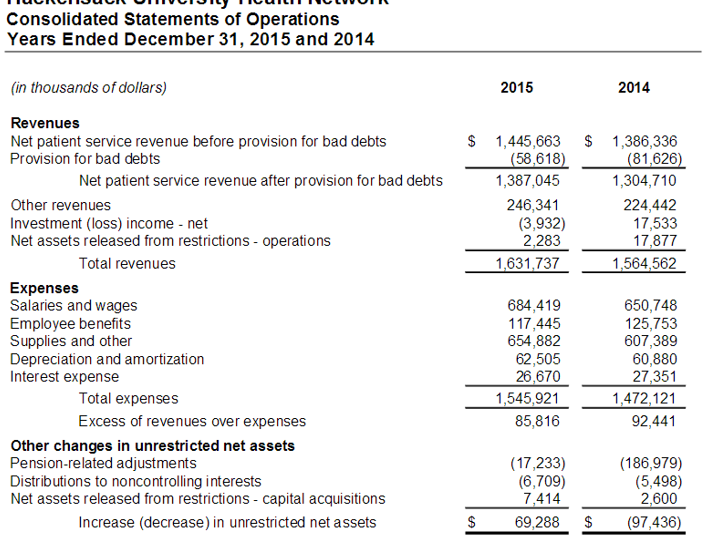
Profitability

Ratio 2015 2014 Industry average
Operating margin
(net operating income /operating revenue)
85,816 /1,387,045
6.19%
92,441/1,304,710
7.09%
3.2%
Total margin (net profit/revenue) 85,816 /1,631,737
5.26%
92,441/1,564,562
5.91%
2.9%
Return on net assets (net profit/total assets) 85,816 /1,855,940
4.62%
92,441/1,670,612
5.53%
3.9%

The three ratios show that the profitability of the company dropped in 2015. This can be attributed to a decline in net profit for the year (Hackensack University Health Network, 2015).

Asset efficiency

Ratio 2015 2014 Industry average
Total asset efficiency
Total revenue/Total assets
1,631,737/1,855,940
0.88
1,564,562/1,670,612
0.94
1.9
Age of plant (years)
Accumulated depreciation / depreciation expense
676,404/58,736
11.5 years
653,932/54,086
12 years
21 years
Fixed asset turnover
Total revenue/net fixed assets
1,631,737/660,625
2.47
1,564,562/547,349
2.86
3.1
Current asset turnover
Total revenue/current assets
1,631,737/914,952
1.78
1,564,562/838,589
1.87
2.9
Inventory turnover
Total revenue /inventory
1,631,737/37,971
42.97
1,564,562/30,721
50.91
39

There was a drop in asset efficiency ratios. The efficiency in the use of total assets, fixed assets, and current assets deteriorated. Besides, the ratio shows that the average age of the fixed assets dropped. This can be an indication that the assets are wearing out and there is need to continuously replace them. Finally, inventory turnover dropped and it shows that rate of stock movement declined (Atrill & McLaney, 2013). Thus, overall efficiency deteriorated.
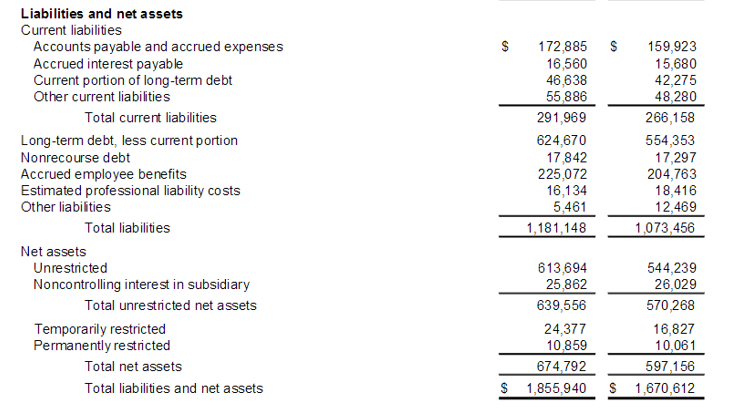
Capital structure

Ratio 2015 2014 Industry average
Net asset financing ratio
Long term debt / net assets
624,670/674,792
0.9257
554,353/597,156
0.9283
0.45
Long-term debt to capitalization
Long term debt / (long term debt + total equity)
624,670/624,670 + 674,792
0.48
554,353/(554,353 + 597,156)
0.48
0.32
Debt service coverage
(Net income + interest + depreciation + amortization)/(debt principal payments + interest expense)
(85,816 + 26,670 + 62,505) / (26,670 + 48,035)
2.34
(92,441 + 27,351+ 60,880) / (27,351 + 47,599)
2.41
5.5
Cash flow to debt (%) (net income + depreciation + amortization) / current liabilities + long term debt (85,816 + 62,505) / (291,969 + 624,670)
16%
(92,441 + 60,880) / (266,158 + 554,353)
19%
25%

Long term to capitalization ratio remained constant in 2014 and 2015. However, there was a slight decline in debt service coverage. This can be attributed to a decline in net income. Finally, cash flow to debt ratio also deteriorated. Thus, the capital structure ratios dropped.

References

Atrill, P., & McLaney, E. (2013). Accounting and finance for non-specialists (8th ed.). Harlow, UK: Pearson Publishing.

Hackensack University Health Network. (2015). Consolidated financial statements December 31, 2015 and 2014. Web.

Exhibit

Balance sheet

Balance sheet

Balance sheet

Income statement

Income statement

Cite this paper

Select style

Reference

StudyCorgi. (2021, April 8). Hackensack University Medical Center’s Financial Analysis. https://studycorgi.com/hackensack-university-medical-centers-financial-analysis/

Work Cited

"Hackensack University Medical Center’s Financial Analysis." StudyCorgi, 8 Apr. 2021, studycorgi.com/hackensack-university-medical-centers-financial-analysis/.

* Hyperlink the URL after pasting it to your document

References

StudyCorgi. (2021) 'Hackensack University Medical Center’s Financial Analysis'. 8 April.

1. StudyCorgi. "Hackensack University Medical Center’s Financial Analysis." April 8, 2021. https://studycorgi.com/hackensack-university-medical-centers-financial-analysis/.


Bibliography


StudyCorgi. "Hackensack University Medical Center’s Financial Analysis." April 8, 2021. https://studycorgi.com/hackensack-university-medical-centers-financial-analysis/.

References

StudyCorgi. 2021. "Hackensack University Medical Center’s Financial Analysis." April 8, 2021. https://studycorgi.com/hackensack-university-medical-centers-financial-analysis/.

This paper, “Hackensack University Medical Center’s Financial Analysis”, was written and voluntary submitted to our free essay database by a straight-A student. Please ensure you properly reference the paper if you're using it to write your assignment.

Before publication, the StudyCorgi editorial team proofread and checked the paper to make sure it meets the highest standards in terms of grammar, punctuation, style, fact accuracy, copyright issues, and inclusive language. Last updated: .

If you are the author of this paper and no longer wish to have it published on StudyCorgi, request the removal. Please use the “Donate your paper” form to submit an essay.