Description of the Steps Taken to Conduct Data Analysis
The relationship between KS and HIV has become increasingly ambiguous because of modern treatment methods for HIV (American Cancer Society 1; Bowling 7). In this paper, I sought to find out the relationship between the two variables. To do so, I analyzed data using SPSS (Argyrous 2-5; Verma 8). I used the Chi-Square test, Paired-sample T-test, and ANOVA tests to compare the variables and proportions of the data obtained. I also used frequency values and pie charts to analyze HIV and KS values. Comparatively, I used frequency (mean and median), the paired sample t-test, the ANOVA test (including Levene test) and correlation Pearson to analyze sbp1 and sbp2 values.
Summary of Statistical Findings
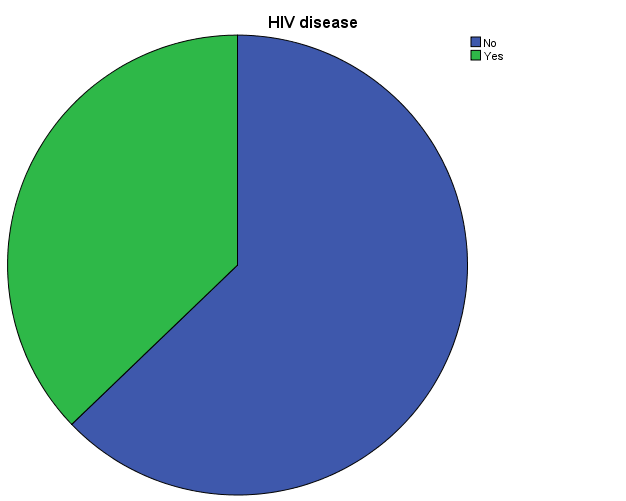
HIV and KS Values
HIV Values
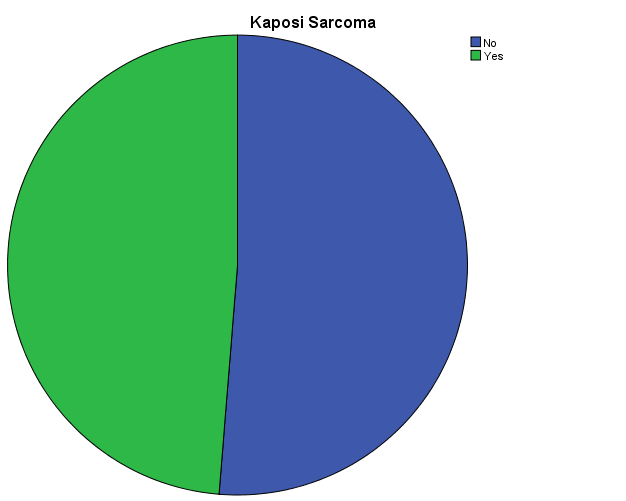
Kaposi Sarcoma
SBP1 and SBP2 values
T-Test
Works Cited
American Cancer Society. Kaposi Sarcoma. 2014. Web.
Argyrous, George. Statistics for Research: With a Guide to SPSS, New York, NY: SAGE, 2011. Print.
Bowling, Ann. Research Methods in Health: Investigating Health and Health Services, London, UK: McGraw-Hill International, 2009. Print.
Verma, John. Data Analysis in Management with SPSS Software, New York, NY: Springer Science & Business Media, 2012. Print.