The purpose of the experiment was to understand the differences between different types of ideal gas expansions, paying attention to the amount of work done.
Results
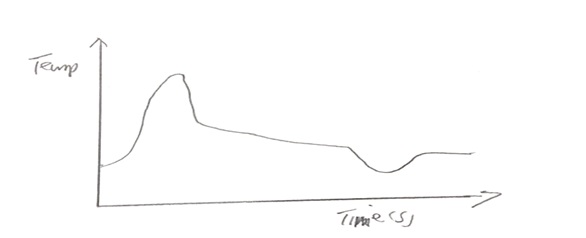
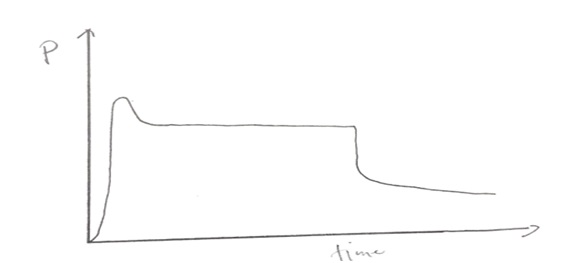
The temperature-time plot for the isothermal process when moving the piston quickly is indicated in Figure 1. Figure 2 shows the pressure versus time plot for the isothermal process when moving the piston slowly. It was noted that the temperature in adiabatic conditions increased drastically when the piston was pushed rapidly and decreased when the piston was pulled back. In the isothermal condition, the temperature remained fairly constant when the piston was pushed and pulled back. Figure 3a shows the temperature-time plot for the adiabatic process when moving the piston quickly, whereas Figure 3b shows the predicted graph of temperature versus time. Conversely, Figure 4a shows a pressure-time plot for the adiabatic process when moving the piston slowly, whereas Figure 4b shows the predicted graph of pressure versus time. Overall, the observed results had similarities with the predicted outcomes. The graph of temperature against time in Figure 3a followed the same trend as the predicted one in Figure 3b. On the other hand, the graph of pressure against time for adiabatic expansion (Figure 4a) aligned with the forecasted trend in Figure 4b.
Similarities between the experimental and predicted graphs were that the pressure spiked momentarily when the volume of the gas in the syringe was compressed. The pressures in both graphs appeared constant for short periods and decreased further when the gas volume in the syringe increased. However, the decrease in pressure after the flat region in the predicted graphs appeared sharper than the experimental graphs. For example, when the syringe was compressed, the temperature increased momentarily from room temperature (30oC) to 80oC between an interval of 0 to 5 seconds. The temperature remained fairly constant when the piston was held for 10 seconds. The temperature then dropped when the piston was pulled back and eventually returned to room temperature due to the heat flow from the surroundings into the syringe. The minimum and maximum pressures at room temperature were and 95.4 kPa and 421 kPa, respectively.
Discussion
Adiabatic processes occur in an insulating material. Heat neither enters nor leaves the system but remains constant throughout the entire process.
Heat (Q) = 0
The piston is compressed slowly during the isothermal process to prevent temperature variation within the system.
T = 0 and ΔT = 0
According to the first law of thermodynamics, the change in internal energy is equal to the sum of heat and amount of work.
ΔU = q + w
A system’s internal energy increases by the magnitude of the work done. Therefore, the internal energy of a system is directly proportional to its temperature.1 Compressing the piston led to a dramatic temperature change over ambient conditions as shown in Figure 3a. Consequently, the internal energy increased with a rise in the temperature of the system. All the runs in Figure 3a varied to a small extent following the rapidity of compression and expansion of the piston.
The quantitative results due to the expansion and compression of the ideal gas showed a maximum temperature of 76.38oC and a minimum temperature of 29.8oC. The temperature rise during compression was caused by increased collisions of gas particles and an increase in intermolecular forces that generated kinetic energy, thereby adding to the internal energy of the system by generating heat.2 The heat energy was equivalent to work done on the gas.
When the piston was compressed, the gas volume was reduced with the collision of the gas particles. However, the collision of the gas molecules with the walls of the syringe increased, which raised the pressure. Conventionally, pressure and temperature are directly proportional following the ideal gas law, meaning that high pressure increases the temperature of the gas molecules.3 The average kinetic energy (K.E.) of gas molecules also increases as the temperature increases. It was noted that the temperature and kinetic energy reduced when the piston was pulled back. This observation was attributed to the collision of gas particles in the syringe with each other and against the walls of the container. The movement of the gas particles resulted in a rise in pressure. Conversely, an increase in gas temperature during compression explained why the particles moved faster when expanded due to an increase in kinetic energy given that temperature is directly proportional to speed. The energy transferred to the gas particles enabled the gas inside the syringe to heat up during compression.1
Compression of a gas based on Boyle’s law was achieved by assuming that the syringe so tight that the amount or mass of air stayed the same. Compressing the syringe reduced the volume of the gas and increased the air pressure. Uncompressing the syringe increased the volume of the gas and reduced its pressure, which was in line with Boyle’s suppositions. Boyle’s law that states that the pressure of a gas is indirectly proportional to its volume at a constant temperature.4 Thus, the product of volume and pressure is constant for a fixed mass of an ideal gas at a constant pressure.
P1×V1= P2×V2
Boyle’s argument in Figure 4a helps to predict how pressure change relates to time implying that if the volume decreases twofold, then pressure also increases by the same magnitude. Pressure stabilizes during the first ten-second hold. It then returns and remains at ambient atmospheric pressure. During compression of an ideal gas, the maximum and minimum pressures were 421 kPa and 95.4 kPa.
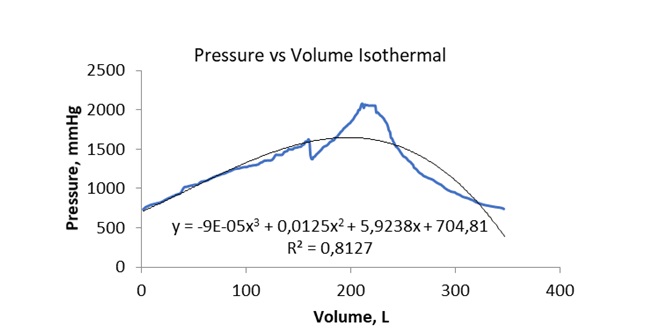
Figures 5 and 6 above show temperature as a constant and involve pressure and volume changes where heat is neither generated nor absorbed. The work done during compression increases the internal energy of the gas. Usually, work done under the adiabatic process is equal to the area under the curve and can be calculated using the cubic p-function as follows:
y = -3E+07x3 + 6E+06x2 – 365062x + 8552.5.
The polynomial function above can be rewritten as:
y = -365029x + 8560.6548.
The above equation can further be integrated using an upper limit of 60 and a lower limit of 30 as follows:
Therefore, work (W) done under the adiabatic process is equal to 4.925J.
On the other hand, work done under isothermal conditions can be calculated using the following polynomial function:
y = -131.23x3 + 1158.1x2 – 3696.3x + 5043.1.
The above equation then becomes y= -1773.79x + 5043.1.
The simplified equation can then be integrated to give rise to the following equation:

Therefore, work (W) = 2.24 J.
From the work calculations above, the work done under adiabatic conditions was higher than that done under isothermal conditions. Comparing the adiabatic and isothermal compressions and expansions revealed that the adiabatic graph had a steeper slope than the isothermal one, implying that the adiabatic curve enclosed a greater area than the isothermal curve.
The principle of ideal gas expansion also explains why spark plugs are not used in diesel engines. A diesel engine can burn fuel without spark plugs because its compression ratio is twice that of the petrol engine. This difference generates a very high temperature when the air inside the diesel engine cylinder is compressed. The high temperature evolved is enough to burn or ignite the fuel supplied. In contrast, within the petrol engine, the temperature generated is not enough to ignite the fuel, hence, sparks plugs are needed
The momentary increase in temperature from 30 to 80oC within the first 5 seconds of compression and return of temperature to 30oC when the piston was pulled back could be explained by Charles’ law.5
The pressure results of the experiment could also be explained by the kinetic molecular theory. When the syringe was compressed, the gas volume in it reduced, thereby increasing the collisions of the gas particles with each other and the walls of the syringe. Consequently, the high collisions increased the kinetic energy and internal energy of the gas molecules. Therefore, the pressure increased due to the increased kinetic energy of the molecules. Conversely, temperature and the kinetic energy reduced when the piston was pulled back because the gas particles in the syringe had enough space to avoid collisions with each other and against the walls of the container, which reduced the pressure.
References
Gaskell D.R.; Laughlin, D.E. Introduction to the Thermodynamics of Materials; 6th Ed.; CRC Press: Milton, 2017.
Hein, M.; Arena, S. Foundations of College Chemistry; Wiley: Hoboken, NJ, 2014.
Oonk, H.A.J.; Calvet, M.T. Equilibrium between Phases of Matter Phenomenology and Thermodynamics; Springer: Dordrecht, 2008.
Stoker, H.S. General, Organic and Biological Chemistry; 7th Ed.; Cengage Learning: Boston, MA, 2015.
Ebbing, D.; Gammon, S.D. General Chemistry, 11th Ed.; Cengage Learning: Boston, MA, 2016.