Executive Summary
The data-driven decision-making process is an important process in healthcare-related management. Since data collection and integration have evolved over the past years, a comparative analysis is significant for the purposes of ensuring consistency. The clinical nurse specialist (CNS) to patient ratio provides management data subsets for workforce planning. However, the CNS workforce and nursing staffing has not been expanding sufficiently to keep pace with the growing number of cancer patients. As such, Macmillan Cancer Organization is interested in examining the ratio within its NHS cancer centers. For this report, data analysis involved the NHS Calderdale CCG cancer center with more information from Occupational Employment Statistics (OES) and U.K Office for National Statistics [ONS]. Using scatter plot, regression analysis, and Summary Hospital Mortality Indicator (SHMI) model, the findings indicate a health disparity concern with regards to few CNS to cancer patients. In this regard, the report delivers key insights required by the Macmillan charity firm. For instance, there is a need for re-instituting a role expansion program that will act to provide workforce support, particularly to nursing staff, to ensure equal patient safety for all cancer types.
Data-Driven Decision Support
Data Preparation Process
Data Collection, Filtering and Integration
Comparison analysis involving past cancer data may prove futile. As a consequence, only data containing the 2017 census was used for this report and the actual figures from the NHS Calderdale CCG cancer center. Data was collected over three days from 17th-21st June 2021. Using a bespoke spreadsheet with drop-down menus, areas of investigation were informed by the 2017 census report. All job positions were documented as whole-time equivalents (WTE).
Data were segmented and filtered based on cancer networks in England. According to Tyrkiel (2019), data segmentation and filtering allow one to filter raw data by using data filter tools. In this report, such filters as job status, research question, custom variables, geographical location, and type of cancer were used using spreadsheet query tools. Using England’s Occupational Employment Statistics (OES) based on the data from the U.K Office for National Statistics [ONS], three cancer networks reimbursed complete datasets on the total number and type of CNSs (ONS, 2020). Upon recording, data integration was performed to gauge both the cancer workload and caseload. According to Stedman and Wigmore (2019), data integration encompasses a set of procedures that collate data from many sources to convert them into valuation information.
Using the National Cancer Information Service (NCIS), the data extracted on nurse staffing, level of training, and the practice setting were aggregated to each specific hospital level. The results were further compared to the numbers of cancer registration by cancer type and cancer network geographical location, in this case, England. The numbers were based on patients detected with cancer in 2017 and residents of England.
Analysis of Data Representativeness
Capturing big data of detailed information of nurse staffing from employment outcomes data is important for new analyses and implications. According to Lin (2017), complete representative data depends on a well-refined dataset and acts to detect any form of bias. Therefore, this report’s representative analysis involves comparisons of the data on nurse staffing sourced from NHS Calderdale CCG in England with data from England’s Occupational Employment Statistics (OES).
Since no single data from the respective hospital listings contained both geographic and temporal granularity, the generated data sets were derived from NHS Calderdale CCG websites, thus containing more information on nurse staffing (Table 1) and patient’s cancer caseloads (Table 2). In this regard, the approach is notably capable of encompassing stronger noise and selection bias (Loken and Gelman, 2017; Krishnamurthy, 2019). Consequently, Parson’s coefficient correlation was done for data in Table 1 and compared to the overall nursing specialist in the U.K population to understand the representativeness of the Table 1 data. Furthermore, data in Table 2 was compared to the general cancer incidences in the U.K population for analysis of representativeness of the data.
Table 1: Specialist cancer nurse workforce, WTE, in NHS Calderdale CCG England 2017
Based on the analysis, the correlation is 0.78 indicating that the two sets of data have a large positive relationship. However, the reason for the non-perfect correlation could be elucidated by two explanations: First, it may be emanating from selection bias in the data sources noting that the data were derived from three different data sources (Shi et al., 2019). Second, the OES is an employment data set rather than a specialist nursing data as derived from the National Cancer Information Service.
Table 2: Incidence at NHS Calderdale CCG against England’s incidence values
From the Table 2 representative analysis, data on incidence in NHS Calderdale CCG were compared to data containing total incidence in NHS as a whole derived from the National Cancer Registration and Analysis Service (NCRAS) of the department of Public Health England (NCRAS, n.d). For example, the analysis above (see Table 2) is the incidence distribution for the NHS Calderdale CCG hospital and the whole U.K population with a coefficient of correlation of 0.66. This indicates a fairly large positive association between the two types of data.
Statement on Generalizability and Limitation
Statement of generalizability in reporting data for analysis is an important aspect of research. Even though the report is derived from a single site (NHS Calderdale CCG), the report does not mean that the outcomes are not true findings of a ‘hospital effect’ (Clapp, James and Kaimal, 2018, p. 2). However, relating the relationship of the cancer specialist nurse and the mortality rates could arise because cancer centers with more resources in general also have more nurses (Lasater et al., 2021; Rosell, L. et al., 2018). Moreover, the measure of CNSs is determined relative to the average mortality rate for the hospital cancer type rather than an absolute measure (Kopasker et al., 2020). Notwithstanding, the report cannot eliminate all possible sources of endogeneity (Rutz and Watson, 2019; Ullah, Akhtar and Zaefarian, 2018). As a result, there is selection bias because of the lack of reflection in the report on the effects of the disparity in the average staffing levels amongst U.K hospitals.
Data Modeling
Selection and Justification of Models
The current report utilized the Summary Hospital Mortality Indicator (SHMI) model. According to Longo et al. (2017), “SHMI is the ratio of the actual number of deaths from all causes in a hospital or within 30 days of discharge to the number of deaths expected given the characteristics of patients” (p. 43). Based on this model, the characteristics of the patients used are the types of cancer for all the patients that died in the hospital during the financial year 2017. In this case, the SHMI score is indicated in Table 3 below and is used as a measure of calculating a predictive risk of mortality. Moreover, the model allowed the analysis of the report by proving an estimation of the risk linked to a wide range of cancer types during the period of analysis. Notably, because this measure is taken at the end of a financial year of a patient’s death, it is assumed to be largely independent of any effects that may arise from the deviation in CNS staffing, though concurrent scores may also be presumed to be influenced by the care received in each particular hospital.
The choice of the model is based on the principle that a constraint is unnecessary in the model if it does not alter remarkably either the comparative or the total degree of the performance indicators of the hospital. For instance, according to Pearl et al., 2017), a variable in a model may have no significant value in sharping figures between hospitals if another model with additional covariate had a large correlation with an unadjusted model. Therefore, an adjustable change in a model may be a statistically significant predictor of death, only if the distribution of the change is the same across hospitals (Meng et al., 2020). As such, sometimes modifying the model may not change the values of the hospital’s relative score in the model. In this regard, using the rank correlation, the model is useful in choosing covariates if their addition to the model would potentially give a relatively low correlation between the expected values with the existing model. Figure 1 below indicates the relationship between the observed deaths against the predicted deaths.
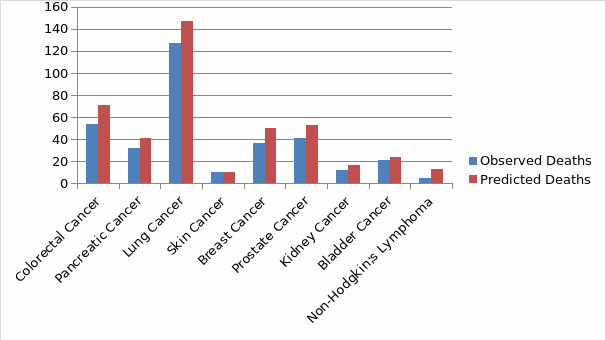
Table 4 indicates the Standardized Mortality Ratio (SMR) obtained for each particular cancer type in the hospital against the national population.
Table 3: Hospital Standardized Mortality Ratio (Scatter Plot) NHS Calderdale CCG
The staffing level was then measured as CNS per patient in the given financial year. To reflect the diverse staffing requirements, variables were normalized as absolute deviations from the mean for the hospital. The concept of staffing corresponds to the Safer Nursing Care Tool; with the only variation being the hour per patient case, wherein this report, staffing level was calculated as CNS per patient in the given financial year (Cho et al., 2020). The report also measured staffing level as a categorical variable. Assuming that staffing level was the key factor for either survival or mortality for all the cancer types, the nurse-patient ratio effect was calculated by comparing the SMR to the nurse of CNS in each given cancer type. Therefore, low CNS to SMR was used as a measure of mortality risk.
Application of Statistical Tools and Reporting
Analysis
C-statistic, a logistic regression procedure was used with a variable selection to estimate the HSMRs against the staffing level. For each particular cancer type, the deletion criterion was set at α=0.10 to prevent the unwanted removal of covariates that are significant for the study. In this case, a leave-one-out cross-validation methodology was used (Gronau and Wagenmakers, 2019). The fast computation of cross-validation in linear models in the leave-one-out cross-validation methodology is as illustrated by the formula indicated below.

Where MSE [i]=yi−^y[i], and the number of the observations are given by y1,…,yNy1,…,yN, and ^y[i]y^[i] is the predicted value attained when the model is projected with the ith case deleted. More often, the method is known as PRESS (Prediction Residual Sum of Squares) statistic. The logistic regression involving the area under the curve was calculated using the cross-validated figures and Confidence Intervals (CIs) (95%) were evaluated using Byar’s approximation (as cited in García-Torrecillas et al., 2019). The general statistical analysis of this report was generated using the Data Analysis tool in Excel.
To identify cancer type with large CNS differences in the HSMR, percentages of the CNS in each HSMR for whom their ratio of expected versus observed mortality indicated deviation from the benchmark was calculated. This was defined as the CNS’s 95% CI, which is the value for the number of observed mortality equaling the number of expected mortality (Richardson et al., 2017). Using the SMR for the site-specific hospital over the nine cancer types, homogeneity of variance was analyzed.
Moreover, for clarity of analysis and in addition to staffing level analysis, patient turnover mortality variable and cancer type as a random effect was used. Resulting R Adjusted was used to consider the relative rate of mortality over a given time frame. Since staffing level differs between and within cancer types, staffing level was factored in as time-varying covariates in a repeated measure framework. As a result, the estimation in this report takes notes of the effects of staffing and how it reflects variation within the hospital rather than amongst other hospitals. According to Asch et al. (2021), variation between hospitals can be used to evaluate the diverse quality care distribution in different hospitals. In this case, CNS staffing levels were expressed as a cumulative sum of the contact to the particular cancer type versus the SMR.
Reporting on Patient and Staffing Characteristics
Overall, 339 cancer patients (0.41%) died of cancer in the hospital as compared to the national survey. Based on the report, only 9 different cancer diagnostic groups were presented as the main cause of death associated with the hospital cancer incidences, and the data were used to calculate SHMI. Lung cancer was the single most common cancer-related death (37.4%) with Non-Hodgkin’s Lymphoma accounting for the fewest cancer-related death (1.5%). The mean CNS per cancer type was 3.0 staffing level.
Reporting on Staffing Level and Mortality
The primary investigation considered in this report is the nursing staffing level during the financial year, 2017, reflecting the majority of the cancer incidences and mortality rates amongst the majority of patients at the NHS Calderdale CCG. Secondary analysis was also undertaken to consider the effects of staffing levels on different cancer types and their predictive score of deaths. The investigation, therefore, focused on the period of the hospital death and incidence when the patient was suffering from a particular cause of death related to cancer. This method of modeling reflects the approach undertaken by Fagerström, Kinnunen and Saarela (2018) and Needleman et al. (2020). The variance in the nursing to cancer incidence ratio is also reflected within the crude mortality rates, with variations across the types of cancer. Notably, higher numbers of cancer incidences per CNS are consistent across the care facility despite the variation in the types of cancer.
Explanation of Decision on the Outcomes
CMR when measured against the patient’s various types of cancer-based on the number of CNS has provided significant outcomes. For instance, patients experienced an increased risk of death when the staffing levels fell below the hospital’s mean weight. While the association appeared to be a polynomial curve for the nurse: incidence ratio, there was proof that the risk of mortality elevated as patients were exposed to increased nurse staff levels that were either above or below the standard mean of the hospital. As such, the report confirms the occurrence of both an association between CNS staffing and the risk of death as an outcome. Moreover, the outcome demonstrates that at the patient level, there is a longitudinal association with variations on the level of staffing, hence providing more confirmatory information.
However, the contrast between treating CNS as either categorical or continuous variable, concerning crude mortality rate, raises the possibility of a non-linear effect. As such, the report explored this effect by introducing SMR terms to compare the staffing variables into the models as reported in Table 6. The ratio term for patient’s risk of death for analyzing nurse staffing level was significant, though with a non-linear relationship. To comprehend this relationship of the non-linearity, a curve for the coefficients was plotted as indicated in the diagram below (see Figure 2). The risk of death was increased when cancer patients were exposed to either more than the mean or less than the mean of the nurse to incidence ratio over the curse of the study period, 2017.
To measure nurse staffing, individual hospital website was searched for eligible registered with the majority of data found from respective financial report of the cancer center. As a result, the data established was used to calculate the mean workload (the number of patients treated by the nursing staff during the financial year, 2017). Consistent with previous findings of a burdened healthcare infrastructure, the outcome from the nursing staffing in the cancer specialist category in the hospital indicated that a specialist nurse cared for more than 24 patients on average (Philip, Mathew and John, 2018). Consequently, the report for workload measured as the cancer incidence rate for the hospital was treated as a second-tier viable for the multivariate modeling.
The measure on the level of educational preparation was also done for each particular nurse. For the current hospital under the study, the outcome was calculated in proportion to the available nurse’s specialist category. The outcome was then categorized as a continuous measure. The mean staffing level in this report is approximately 3.0 for only specialist nursing staff per cancer type, typical of NHS general cancer hospitals. However, this mean falls below those described in the Carter Review of productivity in the NHS, where the requirement for quality care mandates 6-15 staff for specific pathology (Ford and Dowler, 2016). According to the Review, nurse productivity is calculated by “adding the hours of registered nurses to hours of healthcare support workers and dividing the total by every 24 hours of inpatient admissions” (Ford and Dowler, 2016, para. 5). Although the outcome does not indicate a clear consensus or support of the policy of compensating for deficits in the CNS staffing by recruiting more cancer specialists, the findings indicate that adequate staff is significant for maintaining patient safety.
The severity of the illness adjustment, in this case, cancer type was included in the model for analysis purposes. As such, 9 variables in the report’s models that describe the cancer types were used, excluding the demographics, comorbidities, cancer stage, and duration of cancer illness based on ICD-9-CM codes (Center for Disease Control and Prevention [CDC], 2015). According to CDC (2015), ICD-9-CM is a classification system for assigning index codes to disease-related diagnoses and there corresponding methods of analysis with hospital application. Moreover, the ICD-9 was used to assign codes and organize data on death rates from death certificates up until 1999. Therefore, the index codes could be used by respective hospitals to enter patient’s data on electronic health records and used for further diagnostic procedures, bill payments and reporting of any issues related to the patient. The Table below indicates some of the diseases-related index codes as shown in the table below (see Table 4).
Table 4: ICD-9-CM Index to Diseases and Injuries Addenda Sixth Edition, 2014
These variables were reserved for analysis from the original set of more than 83 patient outcomes after they significantly predicted substantial SMR in a random half of the sample from the cancerdata. The retained variables were then used to evaluate the model on all three possible results for predicting mortality rate. The C-statistic (area under the receiver operating curve) for the risk adjustment model was 0.76 on average.
Moreover, analysis of variables to account for equal low staffing for disease incidences other than other professionals was performed. In this case, equal cancer specialists across the cancer types with regards to cancer incidences did not significantly change the coefficients or the substantive statistical outcomes. For instance, after close consideration for the possibility of low staffing resulting in a high mortality rate for cancer with high disease severity, an examination of lung and prostate cancer with high disease incidence among patients who died was performed. Prostate cancer occurs marginally less often to those exposed to low staffing compared with Lung cancer at 77% and 86% respectively.
Interpretation of the Study Outcomes
A scatter plot, just like a funnel plot is a type of statistical tool chart that helps in evaluating data at a given point. The plot used in this report has necessitated the comparison to be made with regards to cancer-related deaths and the average for England cancer-related mortality. From the below diagram (see Figure 2), almost all the cancer types were within the national range of (SMR=0.78). However, Non-Hodgkin’s Lymphoma indicated a good SMR of 0.38, with low deaths in comparison to the expected death rates.
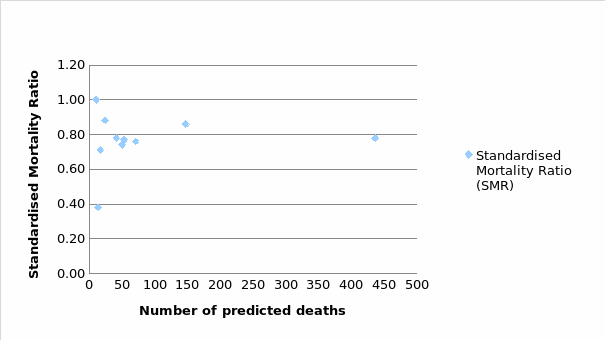
Staffing Level and SMR
Using death rates across the cancer types, the model coefficients were almost identical. As such, mortality rates within the year 2017 amongst the diverse cancer types yielded an almost similar pattern, though with no clear consensus on the level of staffing in relation to the mortality rates. With all other factors remaining constant, the SMR was then related to the number of CNS within the hospital to predict the mortality rate based on the provision of specialist care. In this case, low and high staffing ratios were compared to evaluate any significance pattern. Table 5 below indicates the distribution of staffing levels against the SMR.
Table 5: Relationship between Standardized Mortality Ratio (SMR) and Staffing Level
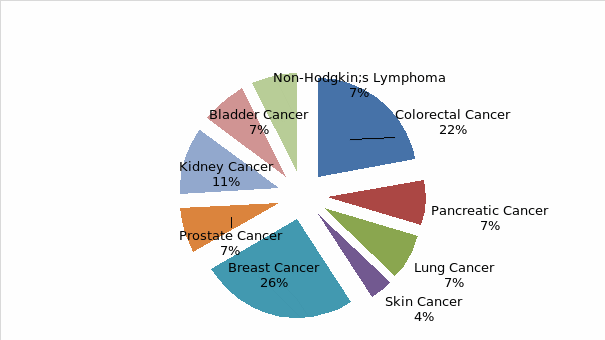
From the above chart, breast and colorectal cancer had the highest number of CNS representatives (26% and 22% respectively) compared to the rest of the cancer types, with Skin cancer indicating the lowest staffing level.
Table 6: Probability output results from Rank Regression
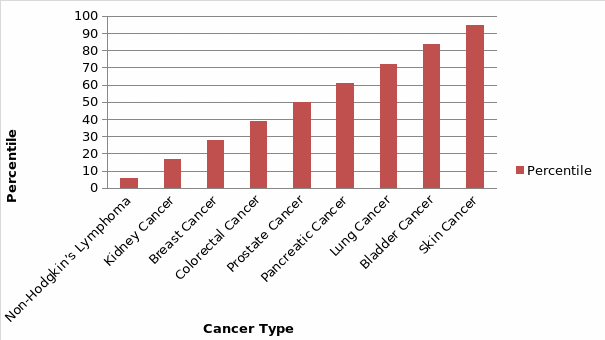
For the significance of rank test from the regression analysis, Non-Hodgkin’s Lymphoma with a percentile value of 5.55 was the most represented with a low value of mortality rate as compared to the number of CNS. However, Skin Cancer and Bladder cancer had the highest percentile of 94.44 and 83.33 indicating low CNS representation, thus high SMR. Although models encompassing cancer type’s exposure to low CNS showed significant adverse effects, their coefficients were lower (R Adjusted=0.802385621 per cancer type), a likely product of increased risk being primarily associated with such factors as the severity of the cancer type. To further measure the influence of variation in staffing levels, the report reconnoitered the effects of absolute variations by calculating the ratio of cancer incidence per CNS per patient relative to the mean for the hospital. The cancer nurse specialist to cancer incidence ratio is shown in Table 5 below.
Table 7: The cancer nurse specialist to cancer incidence ratio
The analysis in Table 7 above indicates the cancer incidence per specialist nurse. However, the values do not entirely factor in the pre-existing cancer caseloads. Moreover, it is also significant to annotate the variation not only across the cancer types but also across the Crude Mortality Rate.
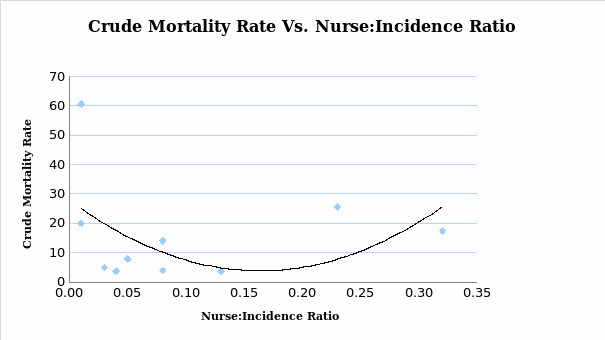
From the analysis showed in the diagram (see Figure 5), the lower and the higher the nurse to incidence rate was associated with the high crude mortality rate. However, the nurse to incidence ratio in the range of 0.15 to 0.20 was linked to the lowest crude mortality rate. However, this analysis does not acknowledge pre-existing or ongoing cancer caseloads. In summary, the proportion of incidence rate per cancer patient refined by the number of CNS to reduce the chances of mortality rate and signaling deviation from the benchmark is indicated in the X-axis. Though the Y-axis depicts the crude mortality, the size of the shapes of the diagram (see Figure 3) shows the number of the included nurse for every patient with malignancies, thus the nursing-patient ratio.
It is challenging to ascertain that cancer patients are consistently supported or unfairly disadvantaged by a variation in the CNS provision, assuming that the role is undertaken and conducted in the same standard and complexity. However, previous research findings suggest that both hospital and nurse staffing as variables have a significant relationship with patient outcomes (Aiken et al., 2018; Ball et al., 2018; Carthon et al., 2019; Cho et al., 2017; Lee and Scott, 2018; Shin, Park and Bae, 2018). In this regard, an agreement on workload is essential to appraise workforce planning in future healthcare systems (Willis, Cave, and Kunc, 2018). Furthermore, according to Kerr, Donovan and McSorley (2021), the role of specialist nurse staffing in the U.K cancer care systems still lacks vibrant characterization. Essentially, nursing capacity and the role of specialist nurses are susceptible to the financial pressures faced by NHS trusts because of a lack of transparency on nursing guidelines (Kelly et al., 2020; Kerr, Donovan and McSorley, 2021). Therefore, analysis of the nursing to patient ratio and its subsequent effects is warranted.
Proposed Recommendation
Despite the existence of a significant increase in the number of cancer staff over the past years before the 2017 in most areas of cancer types, nursing staff, in particular, has not been satisfactorily expanding. As such, nursing staffing level should be controlled to keep up with the pace of the ever-growing number of cancer patients over the years upon a cancer diagnosis. Since quality is a key requirement in all NHS health-related treatments and care, the nursing-patient ratio will be crucial in underpinning valuable improvements in patient care and outcomes with regards to the growing cancer cases. As such, this report will act as a valuable tool to enlighten other support groups and foundations in the vision of providing the best cancer specialist services.
However, from the data analysis shown in Figures 1 to 3 above, there is evidence of a noticeable disparity in the provision of nursing care for those patients diagnosed with diverse cancer types in hospitals, hence can be used to generalize all the hospitals in the U.K. Moreover, recommendation from the Carter Review of productivity in the NHS also indicates that the delivery of more nursing staff in bridging the gap between the nursing-patient ratios is an important indicator of the quality of cancer services. Consequently, stakeholders and managers of the Macmillan Cancer Support Organization may, as a result, be interested in the analysis of the ratio of nursing staff to cancer patients within the community hospitals and the larger U.K-based hospitals. Therefore, it is important to underscore the significance of healthcare providers for hospital workforce facilitation in every cancer patient care, hence the nurse-patient ratio.
Future work will need absolute analysis to remove debatable topics regarding the nursing-cancer patient ratio. However, Macmillan Cancer Support Organization may use this report to inspire consideration about how best to respond to question on barriers to healthcare provision by cancer patients in the U.K. Notably, due to high life expectancy in the U.K, the prevalence of cancer and other comorbidities continue to increase, thus resulting in a rise in the number of cancer patients with multiple health concerns. Comorbidities are increasingly becoming a common disorder and with many patients suffering from diverse types of cancer, living with one or two conditions apart from cancer has increased.
As a result, Macmillan Cancer Support Organization’s stakeholder must examine cancer care workforce and predict how the future ratio might look like for strategic management. Case in point, the organization must be more versatile and work with the community stakeholders to identify people living with cancer to ascertain that such barriers are managed. Therefore, the nursing cancer staff to patient ratio will be a critical tool for many hospitals’ systems lacking decision-making processes that involve a surged number of people living in a community after a cancer diagnosis. Moreover, the analysis provides key insights needed by the organization in re-instituting a role improvement program that will act to deliver workforce support especially to nursing staff that would want to specialize in cancer treatment.
Reference List
Aiken, L. H. et al. (2018) ‘Hospital nurse staffing and patient outcomes’, Las Condes Clinical Medical Journal, 29(3), pp. 322-327.
Asch, D. A. et al. (2021) ‘Variation in US hospital mortality rates for patients admitted with COVID-19 during the first 6 months of the pandemic’, JAMA Internal Medicine, 181(4), pp. 471-478.
Ball, J. E. et al. (2018) ‘Post-operative mortality, missed care and nurse staffing in nine countries: a cross-sectional study’, International Journal of Nursing Studies, 78(1), pp. 10-15.
Carthon, J. M. B. et al. (2019) ‘Association of nurse engagement and nurse staffing on patient safety’, Journal of Nursing Care Quality, 34(1), pp. 40-46.
CDC. (2015) International classification of diseases, ninth revision, clinical modification (ICD-9-CM). Web.
Cho, S. H. et al. (2017) ‘Relationships between nurse staffing and patients’ experiences, and the mediating effects of missed nursing care’, Journal of Nursing Scholarship, 49(3), 347-355.
Cho, S. H. et al. (2020) ‘Determining nurse staffing by classifying patients based on their nursing care needs’, Journal of Korean Academy of Nursing Administration, 26(1), pp. 42-54.
Clapp, M. A., James, K. E. and Kaimal, A. J. (2018) ‘The effect of hospital acuity on severe maternal morbidity in high-risk patients’, American Journal of Obstetrics and Gynecology, 219(1), pp. 1-7.
Fagerström, L., Kinnunen, M. and Saarela, J. (2018) ‘Nursing workload, patient safety incidents and mortality: an observational study from Finland’, BMJ Open, 8(4), pp.1-10.
Ford, S. and Dowler, C. (2016) Carter review recommends new measure of nurse productivity. Web.
García-Torrecillas, J. M. et al. (2019) ‘Spatial and temporal variations in Spain in the standardized ratio of in-hospital mortality due to colorectal cancer, 2008–2014’, BMC Cancer, 19(1), pp. 1-12.
Gronau, Q. F. and Wagenmakers, E. J. (2019) ‘Limitations of Bayesian leave-one-out cross-validation for model selection’, Computational Brain & Behavior, 2(1), pp. 1-11.
Hyandman, R. J. (2014) Fast computation of cross-validation in linear models. Web.
Kelly, D. et al. (2020) ‘The experiences of cancer nurses working in four European countries: a qualitative study’, European Journal of Oncology Nursing, 49(1), pp. 1-10.
Kerr, H., Donovan, M. and McSorley, O. (2021) ‘Evaluation of the role of the clinical Nurse Specialist in cancer care: an integrative literature review’, European Journal of Cancer Care, 30(3), pp. 1-13.
Kopasker, D. et al. (2020) ‘Skill mix and patient outcomes: a multi-country analysis of heart disease and breast cancer patients’, Health Policy, 124(10), pp. 1074-1082.
Krishnamurthy, P. (2019) Understanding data bias. Web.
Lasater, K. B. et al. (2021) ‘Valuing Hospital investments in nursing: multistate matched-cohort study of surgical patients’, BMJ Quality & Safety, 30(1), pp. 46-55.
Lee, S. E. and Scott, L. D. (2018) ‘Hospital nurses’ work environment characteristics and patient safety outcomes: a literature review’, Western Journal of Nursing Research, 40(1), pp. 121-145.
Lin, E. (2017) Representativeness Analysis: how our data reflects the real labor market dynamics. Web.
Loken, E. and Gelman, A. (2017) ‘Measurement error and the replication crisis’, Science, 355(6325), pp. 584-585.
Longo, F. et al. (2017) ‘Do hospitals respond to rivals’ quality and efficiency? a spatial panel econometric analysis’, Health economics, 26(1), pp. 38-62.
Meng, Y. et al. (2020) ‘Cancer history is an independent risk factor for mortality in hospitalized COVID-19 patients: a propensity score-matched analysis’, Journal of Hematology & Oncology, 13(1), pp. 1-11.
National Cancer Registration & Analysis Service. (n.d) Incidence: base numbers. Web.
National Institute of Health. (n.d) 2014 ICD-9-CM Casefinding List. Web.
Needleman, J. et al. (2020) ‘Association of registered nurse and nursing support staffing with inpatient hospital mortality’, BMJ Quality & Safety, 29(1), pp. 10-18.
Pearl, J. A., et al. (2017) ‘Patient frailty and discharge disposition following radical cystectomy’, Clinical Genitourinary Cancer, 15(4), pp. e615-e621.
Philip, C. C., Mathew, A. and John, M. J. (2018) ‘Cancer care: challenges in the developing world’, Cancer Research, Statistics, and Treatment, 1(1), pp. 58-62.
Richardson, D. B. et al. (2017) ‘Observed and expected mortality in cohort studies’, American Journal of Epidemiology, 185(6), pp. 479-486.
Rosell, L. et al. (2018) ‘Benefits, barriers and opinions on multidisciplinary team meetings: a survey in Swedish cancer care’, BMC Health Services Research, 18(1), 1-10.
Rutz, O. J. and Watson, G. F. (2019) ‘Endogeneity and marketing strategy research: an overview’, Journal of the Academy of Marketing Science, 47(3), pp. 479-498.
Shi, L. et al. (2019) ‘Variable selection and validation in multivariate modelling’, Bioinformatics, 35(6), pp. 972-980.
Shin, S., Park, J. H. and Bae, S. H. (2018) ‘Nurse staffing and nurse outcomes: a systematic review and meta-analysis’, Nursing Outlook, 66(3), pp. 273-282.
Stedman, C. and Wigmore, I. (2019) Data integration. Web.
Tyrkiel, K. (2019) User segmentation 101 — how to use filters in user research. Web.
U.K Office for National Statistics. (2020) Employment by occupation. Web.
Ullah, S., Akhtar, P. and Zaefarian, G. (2018) ‘Dealing with endogeneity bias: the generalized method of moments (GMM) for panel data’, Industrial Marketing Management, 71(1), pp. 69-78.
Willis, G., Cave, S. and Kunc, M. (2018) ‘Strategic workforce planning in healthcare: a multi-methodology approach’, European Journal of Operational Research, 267(1), pp. 250-263.