McCarthy: Display of Data

McCarthy aimed to determine the demand of various food by Americans in the period around Independence Day (McCarthy). The results of the analysis showed that across the spectrum, beef had the highest sales ($803.9million), while tomato had the least sales ($114.7 million) (see fig.1).

Amount of revenue generated by various foods in the two weeks around Independence Day.
Fig. 1. Amount of revenue generated by various foods in the two weeks around Independence Day from Niall McCarthy; America’s favorite Fourth of July foods; 4 Jul. 2018.

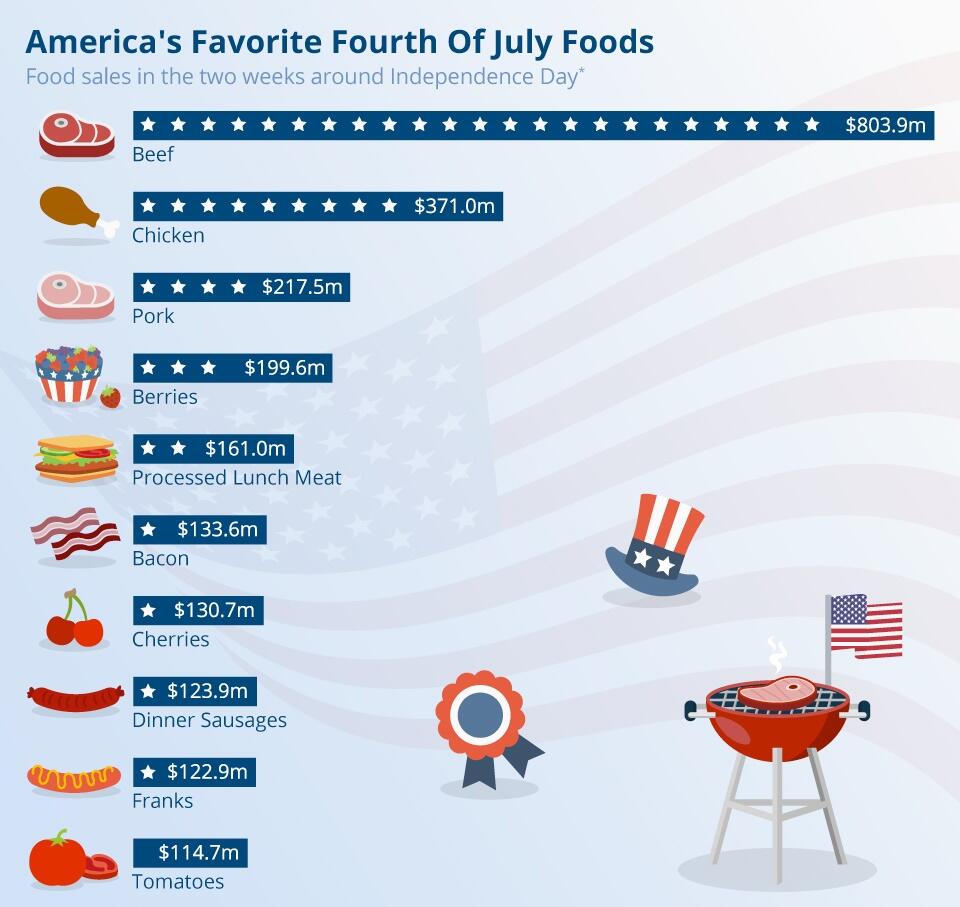
It is crucial for authors to properly display graphical information, as it allows the reader to easily comprehend the information being communicated. Wainer’s principles are the common standard through which graphs are evaluated. However, a review of Figure 1 suggests that it is concordant with some of the features presented in Wainer’s rules on the bad display of data. Apart aligning to Rule 1 and 2, other features of bad display of data present in the figure can be categorized under rule 10(b) and 10(d (Wainer). For example, the absence of gridlines with a scale of the amount of revenue generated on the x-axis aligned to Rule 10(b) – Label incorrectly.

This confuses the reader, as McCarthy had not justified the value of each star rating. On the other hand, the use of star ratings aligned to Rule 10(d) – Label ambiguously. It is seen that McCarthy star-rated various foods in the bar chart, in which bacon, cherries, diner sausages, and franks were all given a one-star rating.

Adherence of Figure 1 to Rule 10 (a), for instance, can be rectified by removing the star ratings to prevent confusion or justifying the value assigned to each star. Conversely, with regards to Rule 10(b), a different and more improved graph version can be obtained by adding grid lines and labeling the x-axis (see fig. 2).

A graph of the amount of revenue generated by various foods in the two weeks around Independence Day
Fig. 2. A graph of the amount of revenue generated by various foods in the two weeks around Independence Day from Author.

Works Cited

McCarthy, Niall. America’s Favorite Fourth of July Foods. Statista. 2018. Web.

Wainer, Howard. “How to Display Data Badly.” The American Statistician, vol. 38, no. 2, 1984, pp.137-147.

Cite this paper

Select style

Reference

StudyCorgi. (2021, July 31). McCarthy: Display of Data. https://studycorgi.com/mccarthy-display-of-data/

Work Cited

"McCarthy: Display of Data." StudyCorgi, 31 July 2021, studycorgi.com/mccarthy-display-of-data/.

* Hyperlink the URL after pasting it to your document

References

StudyCorgi. (2021) 'McCarthy: Display of Data'. 31 July.

1. StudyCorgi. "McCarthy: Display of Data." July 31, 2021. https://studycorgi.com/mccarthy-display-of-data/.


Bibliography


StudyCorgi. "McCarthy: Display of Data." July 31, 2021. https://studycorgi.com/mccarthy-display-of-data/.

References

StudyCorgi. 2021. "McCarthy: Display of Data." July 31, 2021. https://studycorgi.com/mccarthy-display-of-data/.

This paper, “McCarthy: Display of Data”, was written and voluntary submitted to our free essay database by a straight-A student. Please ensure you properly reference the paper if you're using it to write your assignment.

Before publication, the StudyCorgi editorial team proofread and checked the paper to make sure it meets the highest standards in terms of grammar, punctuation, style, fact accuracy, copyright issues, and inclusive language. Last updated: .

If you are the author of this paper and no longer wish to have it published on StudyCorgi, request the removal. Please use the “Donate your paper” form to submit an essay.