Convertible variable’s influence on asking price for used Mustang cars
Scatter plot
The initial assessment of the relationship between two variables is done by the pictorial representation of a scatter plot. The scatter plot for our data will be not similar to the ordinary one as the independent variable is dichotomous taking any one of the two values zero and one. The scatter plot between the price and the option of the convertible is as follows.
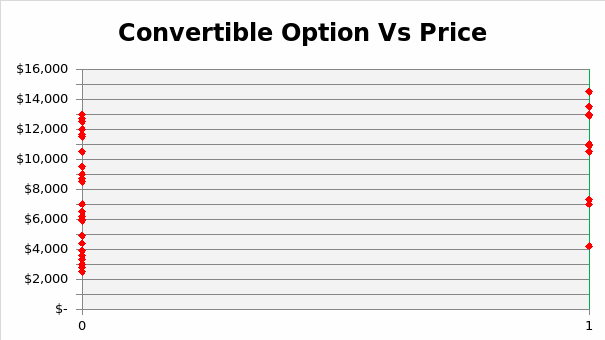
The X-axis represents the independent variable, the option of convertible and the Y-axis represents the dependent variable, price. The relationship seems to be positively correlated. It looks like that the cars with convertible option get more price than the cars without the convertible option. We can more accurately analyze it using the regression and hypothesis tests as follows.
Regression analysis
Regression analysis fits the relationship between the variables in the form equation. Simple linear regression involves fitting an equation involving one independent variable. The main objective of the regression analysis is to estimate the response variable (dependent variable) for the given explanatory variable (independent variable). It uses the least-squares method, which uses normal equations to minimize the standard error.
The general form of the equation of regression is Y = a + bX. ‘a’ is termed as the intercept and ‘b’ is termed as the slope parameter. The intercept parameter is the average value of the response variable in the absence of the explanatory variable. The slope parameter is the average increase of the response variable when the explanatory variable increases by one unit. The slope parameter defines the significance of the variable. Using the regression tool of excel, the following table of regression analysis is obtained.
The regression equation is Y = 7281.2 + 3194.4 X.
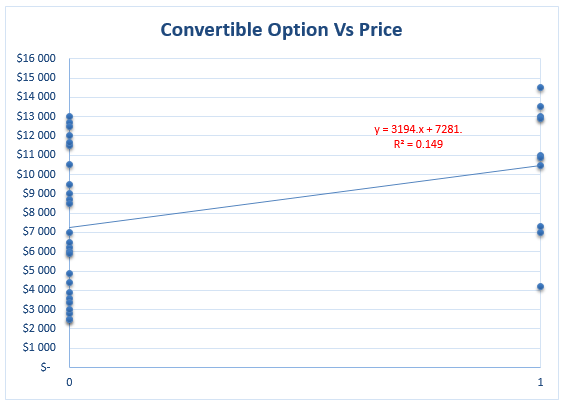
The intercept parameter 7281.2 indicates the average price of the cars when the convertible option is not available. The slope parameter 3194.4 indicates the average increase in the price if the convertible option is present. The value of the coefficient of determination ( R2) is the measure of the total variability explained by the model. The goodness of fit of data depends on this measure. The R2 value is 0.15 indicates that only 15% of the variability is explained by the model. Hence the goodness of fit is questionable.
Hypothesis tests
Now we are at a stage check the reliability of the model so that this equation is relevant to the total population of cars. We aim to determine the relevance of the slope parameter as it is the variable that influences the response variable.
Inference of slope parameter:
Null hypothesis: Slope parameter is zero. b = 0.
Alternate hypothesis: The slope parameter is not equal to zero. b ≠ 0.
The test statistic: The T-test is the relevant value. The following table summarizes the test statistic.
The critical values for the t-test at a 5% level of significance for 34 degrees of freedom are ± 2.032. Since the t score is out of the region of acceptance, we have strong evidence against the null hypothesis at a 5% level of significance. So we can reject the null hypothesis and can conclude that the slope parameter is not equal to zero. It summarizes that the convertible variable has an impact on the prices.
Finally, we can check the significance of the variable using ANOVA.
The ANOVA table is as follows:
The p-value for the F test is 0.02164 which is less than the level of significance of 5%. Hence the variable is of significance.
From the above analyses and discussions, we can conclude that the convertible options of the mustang cars lay sufficient influence on the prices.