Analysis of Next plc’s Financial Ratios
The paper aims to examine Next plc’s financial accounts (see Appendix) to understand the dynamics of its performance. First, financial ratios for 2021-2023 are calculated, including Net Profit Margin, Gross Profit Margin, Debtor (Receivable) Days, Creditor (Payable) Days, Return on Capital Employed, and Net Asset Turnover. Then, based on the calculated ratios, the paper describes the financial performance of Next plc over three years. Finally, the paper explains how the company has reduced leverage (borrowing) to increase its profit during the period 2021 to 2023.
Calculation of the Financial Ratios
Net Profit Margin
![]()
![]()
![]()
![]()
Gross Profit Margin
![]()
![]()
![]()
![]()
Debtor (Receivable) Days
![]()
![]()
![]()
![]()
Creditor (Payable) Days
![]()
![]()
![]()
![]()
Return on Capital Employed
![]()
![]()
![]()
![]()
Net Asset Turnover


Financial Performance of Next plc Over Three Years
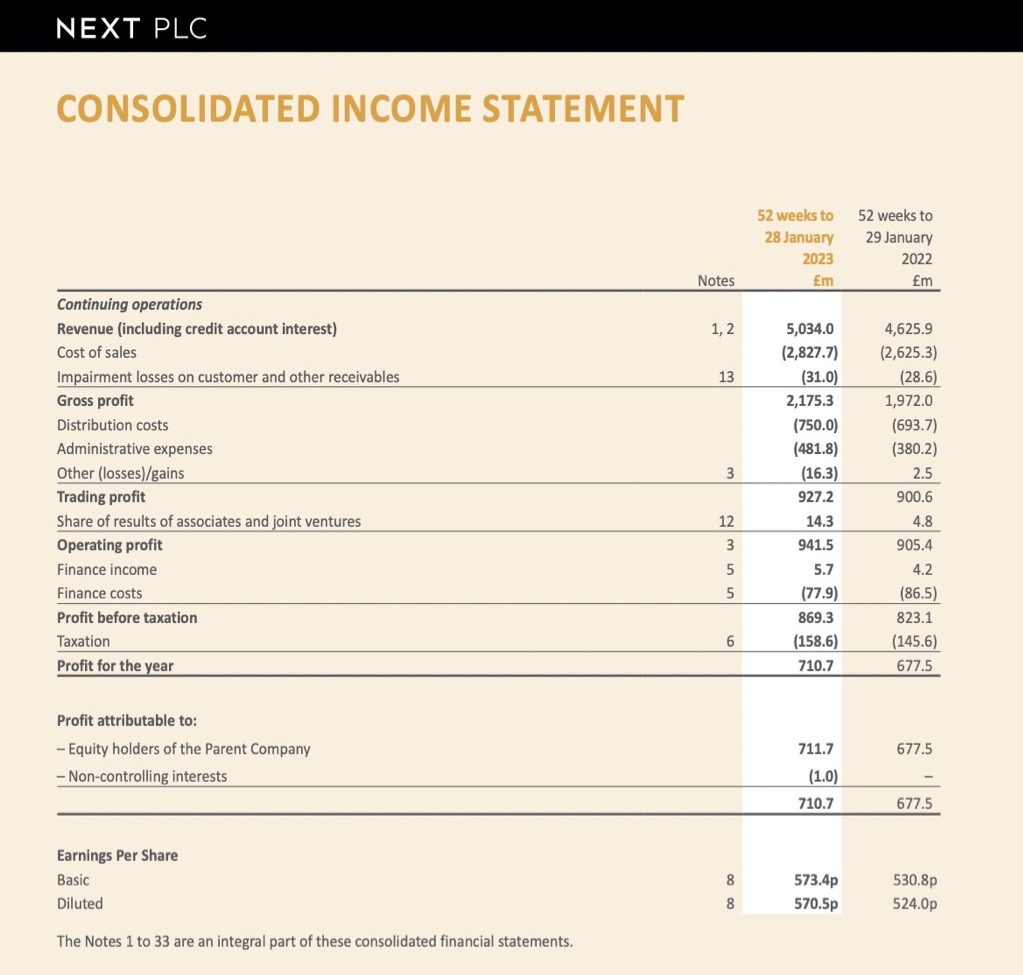
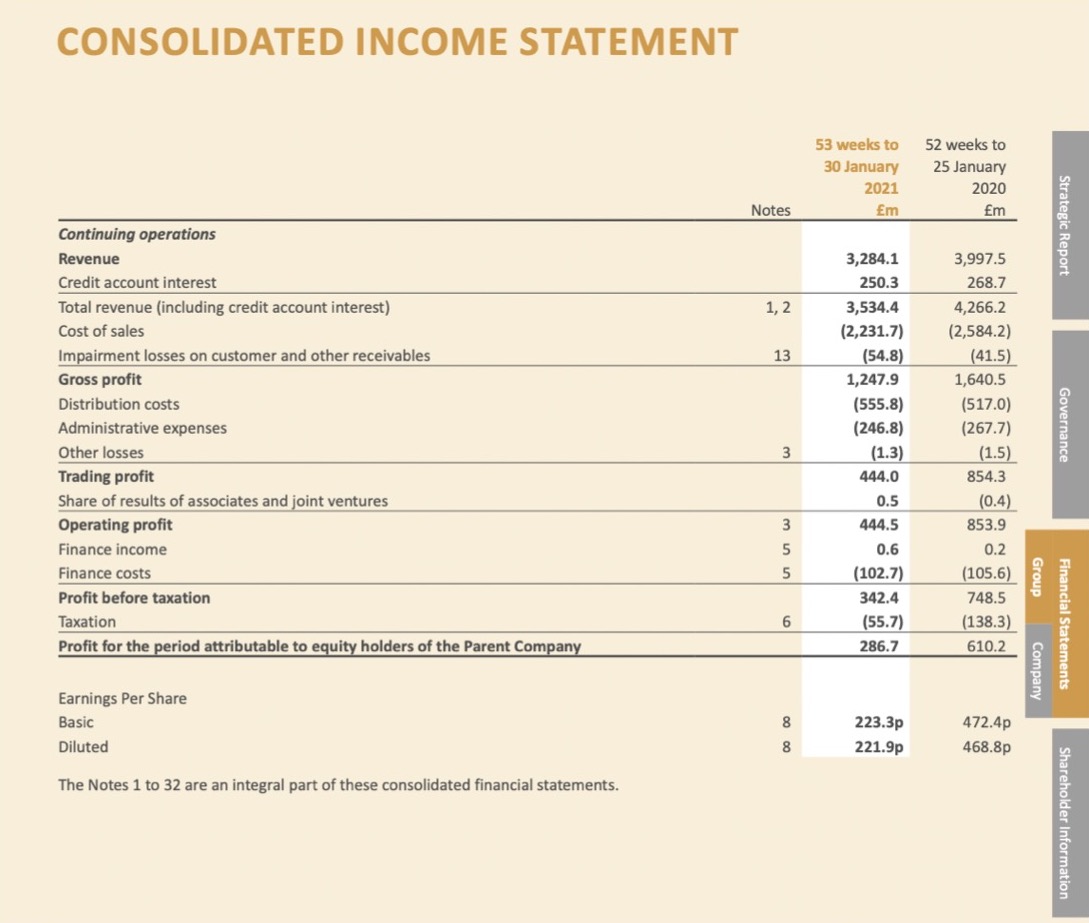
The various financial ratios depict NEXT PLC’s financial performance and position. The company’s net profit margin ratio varies significantly from 2021 to 2023. The organization registers a rapid growth in this ratio from 2021 to 2022, after which it declines slightly. The net profit ratio is the portion of sales revenue a firm retains after settling all costs, including taxes and interest (Paramasivan & Subramanian, 2009).
Thus, the sharp increase in 2022 indicates that NEXT PLC retained more revenue for the year, generally implying a healthy performance for the entity. However, the business must implement better strategies to ensure continuous growth and realize expansion financing and financial stability. The company’s gross profit margin changed from 35.3% in 2021 to 42.6% in 2022 and then 43.2% in 2023. The gross profit margin ratio designates the fraction of each dollar of revenue a firm retains as gross income. Thus, NEXT PLC progressively increased its gross profit over the three years. Maintaining such a trend implies the company’s potential to finance growth without depending on heavy borrowing in the future.
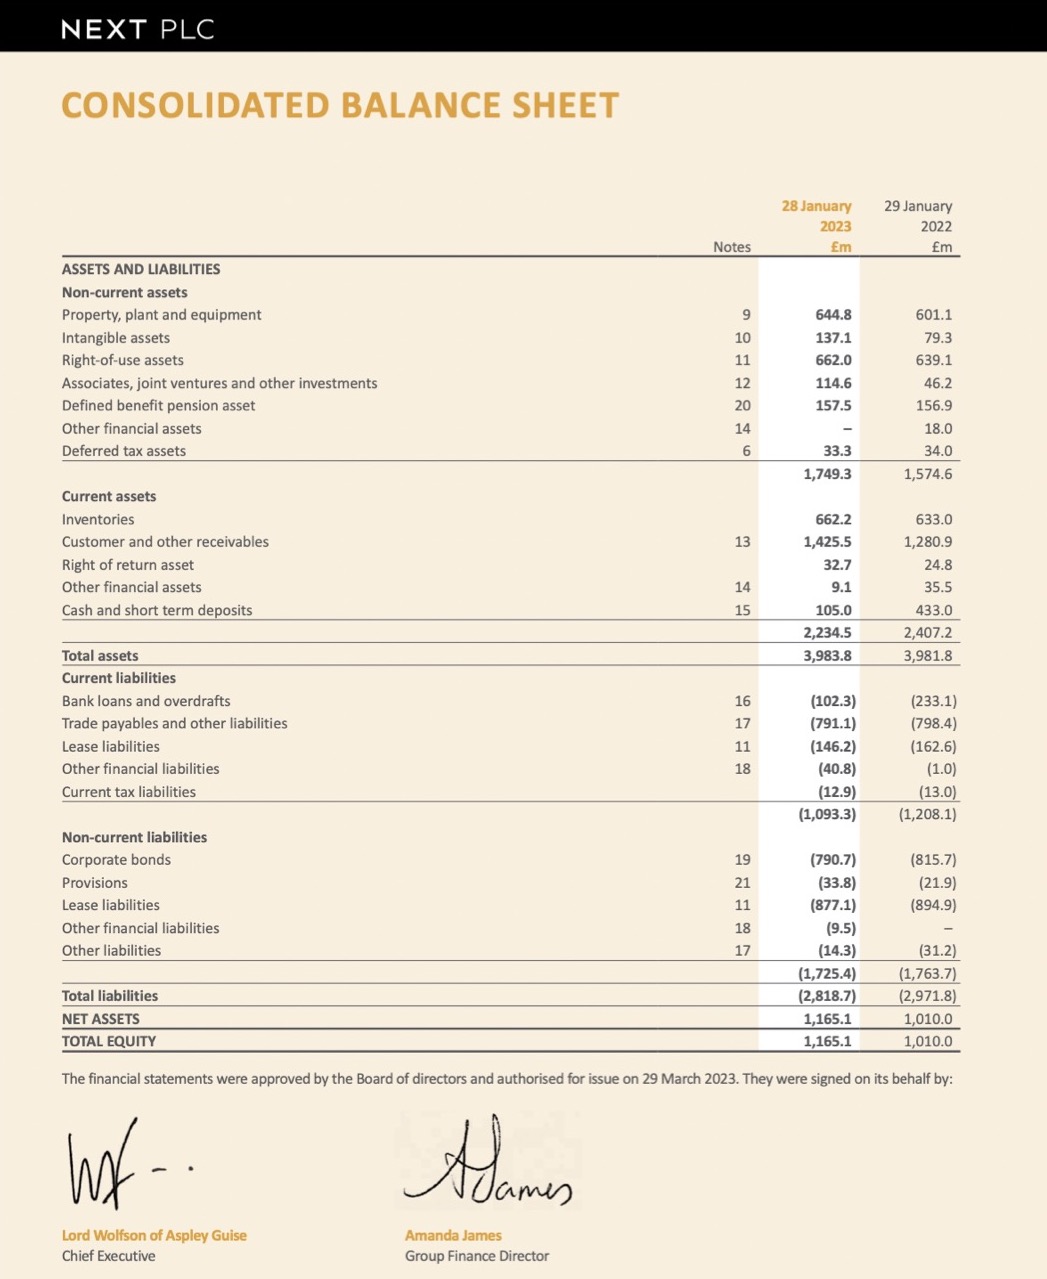
The debtor days ratio shows a corporation’s liquidity, with the figure indicating the interval it takes for trade debtors to pay their bills. A higher debtor-days ratio indicates that debtors receive excessive credit periods, which may harm the business’s financial stability. On the other hand, a reduced debtor-days ratio implies greater efficiency in collecting outstanding amounts. NEXT PLC’s receivable days quotient declined from 2021 to 2022 but increased slightly in 2023. The data imply the corporation’s determination and potential to improve this performance measure. Creditor days increased from 90.8 days to 111 days between 2021 and 2022, but were reduced to 102 days during 2023. The ratio shows the average number of days it takes a firm to pay its suppliers.
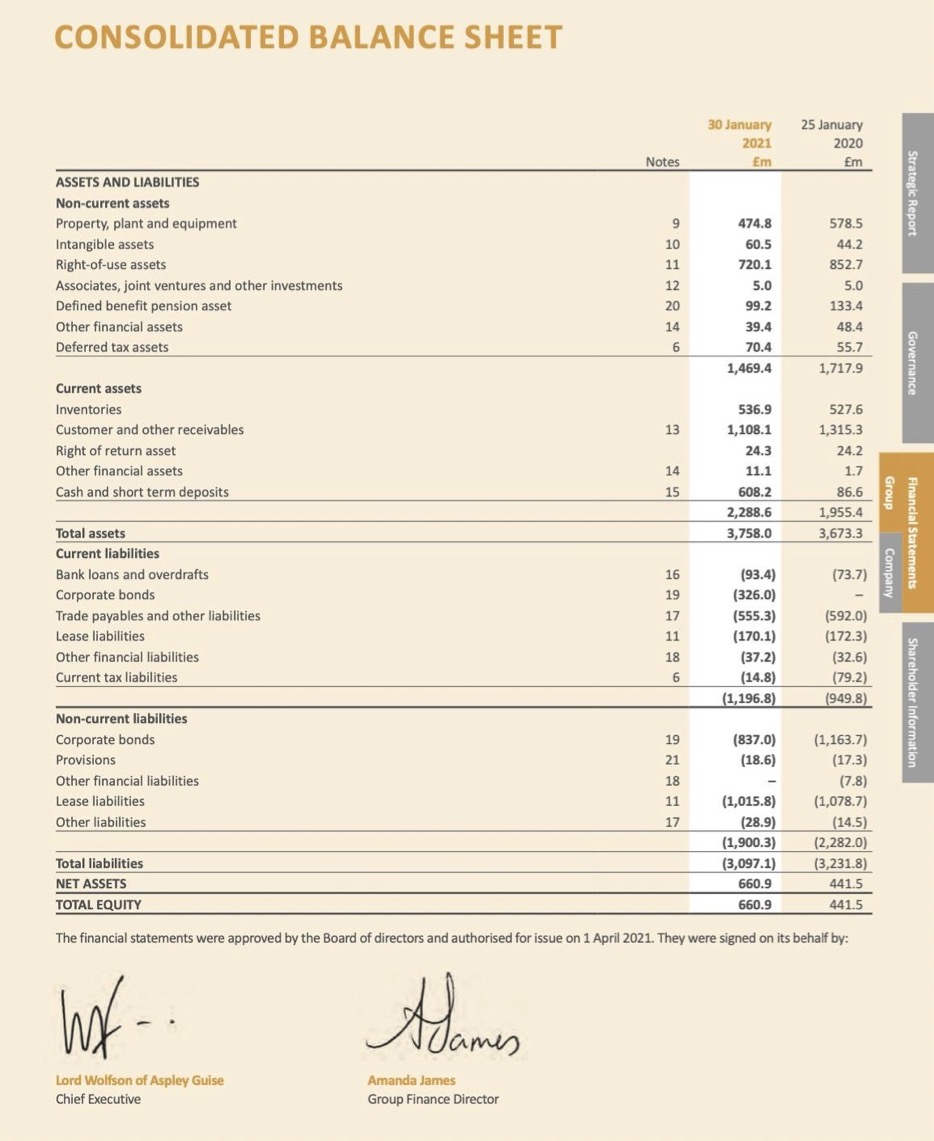
Creditor days affect a firm’s cash flow: taking longer to repay suppliers increases working capital on the balance sheet. Return on capital employed (ROCE) is a financial ratio that measures a business’s profitability and the efficiency with which it uses capital to generate income. NEXT PLC’s ROCE increased from 17.4% to 32.6% between 2021 and 2022 and remained constant from 2022 through 2023. The data shows the company’s increased ability to generate more revenue per invested dollar. Lastly, NEXT PLC’s asset turnover ratio improved from 0.88 in 2021 to 1.2 in 2022 and 1.3 in 2023. The rising ratio indicates the corporation’s growing efficiency in generating income from its properties.
Explanation Behind the Reduced Leverage for Profit Increase
NEXT PLC operated without long-term debt for three years, from 2021 through 2023. The organization mainly used equity offerings, primarily through corporate bonds, to raise capital. Leasing property, rather than buying or renting, reduces the corporation’s need for hefty capital for operations, thereby reducing the need to borrow from banks or other financial institutions.
Paramasivan and Subramanian (2009) note that companies use borrowing-reduction strategies to boost profit margins because the plan cuts interest expenses and improves the business’s overall financial health. Other schemes applied by NEXT PLC to reduce leverage include debt repayment using its excess cash flow, cutting redundant expenses, improving operational efficiency, and increasing equity through the issuance of new shares and retaining earnings. The approaches make cash available to pay off debt and reduce overall borrowing.
Reference
Paramasivan, C., & Subramanian, T. (2009). Financial management. India: New Age International (P) Limited, Publishers.
Appendix