Nike Company Analysis: Introduction
This paper is a critical analysis of Nike, an American based fashion and apparel company. Key sections of this document provide an evaluation of the company’s external environment, its market share, internal operational dynamics and critical factors that influence its performance. The last section of the report outlines key recommendations the company’s managers should adopt to remain relevant in its key market segments. However, before delving into these details, it is important to first review Nike’s share perfromance. Figure 1 below shows that the company has had a positive share performance in 2018.
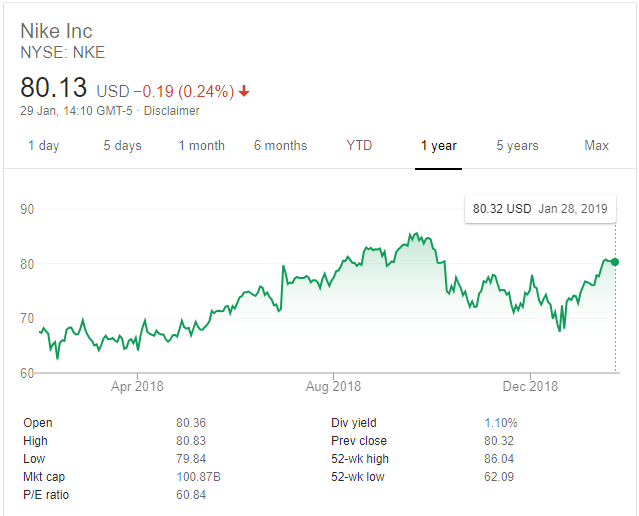
According to figure 1 above, Nike’s share price steadily increased throughout 2018. The highest price reported within the year was $85.55, while the lowest was $62.49. In addition, throughout the year, the firm’s stock outperformed other companies within the same category, such as Amazon and Netflix (Google Markets 2019). Experts have characterised Nike’s shares as “a growth stock,” because in 2018, investors received a 20% return on their money (Google Markets 2019).
The firm’s impressive stock performance could be attributed to its ability to insulate its bottom-line performance from competitive pressures. At the, same time, Nike’s share variances should be contextualised within the larger context of its overall stock performance in the past two decades because, in 17 years, it has registered a high dividend payout ratio compared to its competitors (Google Markets 2019).
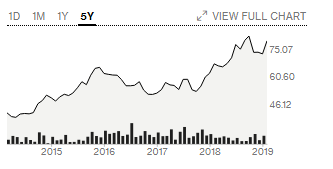
For example, the positive performance in 2018 aligns with the $0.02 per share increase in its quarterly dividend payment. The trend dates back to 2014 (Google Markets 2019). Therefore, the positive stock performance of 2018 is part of a continuous growth trend, which started 17 years ago. Indeed, figure 2 below shows that the 2018 share performance was part of a larger growth trend that started in 2014.
Nike Company Analysis: Market
Nike has a significant market share in the global apparel industry. Figure 3 below shows that North America is the company’s main market. Europe, Middle East, and Africa are the second largest markets, while China and the Asia Pacific regions provide the least revenue for the company.
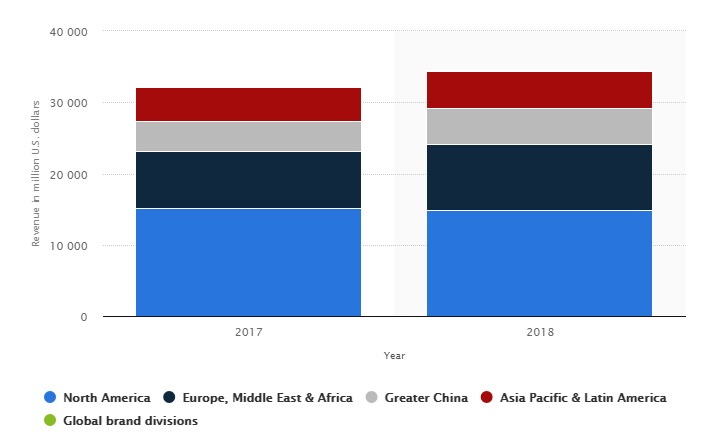
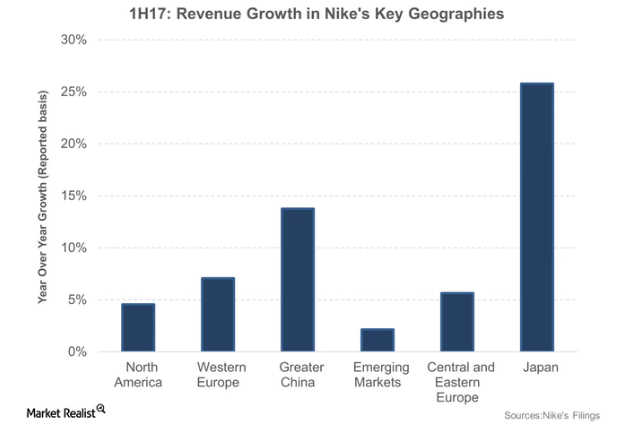
Although figure 3 above shows the importance of the North American market to Nike’s success, other key market segments have the potential to increase its revenues. For example, figure 4 below shows that Japan is the leading growth market for the fashion brand because it accounts for up to 25% of Nike’s annual growth (Statista 2019). China is also another emerging market because it accounts for about 14% of its revenue (Statista 2019). Western Europe, Central Europe, Eastern Europe, North America and other countries are also important to the company’s growth strategy because they account for 7%, 6%, 5% and 3% of the firm’s revenue for growth markets.
Nike Essay: Macroeconomic Analysis
Inflation
Variations in inflation rates have influenced customers’ purchasing power in the apparel industry. This index has a significant impact on sales because high rates mean that fewer customers buy fashion products, while low inflation rates mean that more customers buy new goods. There has been a general rise in interest rates in most global markets. For example, in figure 5 below, Giles (2018) from the Financial Times reports that the inflation rate in the UK has steadily increased between October 2015 and April 2018.
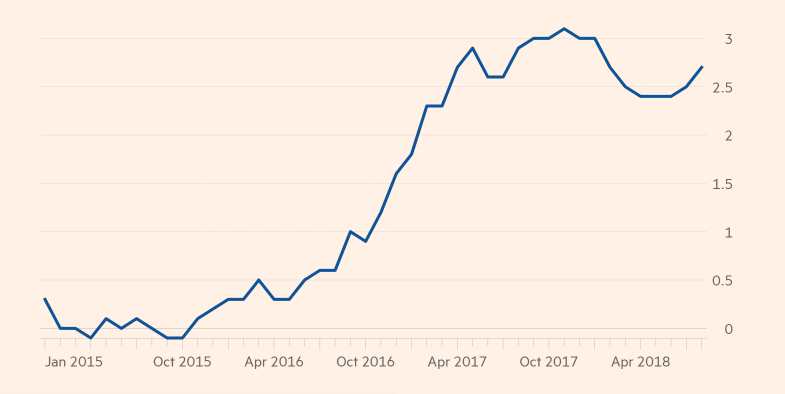
The increase in inflation rates means low liquidity within the market, as more people will be hesitant to spend money. This development could affect the bottom-line performance of fashion companies because their products have elastic demand. Overall, the increase in interest rates means that there could be an increase in the consumer price index, which could negatively affect profitability (Camarda 2018).
Unemployment
There has been a decrease in unemployment rates across major global economies (Camarda 2018). For example, since the 2007/2008 global financial crisis, the unemployment rate in the US has significantly declined from 10% in 2009 to 4% in 2019 (Camarda 2018). There has been a similar reduction in the UK unemployment rate because, in 2011, this figure was 8.3% and in 2018, it was 3.9% (Camarda 2018). Figure 6 below shows the general decline in unemployment rate within the UK from 2014 to 2018.
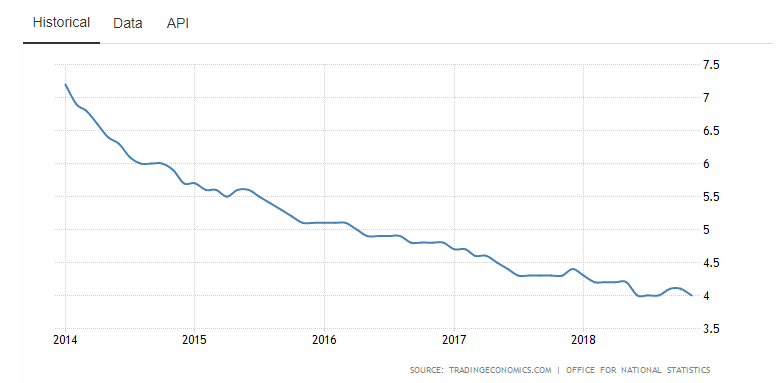
The low unemployment rate has a significant bearing on the cost of production in the apparel industry because it could increase overheads, as there will be fewer people willing to work for lower wages.
Currency
Currency fluctuation has a significant impact on the fashion and apparel industry because of its global nature. This macroeconomic force could influence the industry’s performance by increasing the cost of production. For example, Camarda (2018) says that recent plummeting exchange rates in Switzerland have affected the cost of raw materials. These exchange rates have a significant impact on the fashion and apparel industry because companies often earn revenue and incur operational costs in varied currencies. The impact of such fluctuations is prevalent in the apparel industry because of its global nature.
Evidence of the impact of currency fluctuations on the fashion and apparel industry was seen in 2015 when Switzerland delinked its Swiss Franc from the European Union and local apparel companies immediately incurred a 15% rise in operating costs (Camarda 2018).
“Brexit”
The uncertainty regarding the exit of the UK from the European Union has had an impact on the fashion and apparel industry by making it difficult to plan in an uncertain economic environment. The uncertainty has a significant impact on labour relations, tax computations and even profit repatriation. The negative effect of “Brexit” on the fashion industry can be observed through the unwillingness of fashion designers to vote for the exit of Britain from the European Union (Cook 2017). For example, a recent report pointed out that “Brexit” would limit access to top-tier talent for British fashion designers (Cook 2017).
Nike Essay: Internal Analysis
Nike Company Analysis: Change of Leadership
Nike has recently reported changes in its leadership structure. These variations are set to improve the company’s competitive position and brand image because they will promote inclusivity, respect and empowerment of employees (Nike Inc. 2018). Changes in leadership have also promoted diversity and inclusion in the organisation (Nike Inc. 2018). Overall, these developments create an environment where employees feel appreciated in promoting the company’s success.
Nike Company Analysis: New Products
Nike’s product strategy is consistent with the goal of athlete advancement. For example, the company’s products have demonstrated innovation in cushioning platforms (Nike Inc. 2018). Nike React is one new product that is borne from its innovative strategy. Nike Air is another product that demonstrates the company’s capability to develop functional and popular product designs. Generally, the company’s product strategy is predicated on progress and athlete advancement (Nike Inc. 2018).
Nike Essay: Change in Structure of the Business
Nike is considering making changes to its business structure by integrating its brick-and-mortar business with digital platforms (Nike Inc. 2018). This strategic shift in its operational plan is aimed at improving sales because the firm has realised that the traditional model of retail did not accommodate dialogue. The business change is largely highlighted in the corporation’s new business product – House of Innovation (Nike Inc. 2018).
Nike Essay: Objectives, Mission, and Vision
Vision Statement: “To remain the most authentic, connected and distinctive brand” (Smithson 2018, p. 2).
Mission Statement: “To bring inspiration and innovation to every athlete in the world” (Smithson 2018, p. 2).
Objectives
- To protect and improve the company’s position as the top brand in athletics
- To grow the fitness market by establishing a strong momentum
- To direct and manage Nike’s global business in emerging markets
- To support increased margins through the proper execution of business strategies
Nike Company Analysis: Business Legal Structure
Nike is a publicly listed company. This means that the company’s ownership structure is modelled within a shareholding framework. Within this setup, the corporation’s shares are freely traded in the stock exchange market. As a publicly traded company, Nike has limited liability. In other words, the company can sue or be sued in the same manner as an individual does.
Nike Company Analysis: Organizational Structure
Nike’s organisational structure reflects differences in regional markets. Therefore, it is designed to address variations in regional market performance. According to the geographic distribution of the company’s structure, this framework has three key divisions, which include global corporate leadership, semi-autonomous geographic divisions, global segments for contrast and brand licensing (Thompson 2018). Under the global corporate leadership department, which is based in Oregon, USA, the company operates 12 key subsidiaries, which include Office of the President, Nike Brand, finance, global human resource management, merchandising department, the legal department, global sports marketing and operations (Thompson 2018).
In the semi-autonomous geographic division, the company operates six key entities, which include North America, Western Europe, Central/Eastern Europe, China, Japan and emerging markets. Lastly, the global division for merchandising has converse and brand licensing departments (Thompson 2018). Nike’s robust organisational structure has supported the company’s success and strengthened its organisational performance. Therefore, it is one of the company’s key strengths.
Nike Company Analysis: Financial Performance
Nikes’ profitability has increased in the past five years from a low of $9 billion in 2011 to a high of $15 billion in 2017 (Pratap 2018). This profitability index is commensurate with a similar pattern in the company’s revenues. Indeed, within the past five years, the company’s revenues have increased from $20 billion in 2011 to $34 billion in 2017 (Pratap 2018). In 2016, the firm owned $2 billion to its creditors (Downie 2016).
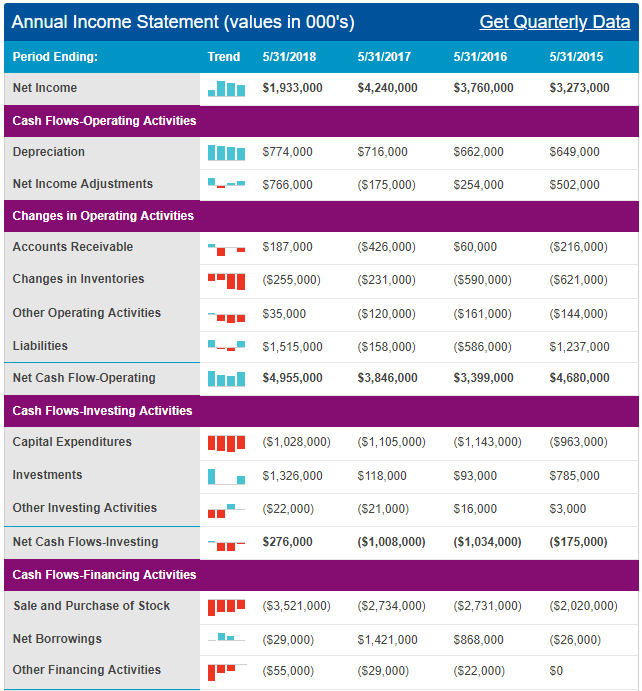
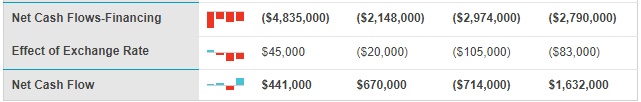
This debt was distributed across different financial instruments because $7 million was short-term and $66 million was long-term (Downie 2016). Most of the debt ($1.99 billion) was in form of bonds (Downie 2016). The $2 billion debt mentioned above represents an increase in the company’s liabilities because, in 2015, this figure was only $1.3 billion and in 2014, it was $1.4 billion (Downie 2016). Nonetheless, Nike’s profitability and revenue show that the company is in good financial health. Its income, cash flow and profitability statements, which appear in appendices 1, 2 and 3 represent a broader understanding of the company’s financial performance.
Nike Company Analysis: Conclusion and Recommendations
Conclusion
Critical issues that could affect Nike’s performance include technology and increased competition. Technology is a critical success factor because it is changing how Nike conducts its business. The company’s ability to succeed in the digital marketplace will determine how well it will remain relevant in today’s fast-paced world. Competitive rivalry is also another key success factor that will shape the company’s performance.
Although this force has traditionally affected the firm’s profitability, it remains one of its key threats. Particularly, the competition Nike will experience from some of its traditional rivals, such as Adidas and Puma, will shape the company’s success. In addition, the firm should be cognizant of the fact that it is the leading footwear company in the world and consequently needs to improve its marketing strategy to remain at the top.
Recommendations
As highlighted above, two critical issues that could affect Nike’s business operations are technology and business rivalry. The process of overcoming technological challenges depends on the company’s ability to embrace digital marketing strategies. Nike has shown promise of adopting a digital business strategy because it has integrated its brick-and-mortar business with its digital marketing strategy to create a hybrid business plan that would channel the company’s future sales (Nike Inc. 2018).
Lastly, to overcome competition, Nike needs to consistently innovate and revamp its marketing strategy to remain relevant and communicate to its customers about new products. This strategy has yielded significant levels of success, as seen through the launch of Nike Air and some of its traditional brands, such as Nike Jordan. By investing more resources in its research and development plan, the company should come up with more interesting and innovative products to maintain its market dominance.
Reference List
Bells, S 2017, What are Nike’s key markets.
Bloomberg 2019, Nike: US. Web.
Camarda, B 2018, Exchange rate shifts can buffet luxury brands. Web.
Cook, G 2017, Brexit poses serious risk to UK fashion industry. Web.
Downie, R 2016, Nike stock: capital structure analysis (NKE). Web.
Giles, C 2018, ‘UK consumer inflation accelerates in August’, Financial Times. Web.
Google Markets 2019, Nike’s share price. Web.
Nasdaq 2019, NKE company financials. Web.
Nike Inc. 2018, The defining innovations and products of 2018. Web.
Pratap, A 2018, Nike financial history. Web.
Smithson, N 2018, Nike Inc.’s mission statement & vision statement (an analysis).
Statista 2019, Nike’s revenue worldwide from 2017 to 2018, by region (in million U.S. dollars).
Thompson, A 2018, Nike Inc. organizational structure characteristics (analysis).
Trading Economics 2019, United Kingdom unemployment rate.
Appendices
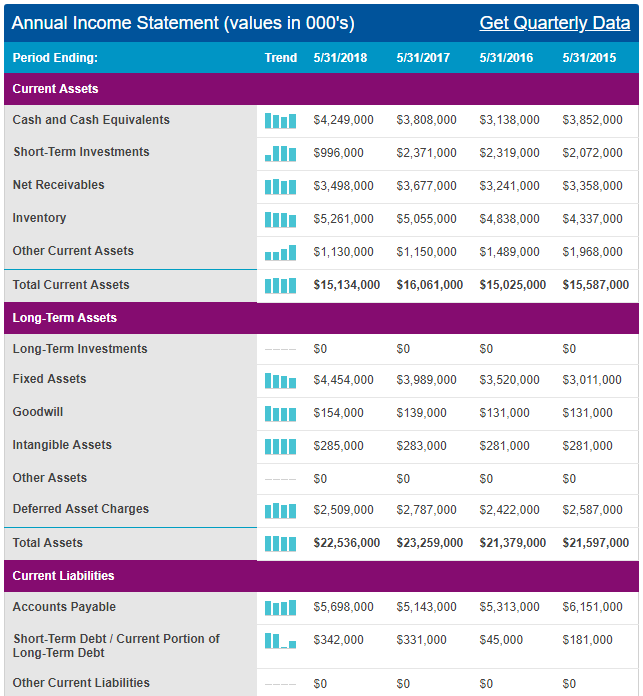
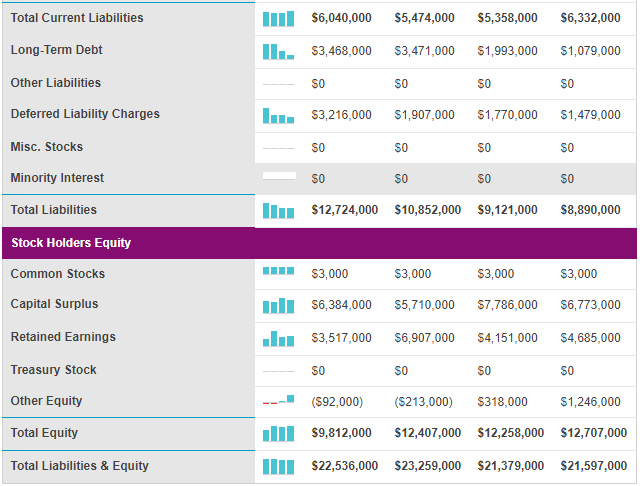
Appendix 1: Balance Sheet
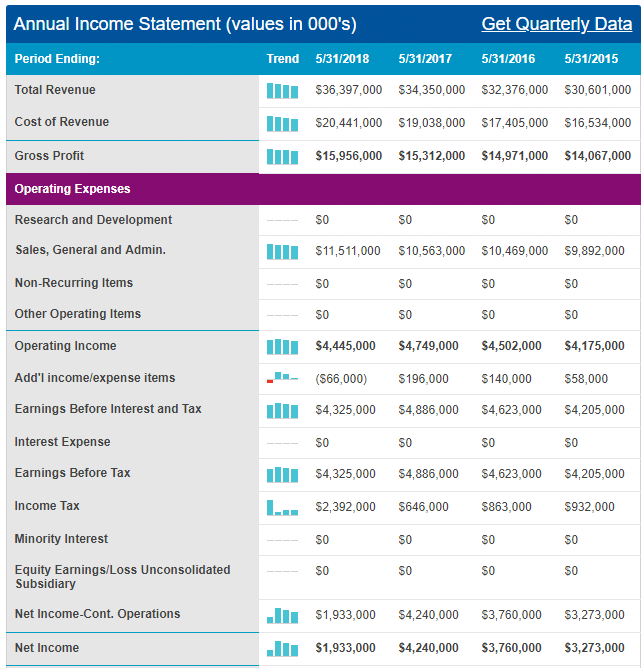
Appendix 2: Income Statement
Appendix 3: Cash Flow Statement