
Scope and Descriptive Statistics
Statistical analysis is a valuable instrument for making business decisions regarding product lines and potential expansion. Pastas R Us, Inc. has collected data from its 74 restaurants on five core variables: sales per square foot, customer education level, median income, median age, and loyalty card use. The main objective of the present report is to analyze this information and propose relevant recommendations to help the company make knowledgeable decisions on expansion. The descriptive findings demonstrate that restaurants’ profits depend significantly on customers’ socioeconomic and demographic characteristics. However, a more thorough analysis of variable relationships is necessary for definitive conclusions, which are discussed further in the report.
Analysis
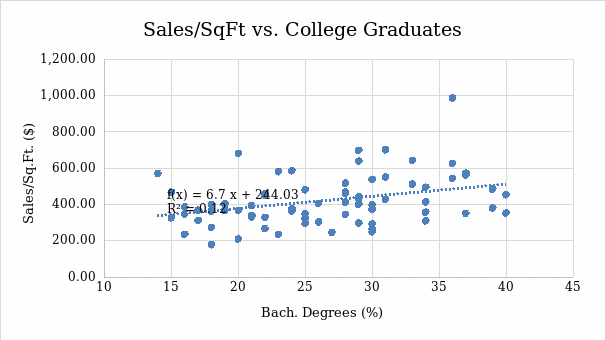
The relationship between the core profitability variable (sales/SqFt) and the four related characteristics is depicted in scatter plots; each should be examined in detail to understand business trends. The first chart shows the association between sales and customer education level, or the percentage of consumers with bachelor’s degrees (see Figure 1). As seen from the plot, the connection is relatively linear, substantial, and positive.
Each entry is located close to the regression line, and the slope is upward. In general terms, it means restaurants are more profitable when they have more educated customers living within a 3-mile radius, as required by the company’s expansion strategy. While the chart shows one outlier, the findings remain conclusive and confirm the positive correlation between sales and education.
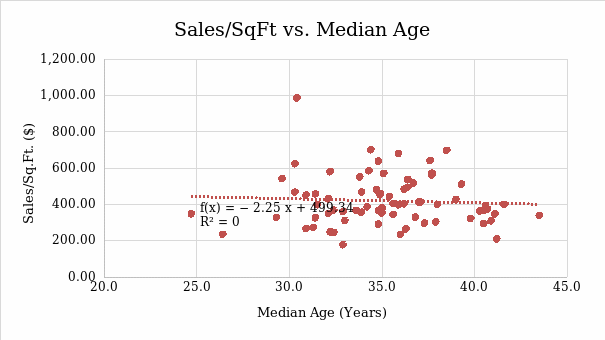
Regarding the connection between sales and median age/median income, establishing their exact relationship is significantly more challenging. Namely, the scatter plot for the former shows a weak association, as indicated by a slight negative slope and relatively large deviations of the entries from the regression line (see Figure 2). The data are more spread than for education level, and the minuscule downward slope is due to one outlier on the left.
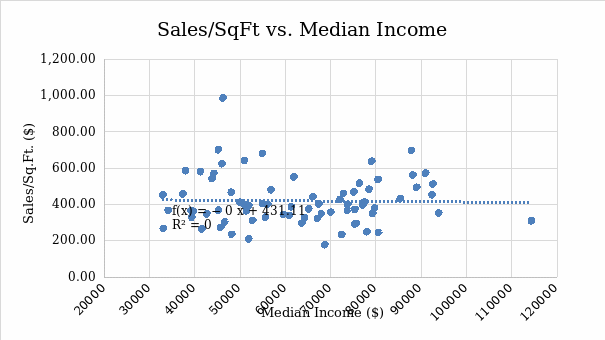
Consequently, the regression line for the sales/SqFt vs. median income scatter plot is flat (see Figure 3). It implies that there is no specific relationship between the two variables, and people of varying incomes eat at Pastas R Us restaurants. The data are also significantly spread vertically, further confirming a weak association among the examined characteristics.
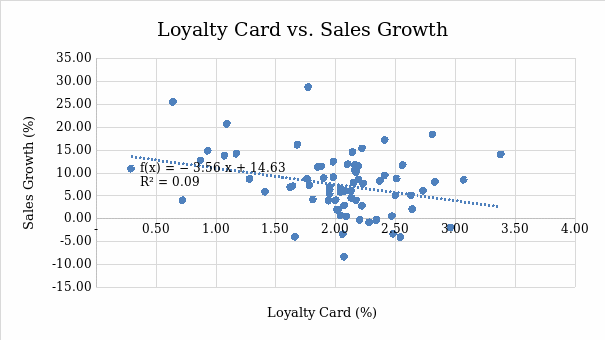
Finally, the last scatter plot takes a unique approach, examining the relationship between sales growth and loyalty card use. The surprising finding is that their association is negative, as demonstrated by the downward regression line (see Figure 4). It means that, in general, the more people use loyalty cards, the less profitability grows.
However, this conclusion is ambiguous because the core cluster of entries is located at approximately 7% growth and 2% in loyalty card use. The rest of the data is spread widely, with several outliers that slightly skew the line (more on the left). Therefore, while the trend is negative, it does not necessarily mean that loyalty programs are detrimental to the business. Instead, it suggests that minor modifications may be appropriate to improve overall profitability.
Recommendations and Implementations
Based on the scatter plot, restaurant profitability is largely dependent on customers’ average education level. While it might seem surprising at first, extensive research confirms that education is a critical driver of consumer behavior (Chou et al., 2020). Therefore, when considering the expansion strategy, it is appropriate to prioritize areas with a large number of educated individuals rather than focusing on other criteria.
After all, age and income appear to have little to no impact on restaurant profitability, suggesting that Pastas R Us offers a fairly balanced menu that caters to diverse demographic groups with varying socioeconomic profiles. At the same time, it could also mean that the existing strategy is well developed, as all customers fit the initial criteria (25-45 years old and higher income than the national average). Finally, it might be appropriate to adjust the age and income criteria to test whether other demographic groups are more profitable customers. For example, focusing on the younger population through intelligent marketing could attract new consumers.
Secondly, loyalty programs appear to be negatively correlated with sales growth, suggesting adjustments are necessary. As briefly mentioned earlier, this does not imply that loyalty cards are detrimental to business; on the contrary, extensive research confirms that this policy is effective (Gorlier & Michel, 2020). Even for Pastas R Us, the vast majority of data entries indicate positive sales growth, despite the negative trend being concerning. It means the company should continue the policy, but adjust the upper tier of loyalty card use (2.5%+) by introducing additional rewards.
Thirdly, based on the findings, Pasta R Us should concentrate on a specific demographic group consisting of educated individuals and make some changes to other expansion criteria. Since there is no evidence that age and income are statistically significant, education level is the core profitability parameter in this case. The firm might adopt new policies and change its brand image to attract new customers, such as younger people or low-income individuals, but it can also cause unnecessary risks.
Consequently, it is imperative to note that general statistical data cannot fully represent the actual state of the restaurants. Namely, local culture and communities are critical factors that determine how people perceive the company and engage with it (Chou et al., 2020). Assuming Pasta R Us wishes to change its expansion criteria, it should also consider interpersonal factors, as attracting new customers through marketing might deter loyal consumers (Chou et al., 2020). Based on the present findings, choosing education level as the core metric and adjusting other criteria do not contradict interpersonal causes, as the changes are not drastic.
Finally, continuous monitoring and evaluation are necessary to ensure that recommendations are effective. Since education level is the main parameter, the census is more appropriate in this case because it is better suited to collecting quantitative data than surveys. On the other hand, occasional surveys could supplement decision-making by providing in-depth qualitative insights into why customers choose Pastas R Us over other restaurants in the local area.
References
Chou, S. F., Horng, J. S., Liu, C. H. S., & Lin, J. Y. (2020). Identifying the critical factors of customer behavior: An integration perspective of marketing strategy and components of attitudes. Journal of Retailing and Consumer Services, 55, 1-11.
Gorlier, T., & Michel, G. (2020). How special rewards in loyalty programs enrich consumer–brand relationships: The role of self‐expansion. Psychology & Marketing, 37(4), 588-603.