Introduction
This research report discusses pricing issues for real property values for Canada’s detached houses. Data were obtained from census metropolitan areas in British Columbia and Ontario in 2017, and a sample of twenty values was generated for statistical analysis. The analysis includes the use of descriptive statistics tools to identify underlying trends in the sample, as well as exploring whether they can be extrapolated to the population. The report reinforces knowledge of the elements of statistical analysis by solving a practical scenario, as well as confirming proficiency in MS Excel for calculations.
Discussion
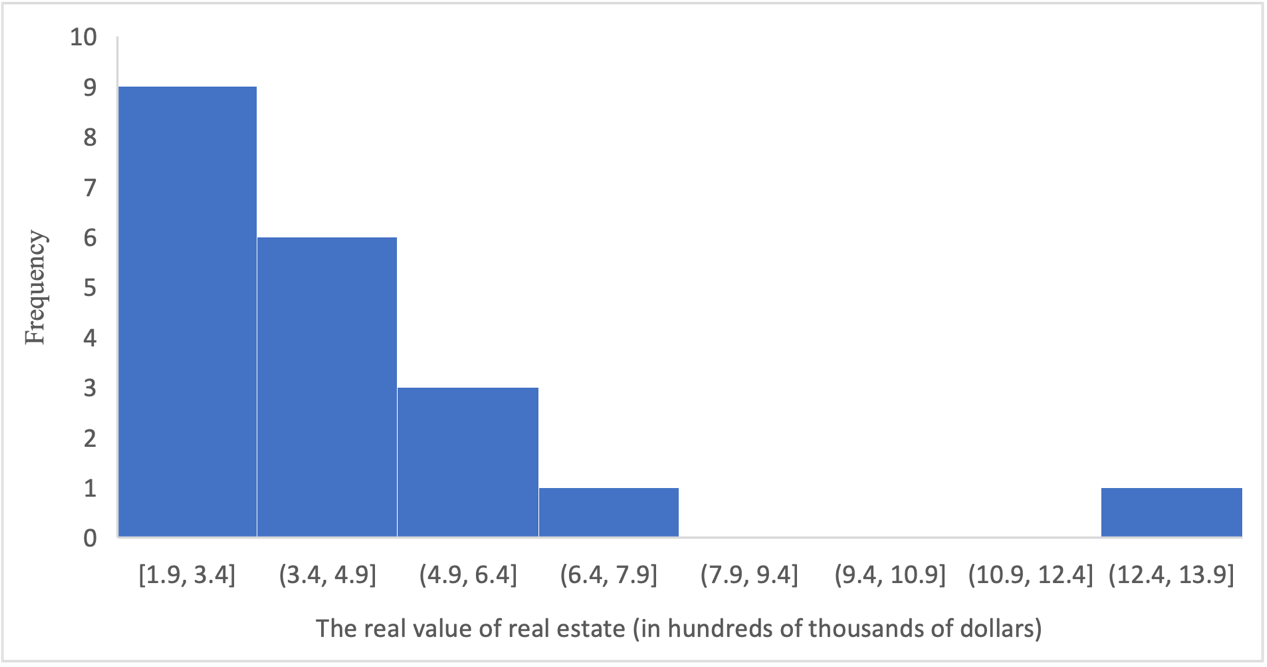
The first steps for calculating baseline trends were to calculate elements of descriptive statistics that include measures of central tendency. These include the mean and median, among others. The sample mean for twenty Canadian census metropolitan areas was $4.2 hundred thousand. The median value, on the other hand, was somewhat lower, at only $3.7 hundred thousand: which means that exactly half of the real values of the areas in the sample were above this level, and half were below it. The mean value is more informative because it is affected by potential outliers, while the median (second quartile) only divides the sample in half. Figure 1 contains a histogram to show the frequency distribution. As can be seen from this visual representation, most of the values are concentrated in the region up to $7.9 hundred thousand, with the maximum number of observations occurring in the interval from $1.9 to $3.4 hundred thousand. However, between $8.0 and $12.6 hundred thousand, there were no observations, although there were records for values above $12.6 hundred thousand. This is supported by the data in Figure 2, which shows that most of the property values in the sample were concentrated in the $1 to $2.9 hundred thousand interval or 45%.
The presence of some single value in the region of $12.6 hundred thousand may be evidence of an outlier in the sample. An interquartile interval method was used to identify the presence of outliers, defining the lower and upper bounds as [Q1 – 1.5IQR, Q3 + 1.5IQR]. The IQR in statistics corresponds to the distance between the third and first quartile, that is, it implies the area in which 50% of all data lie. For the current sample, this value was $2.5 hundred thousand. Using this method allowed us to determine that values lying outside the interval [$-1.2, $8.7] were to be treated as outliers. Since there were no negative property values in the sample, it was logical to pay attention to the upper emissions. Outliers were seen for the upper limit, which was $8.7 hundred thousand: all values above that were classified as outliers. These outliers can also easily be detected by using the boxplot (Figure 3): it is single and amounts to $12.6 hundred thousand.
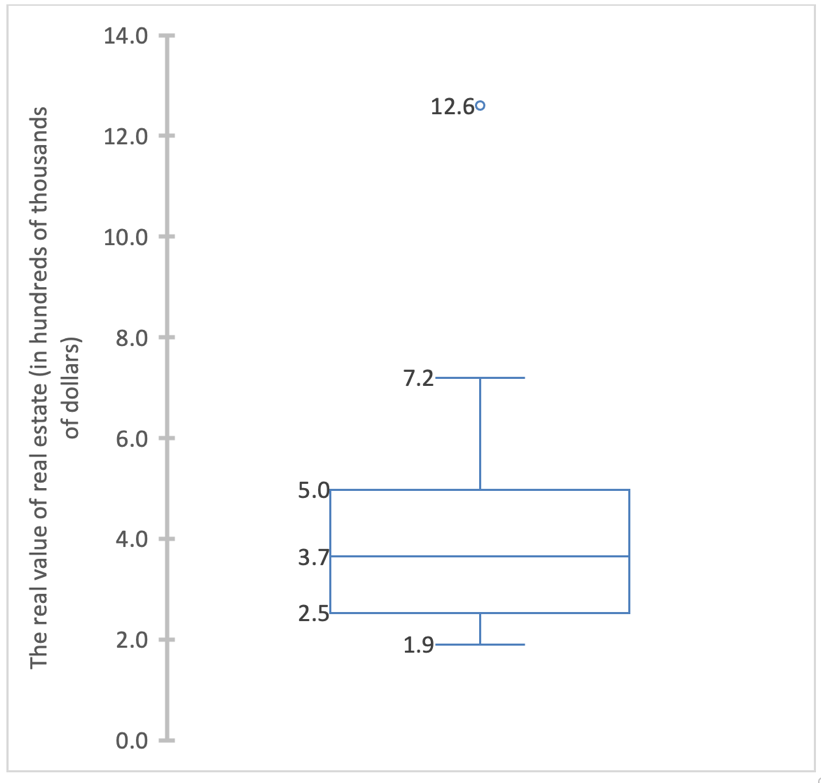
The boxplot also provides valuable information about five significant aspects of descriptive statistics. Specifically, the median value of $3.7 hundred thousand is surrounded by two quartiles, first and third. The first quartile was $2.5 hundred thousand, meaning that 25% of the data in the sample lay below this value. The third quartile was $5.0 hundred thousand, meaning that 75% of the data in the sample lay below that value, or 25% lay above it. The minimum value in the sample was $1.9 hundred thousand, and the maximum was $7.2 hundred thousand, with a value of $12.6 hundred thousand being considered an outlier.
Probabilities can also be calculated for the data, which includes calculating the z-score and using standard p-value tables, one-way or two-way, depending on the context of the problem being solved. The calculations are done using the built-in MS Excel functions: =TDIST(X, DF, Tails). Thus, the probability that a randomly selected county from the sample has a median value above $5 hundred thousand is 37.6%, this was a right-tail test. Accordingly, there is a 62.4% probability that a randomly selected county would have a lower median value. If the assumption was that two districts were chosen and both of them at once had a value higher than the stated value, this worked with the pooling of independent events; that is, the resulting probabilities had to be multiplied. In other words, the probability that both counties at once would have homes with a value above $5 hundred thousand is 14.2%. When an interval value was given for this value of a randomly chosen county — $2 hundred thousand to $5 hundred thousand — the calculation did not change much: one had to calculate two z-scores, then find the probability for them to intersect. Therefore, it was 43.6%, that is, there was a probability that the randomly selected house would be more expensive than $2 hundred thousand but cheaper than $5 hundred thousand. This probability is higher than the previous probability, which is logical given the concentration of the data in the left half of the histogram.
Conclusion
Concluding the descriptive analysis, there are some concerns about the representativeness of the data collected. In particular, it is necessary to examine their collection mechanism and determine what sampling algorithm was specific to the current scenario. In addition, in order to attempt to extrapolate the data to the population, one should know what external factors may be influencing pricing in the Canadian real estate market. Finally, the feasibility of expanding the sample size to increase its representativeness should be further explored.