Introduction
Strategic quality management plays a fundamental role in the development and implementation of organizational plans. Healthcare leaders have an essential duty to determine crucial tools and techniques that facilitate the progressive execution of projected ideas. In this sense, promoting patient safety is the primary objective of healthcare practice, especially by enhancing implemented systems’ performance and functionality (Harrison, 2010). My focus as the project manager would be to develop effective techniques and tools vital to the efficient implementation of the project. Quality management, project performance, processes, and workflow concepts are integral parts of implementing a novel EHR system within the healthcare setting.
Part 1
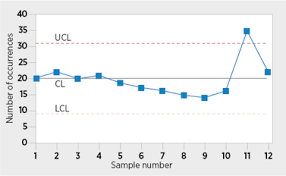
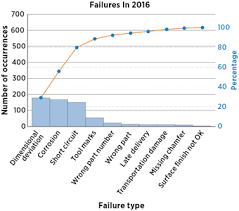
It is necessary to follow strategic measures to facilitate the adoption of the proposed EHR system regulation by implementing appropriate quality management techniques. Notably, both control and Pareto charts are among the essential quality management tools that enhance compliance strategies. According to ASQ (2019), the control chart aids in assessing the project’s changes over a specific time. The tool is vital because it helps identify any barriers that may require urgent solutions during the project implementation. In this sense, it explores whether there are any problems with the processor under control.
On the other hand, the Pareto chart is a bar graph representation of the principal elements when executing the project. In most cases, it advances the achievement of quality and avails sufficient information on system progress. The data obtained from the chart often helps healthcare CEOs determine the efficiency of the implemented EHR by deciding whether it is appropriate to meet the organization’s needs. On that note, the two charts are crucial for assisting healthcare leaders in choosing a practical path to consider when deciding the strategy to enhance quality within the institution. The following figures are visual images of the two selected charts.
Part 2
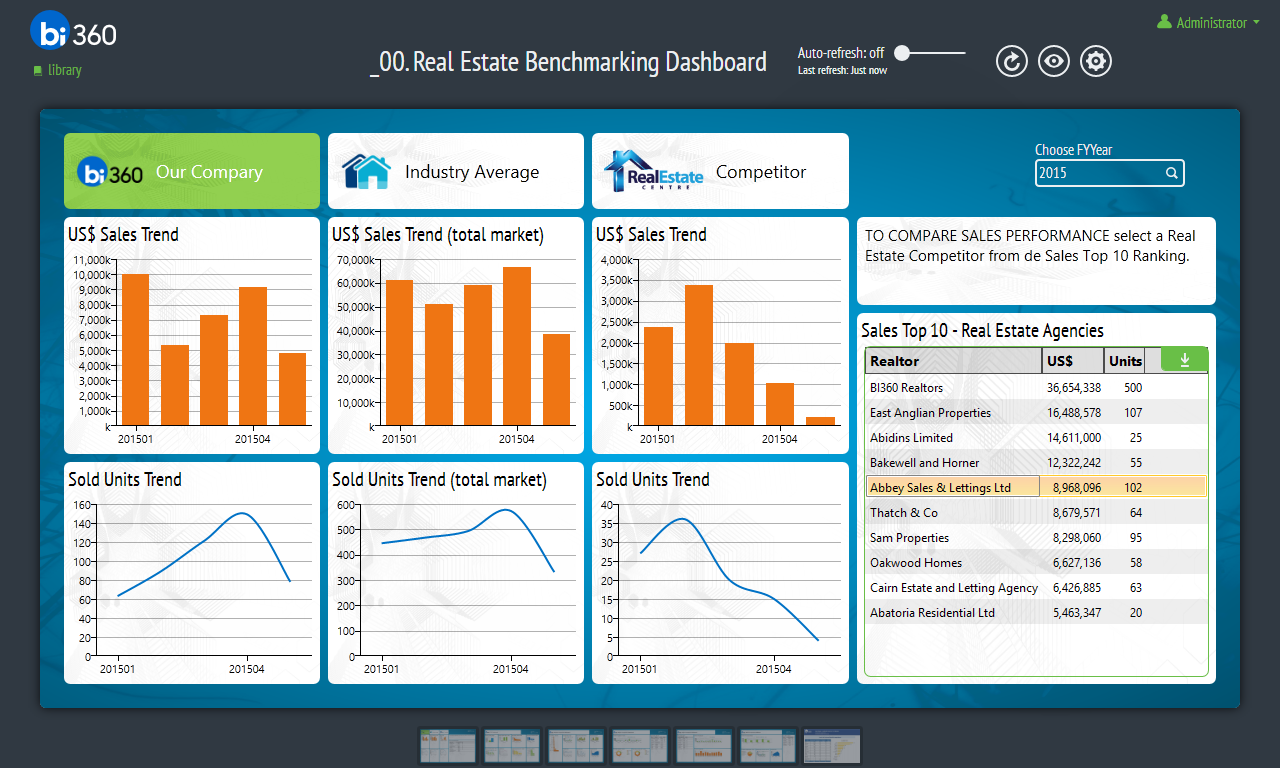
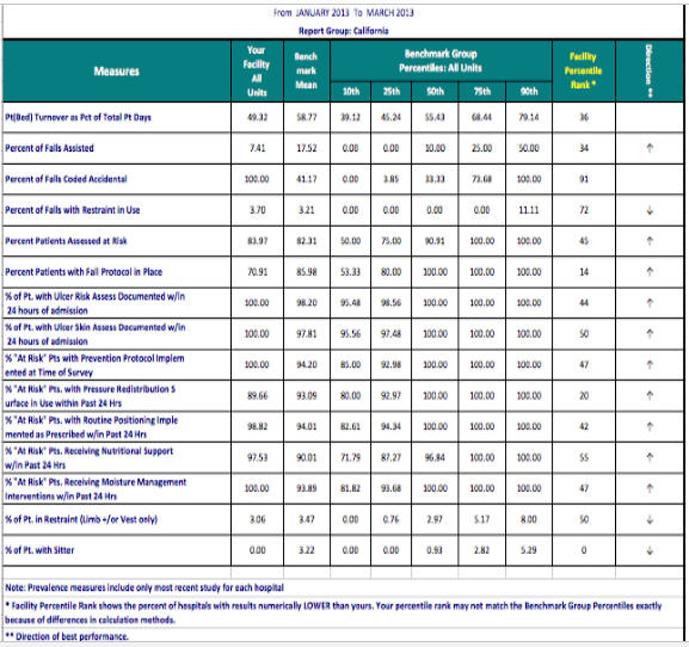
A recommended plan to measure and manage performance during the new EHR transition would be recording the company’s progress before introducing the new EHR system and another one during its operation. This plan is necessary to implement primary benchmarking techniques such as reports cards, dashboards, and productivity standards. Benchmarking alludes to a constant cycle applied by the medical care centers to gauge and contrast its activities and the executives’ administrations to those of the main rival in a similar field. It enables the organization to revive its internal procedures contingent upon the information received from the leading competitor. According to Liaw et al. (2016), it encourages the healthcare institution to rebuild itself since it is less difficult to screen the mistakes resulting in lateness.
While recording the instruments for performing management, it would be imperative to use dashboards to show the current trends regarding the healthcare facility’s present position. It would also be easier to deliver gains to the companies resulting from previous improvements. On the other hand, report cards contain all critical data regarding system performance. In this sense, it helps examine whether the implemented system operates effectively based on fixed standards and determine changes that can improve its efficiency. However, another performance measurement tool that can be considered is the productivity standard. According to Abdelhak, Grostick, and Hanken (2014), they are efficient in identifying whether service delivery measures are increasingly becoming more beneficial to the company.
Part 3
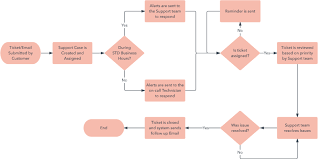
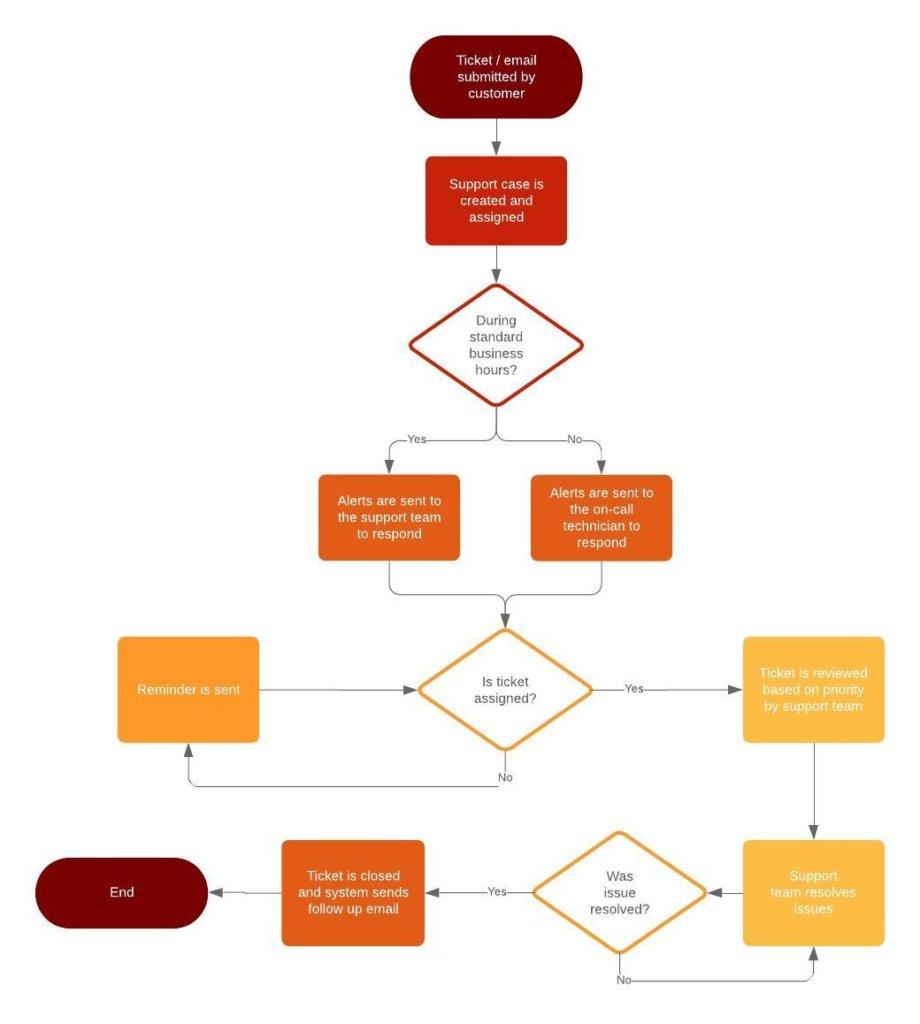
A compelling workflow model ought to be coordinated into the cycle to assist with the new EHR framework’s progress. It helps sort out each achievement task during the task cycle (Cheung, Goodman, and Osunkoya, 2016). Both the workflow diagram and process flowchart are critical ideas analyzed in this segment. A workflow graph shows where the data is going through a visual guide, whereas a process flowchart shows each progression in a graphical illustration. The two concepts help in the overall task investigation and simultaneously help assess the Continuous Quality Improvement (CQI) over a given period.
The workflow model helps to determine who is liable for a specific mission and when the work is done simultaneously. The concept aids in responding to questions such as ‘who does what and when (Cheung, Goodman, and Osunkoya, 2016). Workflow examination is best polished in an institution with numerous divisions where each segment has appointed an errand to perform. Notably, they are the most recommended tools concerning decision-making in the organization. Besides, they assume a critical part in assisting the CEO and the board of directors to choose the best workflow idea to guarantee quality during the new EHR framework. The accompanying images show the visual illustration of the workflow model.
Part 4
During the time spent actualizing the new framework, it is fundamental to utilize the best management methods to guarantee effective outcomes. Significant procedures used in the process incorporate benchmarking strategies and Gantt charts. Although these strategies perform comparative duties, it is necessary to choose the ones that best suit the hidden task that identifies with the new EHR framework’s better presentation.
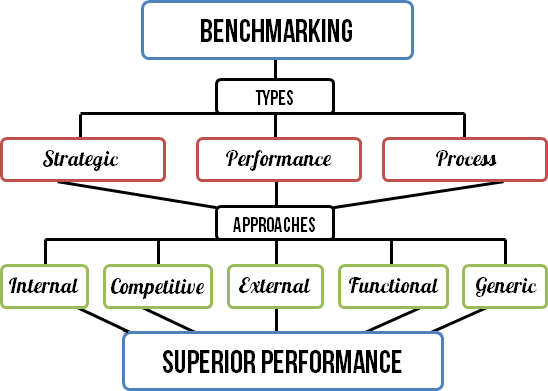
Benchmarking procedures help with estimating the presentation of the task corresponding to other institutional advancements. Along these lines, it is the best device to guarantee consistent progress and unrivaled operation. Consequently, the executives must know about different task management strategies that would bring significant results after integrating the proposed program.
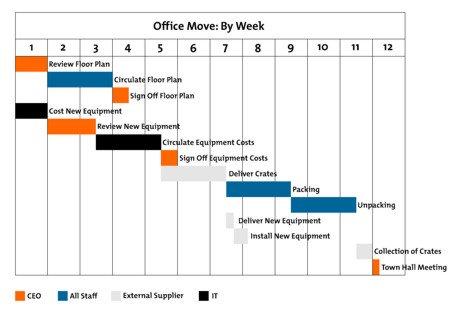
Gantt charts outline the work done within a specific period comparable to what is required to be finished over that term. It embodies the working timetables in days, weeks, or months in a schedule (Ong, Wang, and Zainon, 2016). The instrument is the most successful tracking record to screen the advancement of the task. The images below show the visual illustration of the benchmarking techniques and the Gantt chart.
Conclusion
Overall, with regards to the execution of a proposed framework inside a medical institution, it is fundamental to depend on the best instruments and procedures to ensure positive performance. As the delegated lead project director in the execution of another EHR framework, my objective will be to guarantee that fundamental instruments and procedures are followed during the project cycle. I will help give essential data through value management devices, unrivaled performance management measures, best workflow ideas, and viable project management methods. Pareto and control charts will play as the best management instruments simultaneously. Dashboards will be fundamental performance administration procedures while benchmarking will guarantee positive outcomes after the project implementation. These strategies will be fundamental to ensuring that all planned work gets finished within the predetermined period.
References
Abdelhak, M., Grostick, S., & Hanken, M. A. (2014). Health information: Management of a strategic resource. New York, NY: Elsevier Health Sciences.
ASQ. (2019). Control chart. Asq. Web.
ASQ. (2019). What is a Pareto chart? Asq. Web.
Cheung, Y. Y., Goodman, E. M., & Osunkoya, T. O. (2016). No more waits and delays: Streamlining workflow to decrease patient time of stay for image-guided musculoskeletal procedures. RadioGraphics, 36(3), 856- 871. Web.
Edraw Max. (n.d.). What is a process flowchart: A useful guide. Edraw Max. Web.
Harrison, J. (2010). Essentials of strategic planning in healthcare. (1st ed). Chicago, IL: Health Administration Press.
Hanna Kim. (2017). Dashboards for real estate companies using Microsoft dynamics GP. Solverglobal. Web.
Jurevicius, O. (2014). How can your benchmarking make your business better? Strategic Management Insight. Web.
Lucidchart. (n.d.). What is a workflow diagram? Web.
MindTools. (n.d.). Gantt charts: Planning and scheduling team projects. MindTools. Web.