The annual revenue growth of the company has seen a stable increase for the last three years. Excluding the profits from 2021, the revenue additions for 2018, 2019, and 2020 years were $21 461, $24 578, and $31 536 billion, respectively (Tesla, Inc., 2021). The revenue growth is illustrated by the following chart:
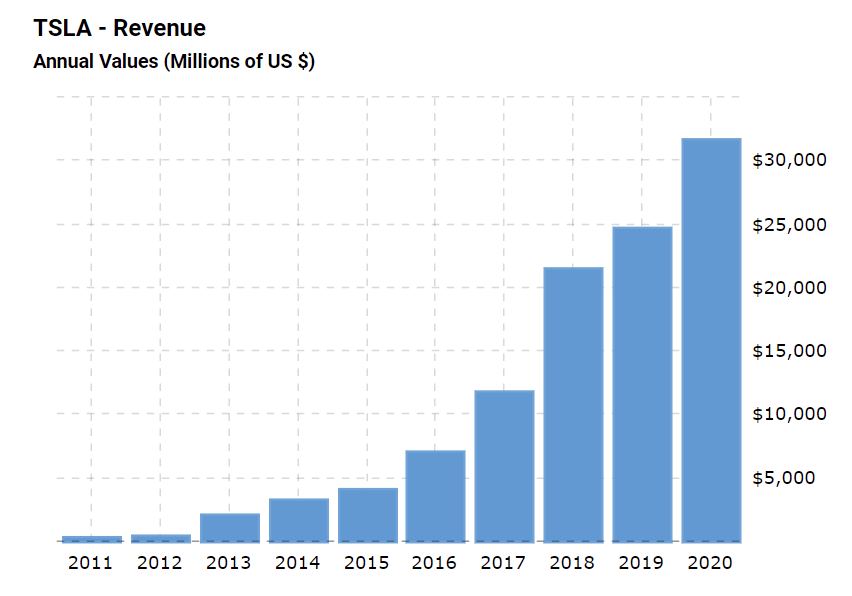
A significant part of the revenue growth is concentrated on automotive sales, which have accounted for $27.237 out of $31.536 billion in 2021 (Tesla, Inc. 2021). Other activities include services and energy generation, which have accounted for $2.306 and $1,994 billion, respectively (Tesla, Inc. 2021). The Tesla company has also presented the report containing the revenue growth for the first quarter of 2021, resulting in $10.389 billion (Alvarez, 2021). The ultimate outcomes for the first quarter of approximately 74% year-over-year growth have surpassed the initial expectations of the company (Alvarez, 2021).
Operational Expenses (last three years)
According to the annual report, the overall cost of revenues was $17.419, $20.509, and $24.906 billion in 2018, 2019, and 2020, respectively (Tesla Inc. 2021). Consequently, the operating expenses for the last three years comprised $4.430, $4.138, and $4,636 billion (Tesla Inc., 2021). The increasing tendencies in these parameters are illustrated by the two charts below:
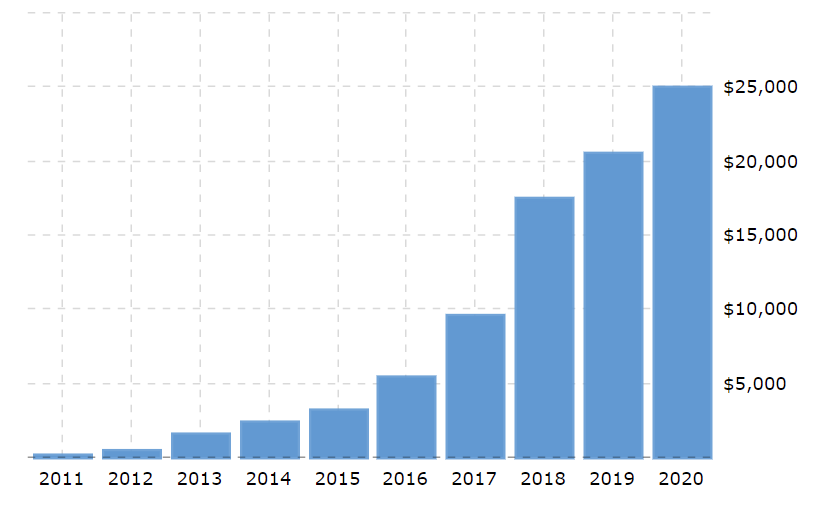
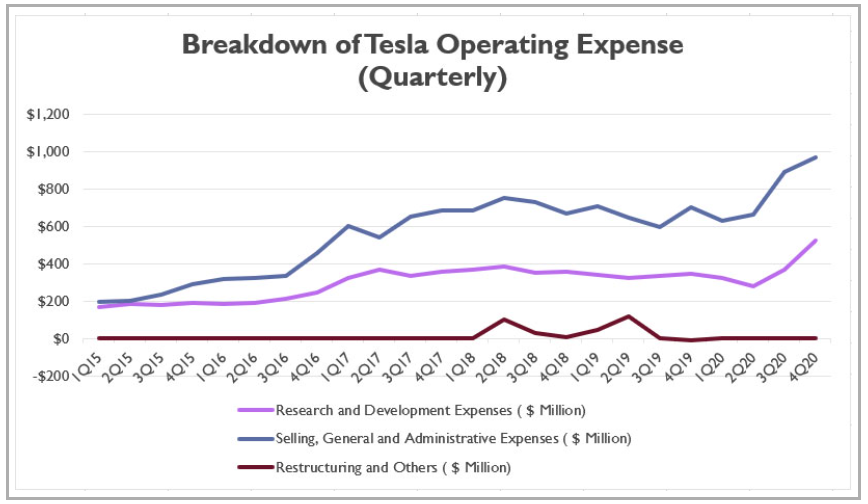
The ‘cost of revenues’ entry includes automotive sales and leasing, energy generation, and services (Tesla Inc., 2021). Operating expenses cover research and development of innovative technologies, restructuring, and administrative expenses, which include a large variety of activities, such as marketing, personnel wages, sales, HR, etc.
Profit Margin (last three years)
Profit margin generally refers to the income of the company after the subtraction of the total expenses from the revenue growth and is designated as the percentage. The gross profit of the company for the last three years was equal to $4.042, $4.069, and $6.630 billion for 2018, 2019, and 2020, respectively (Tesla Inc., 2021). The profit margin, however, was -4,5%, -3,5%, and 2.2% at the end of each year (Macrotrends, 2021). The following chart illustrates the profit margin and the dependent variables for the last three years:
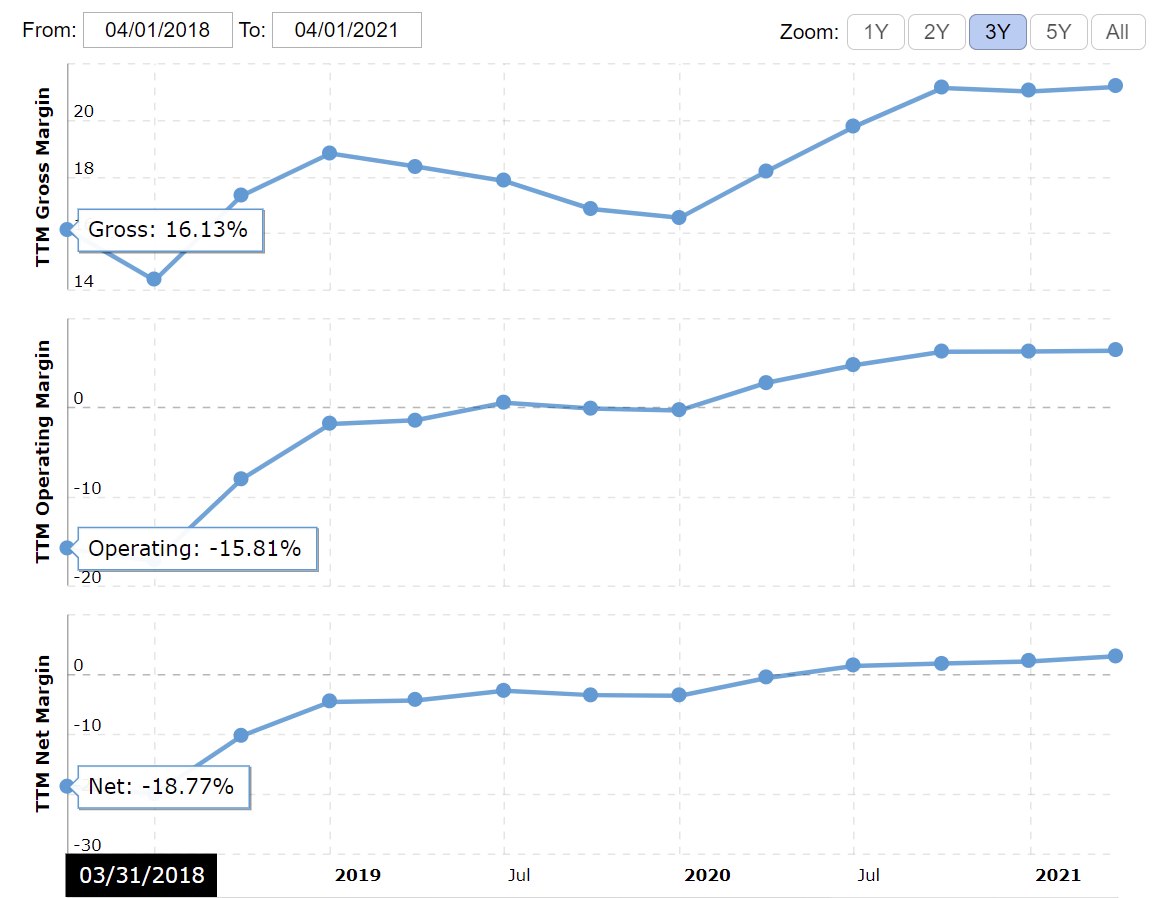
In the Q1 of 2021, the company has achieved the highest rate of profit margin within the analyzed period, equal to 3.18% (Macrotrends, 2021).
Stock Performance (last three years)
The stock performance of the company has been relatively stable in 2018 and 2019, with an average stock price of approximately 62 (Macrotrends, 2021). In 2020, Tesla experienced a sharp increase in stock performance with an absolute high point of 900.4 (Macrotrends, 2021). The table below demonstrates the annual stock prices for the last three years:

At present (July 2021), the stock price varies slightly from 660 to 680 average stocking price, which is considerably lower compared to the numbers at the beginning of the year (Macrotrends, 2021).
Latest Market Value
Market value is generally calculated as the multiplication of the stock price on the number of shares (Macrotrends, 2021). As a result, this variable is fluctuating according to the current state of stock performance. The chart below represents the market value of the corporation for last three months:
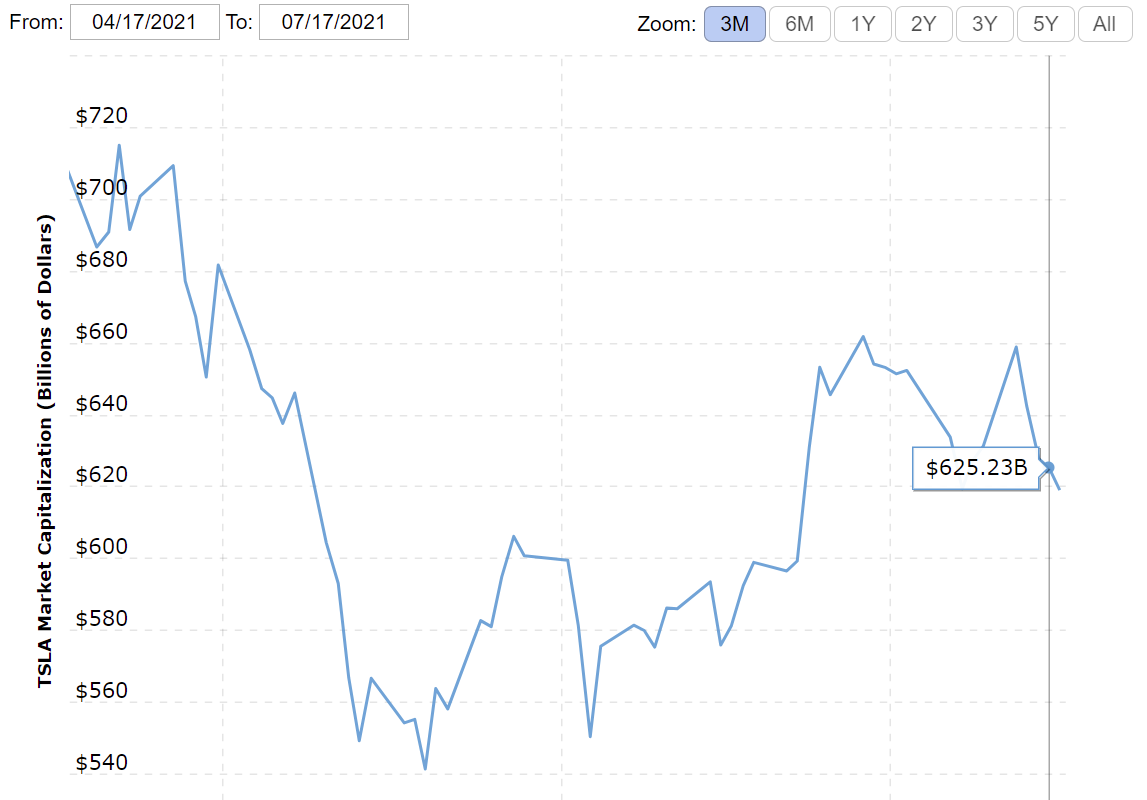
As seen from the image, the latest market value is equal to $625.23 billion, and the market capitalization follows the stock performance accordingly.
Debt: (short & long Term)
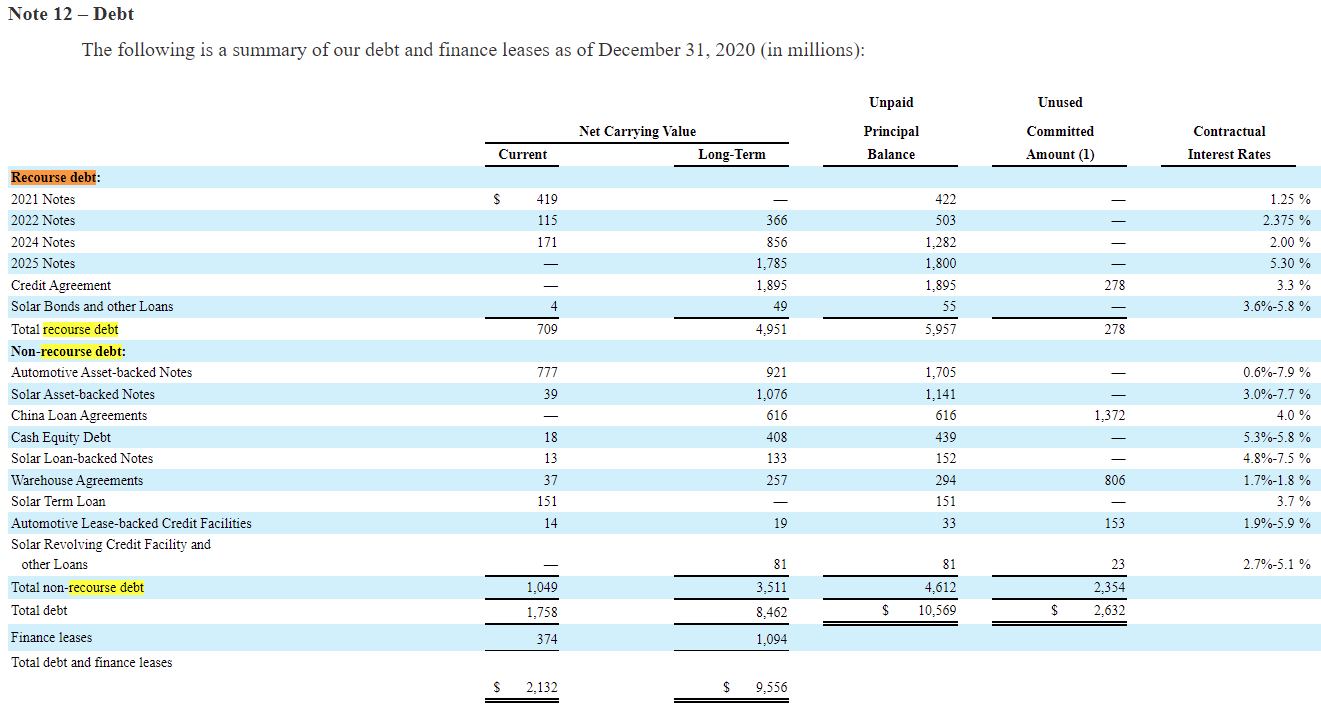
By the end of 2020, the short-term debt of the organization was $2.132 billion, and the long-term debt was $9.556 billion (Tesla Inc., 2021). Compared to the numbers of 2019 ($1.785 and $11.634 billion), the company experiences an increase in short-term debt and a decrease in long-term debt (Tesla Inc., 2021). The detailed report for 2020 is presented below:
Cash Position (last three years)
Cash position or cash on hand demonstrates the amount of cash that the company has available at a particular point in time (Hayes, 2021). This variable acts as a liquidity reserve and a safety measure for financial operations (Hayes, 2021). The cash position for Tesla has drastically improved during the last two years and is represented in the chart below:
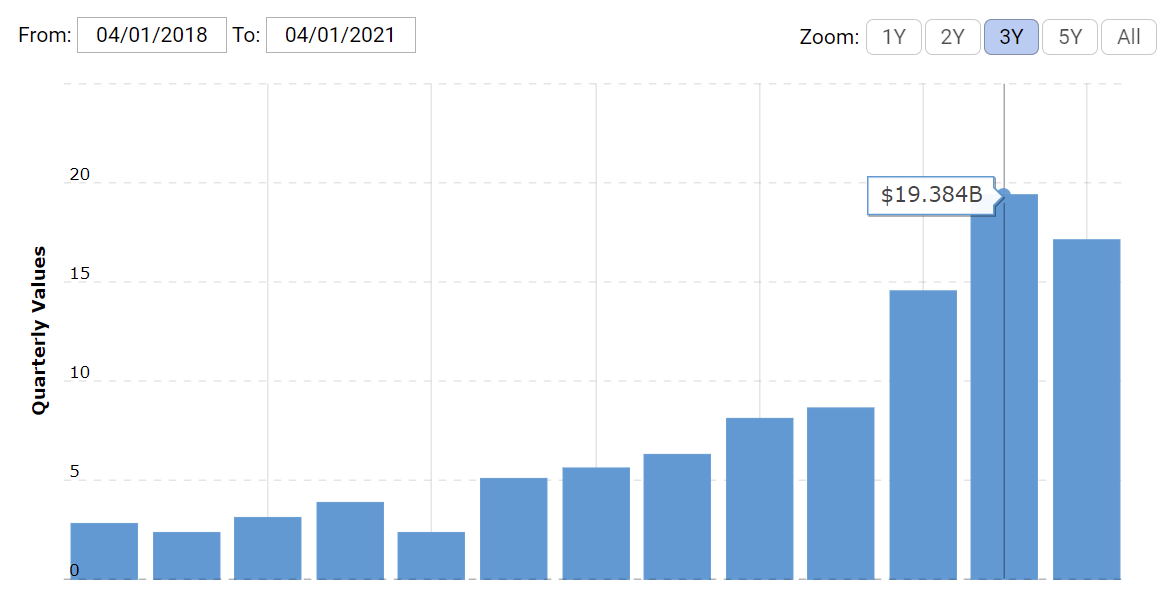
The values were $3.879, $6.268, and $19.384 billion by the end of 2018, 2019, and 2020, respectively (Macrotrends, 2021). By the end of the Q1 of 2021, the company has seen a slight decrease in cash on hand (Macrotrends, 2021).
Liquidity Measurement Ratios (current; Quick; Cash)
The current ratio is defined as present assets divided by liabilities; the quick ratio or ‘acid-test ratio’ is determined as cash plus marketable securities plus accounts receivable divided by liabilities; the cash ratio is calculated as cash divided by liabilities (Hayes, 2021). The formulas in an illustrative manner are represented below:
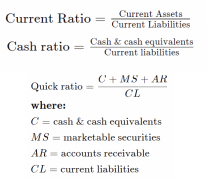
The current state of liquidity measurement rations for Tesla is the following:

As seen from the table, the company has experienced a drastic increase across all liquidity measurement rations in the past three years.
Marketing
The product lines of Tesla include automotive production, renewable energy, such as solar panels or powerwalls, storage systems, and services. As mentioned in the previous chapter, the majority of the revenue growth stem from the sales of electric vehicles – the primary product line of the company. Nevertheless, other merchandise, such as solar panels or roofs, is also considered to be one of the top-rated qualities in the industry (Betters, 2017). Despite the type of the product, Tesla promotes sustainable development and attempts to combine innovative technologies with eco-friendly manufacturing and utilization. Therefore, while the main focus of Tesla is electric vehicles, the company also continually develops other product lines.
Core (main) Products
Tesla is a technology company, and the products of the organization include electric vehicles, models of energy generations, and storage systems. However, the focus of the company is electric cars, and Tesla is currently the largest manufacturer and distributor of this product. The company continuously improves its product lines and pushes the boundaries of innovative technology in its electric automobiles. Tesla offers the four primary models of vehicles: Tesla Model S, Tesla Model 3, Tesla Model X, and Tesla Model Y (Tillman, 2021).
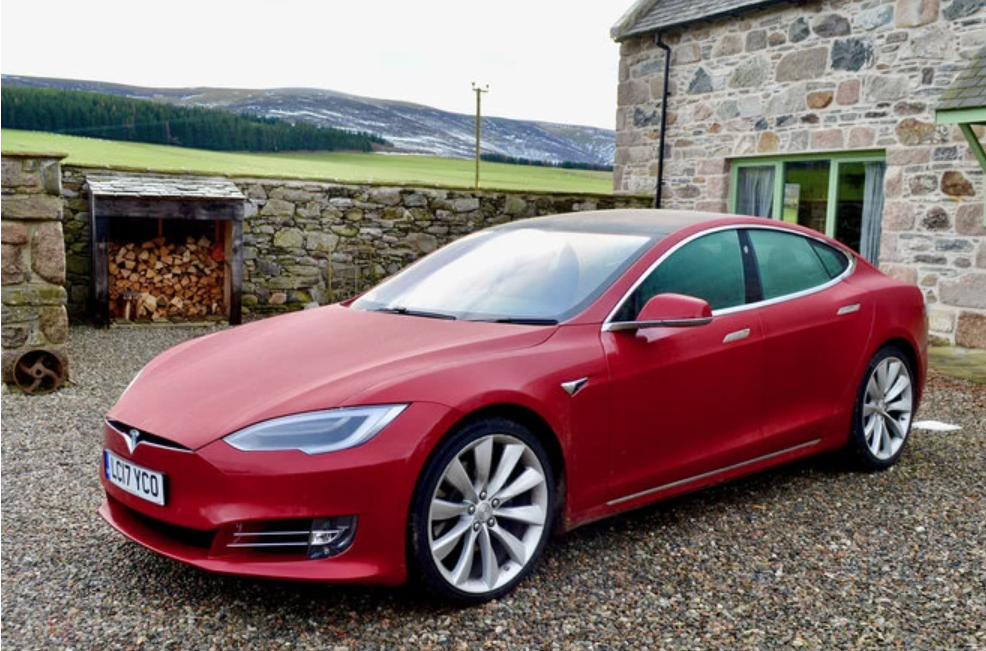
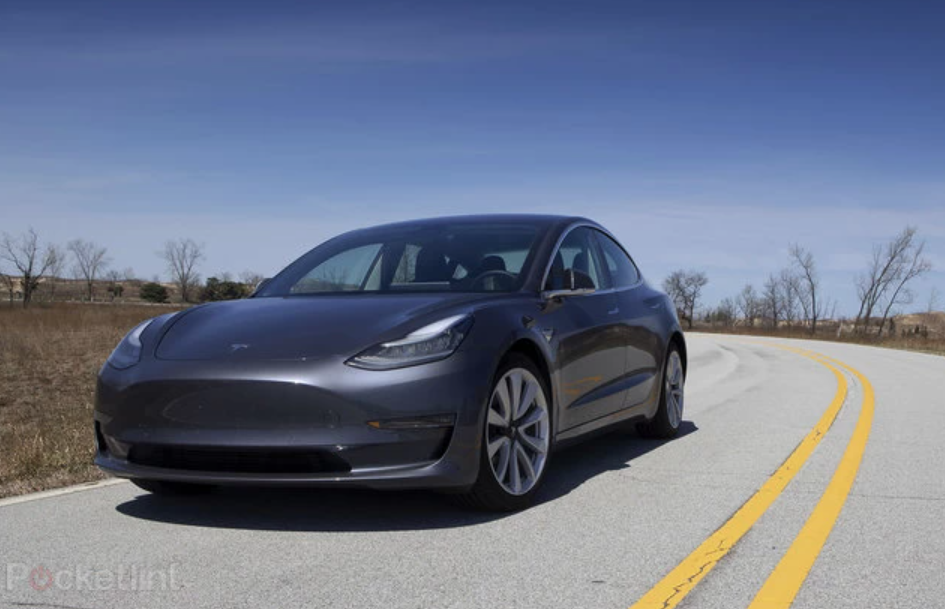
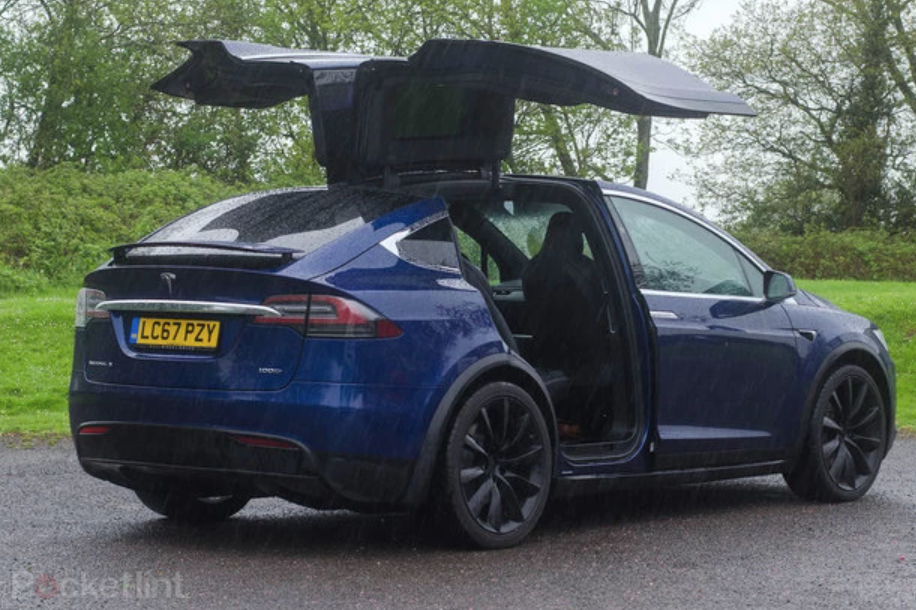
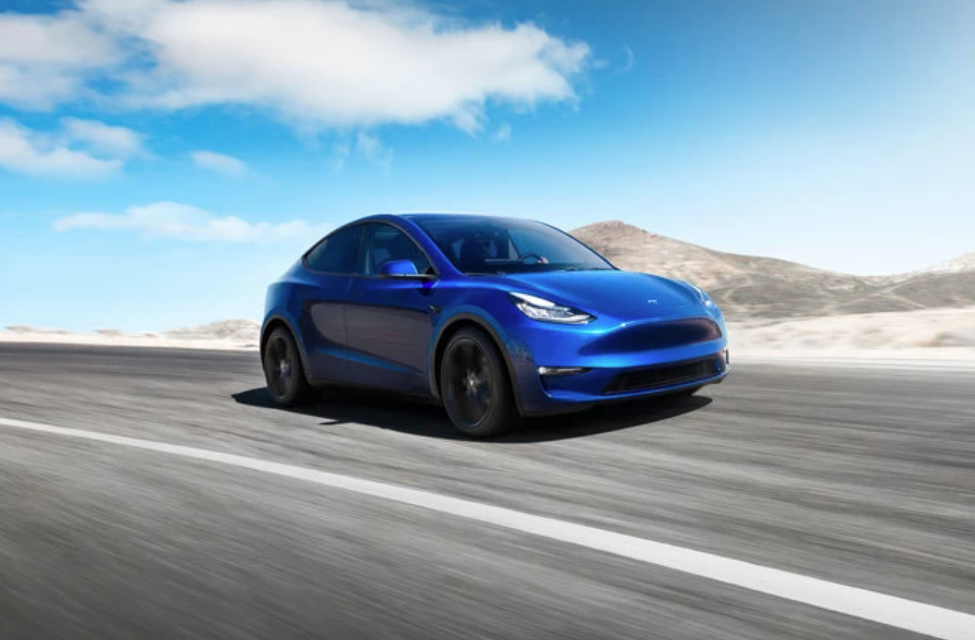
These models differ in their price ranges, designs, seating capacity, engine or battery type, and AI systems (Tillman, 2021). Therefore, the products might meet the requirements of distinguished target groups. Single people might be satisfied with the ergonomic design of Model S, while large families might prefer Model X due to the enhanced seating capacity of seven people (Tillman, 2021). The mentioned four models are designed with an autopilot feature with the possibility to install the full self-driving function for additional costs (Tillman, 2021). Therefore, Model S, Model 3, Model X, and Model Y are the flagman and the core products of the company.
Furthermore, the company produces several electric vehicles that stand out from the core products either due to design or purpose. One of them is the Cybertruck, a pick-up truck automobile with a futuristic design (Tillman, 2021).
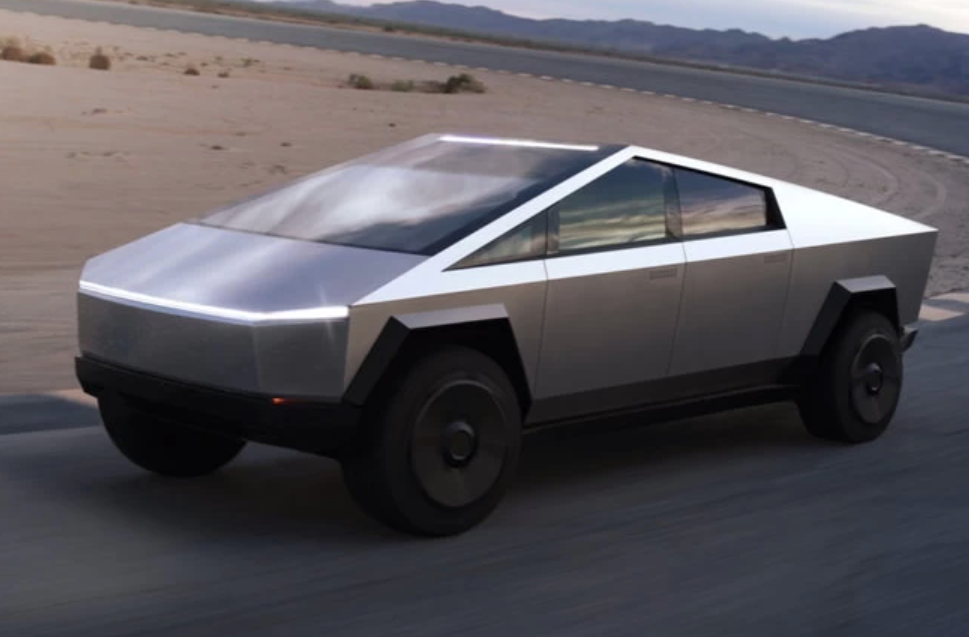
This product will be mostly distributed within the United States and is more fit for rough roads rather than for urban settings. The sales of the Cybertruck are scheduled for late 2021 with the starting price of $39,900, which is approximately two times cheaper than Model S and Model X (Tillman, 2021). Another electric vehicle in the Tesla product line is Roadster, the fastest and most expensive automobile that the company has to offer (Tillman, 2021).
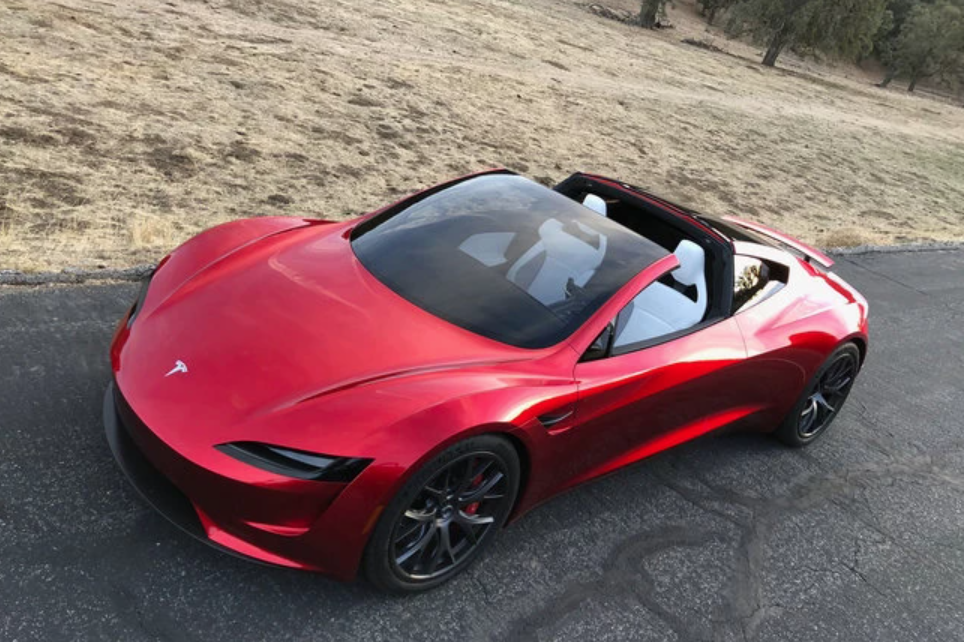
The starting price is $200,000 and is currently distributed based on reservations only (Tillman, 2021). The vehicle has an impressive maximum speed of over 250 mph and is presented in two distinguished designs. Ultimately, while the core products of Tesla include Model S, Model 3, Model X, and Model Y, the company also offers several other vehicles with unique designs and purposes.
Distribution Method/Strategy
The primary distribution method of the company is an online-sales model; however, Tesla also owns a considerable amount of company-specific retail stores (Bhasin, 2019). Nevertheless, some of the retails stores are operating only as showrooms, and Tesla is currently in the process of changing all the distribution options to online sales (Tillman, 2021). Therefore, the company does not utilize the conventional method of selling via dealer stores. This strategy transparently differentiates Tesla from other grand automotive companies, such as Ford or General Motors, who use the services of third parties to sell their products (Bhasin, 2019). The distribution method of online sales is also enhanced by the notable presence of CEO, Elon Musk, on social media and his constant feedback exchange with the customers (Bhasin, 2019). The clientele base of the company is technology-driven, and the online sales method caters to their needs and desires. As a result, Tesla is shifting toward the full digitalization of the distribution.
Target Audience
Tesla has a highly distinct buyer profile represented by a set of particular features. Namely, the target buyer is a male of the middle-upper class, who supports sustainable development, is tech-savvy, and lives in an urban setting (Zucchi, 2015). Naturally, due to the high costs of the products, the target audience should be rich. Furthermore, the average buyer is still considered to be a technological enthusiast due to the relatively small exposure of electric vehicles among the public. As a result, in regard to Model S sales, 84% of customers are male, 77% have income over $100,000, and 51% are from 45 to 64 years old (Zucchi, 2015). Ultimately, Tesla clearly understands who its target audience is and caters to their needs and desires by promoting technological and sustainable development.
Main Competitors
Despite the focus on electric cars and innovative designs, a large number of traditional car companies also present the competition for Tesla. The list of competitors includes Ford Motor Company, General Motors, Honda Motor Company, Navistar, Oshkosh, PACCAR, Spartan Motors, Tata Motors, Toyota Motor Corp., and Wabco (Investopedia, 2020). This trend is implied by the overall digitalization of the industry and the emphasis on sustainable development. In recent years, eco-friendly technologies emerge in all spheres of production and service, thus, explaining the development of electric cars and renewable energy sources among traditional automobile companies. Nevertheless, the car firms do not necessarily put all their efforts into electric vehicles but rather only start to explore the industry. It implies that the majority of the grand companies still focus on traditional or hybrid automobiles that do not present the direct competition for Tesla. Therefore, Tesla still holds the top two ranks of luxury electric vehicles, namely, Tesla Model S and Tesla Model 3. Nevertheless, it is possible that Tesla will encounter more intense competition if the grand companies, such as Ford or Honda, continue the course toward sustainable development and electric vehicles.
Geographic reach
As mentioned before, the core distribution strategy of the company is via online sales, while the retails store primarily serve as showrooms. It allows the company to have a global presence and distribute its products to various parts of the world. Although the majority of the customers are American, there is also a large number of clients from European countries, China, Japan, and Australia (Fruhlinger, 2019). The chart below represents the geographic presence of the company:

As seen from the chart, the US and Europe demonstrate the highest levels of density in regard to Tesla chargers, showrooms, and service centers. These estimates have a direct dependency on the number of customers, implying that the majority of the clients are either from the US or Europe. Nevertheless, the number of Chinese customers has seen a drastic increase in recent years, as well (Farley, 2021). Ultimately, the geographic reach of Tesla is global but has a notable emphasis on the developed countries.
Advertising & Promotion Strategy (IMC)
As mentioned briefly before, the promotion strategy of the company revolves around its online presence and, specifically, Elon Musk. The CEO has an immense influence in the world, and the majority of people in the Western developed countries know his name, which vastly accounts for the popularity of Tesla. As a result, the strategy ‘word of mouth’ is sufficient to produce demand for Tesla’s products (Bhasin, 2019). Furthermore, Tesla also utilizes its website and Twitter to promote electric vehicles and create a large base of followers and loyal supporters.
Pricing Method & Strategy
The Tesla products are generally considered to be highly expensive, promoting the quality over quantity policy. For instance, Model S, one of the top-rated electric vehicles in the world, has a starting price of $74,990 in 2021 (Hayes, 2021). There are several reasons for the high costs. First, there is a small number of automobile manufacturers that focus on electric vehicles due to the reluctance of traditional automakers to switch to innovative designs (Hayes, 2021). The second reason is the supply/demand ratio; a large number of people want to purchase Tesla products, but the supply is complicated due to the lack of manufacturers and the complexity of the parts (Hayes, 2021). Essentially, it implies that Tesla can raise the starting price of electric vehicles to balance the production/demand ratio.
Lastly, the batteries that power automobiles are extremely expensive compared to their counterparts in traditional vehicles. The Tesla research team makes progressive efforts in minimizing the battery costs per kilowatt-hour; however, the batteries still remain the most expensive components of electric automobiles (Hayes, 2021). All these factors account for the high costs of the Tesla products: the average is $19,000 for an electric vehicle, while the Tesla Model 3 is approximately $40,000, Model S is $70,000, and Model X is $80,000 (Hayes, 2021). However, with the grand companies, such as Toyota and Ford, inclining for electric and hybrid vehicles, Tesla’s price strategy might change in the future.
Positioning Strategy
The positioning strategy of Tesla revolves around its mission, primary principles, marketing, and target audience. Unlike a large number of competitors, Tesla prioritizes technological research and sustainable development. As a result, many customers with similar mindsets and objectives choose Tesla, and more than 80% of the clients want to buy new products from the company (Morgan, 2019). Another distinguishing feature is the strong emphasis on marketing via the CEO, Elon Musk, on social media and consistent feedback exchange with the customers.
Value Proposition
The value proposition of Tesla consists of four primary elements: recharging flexibility, high performance and unique design, energy efficiency, and eco-friendliness (Fox, 2020). These factors are noticeable across all Tesla’s product lines and, specifically, in electric vehicles. The combinations of high performance, energy efficiency, and eco-friendly alignment have put the company in the top place in the electric automotive sector of the market and created a supportive and loyal client base.
Differentiation Strategy
The two major factors that make Tesla stand out from the competitors are technology-driven production and sustainable development. Tesla keeps the top place in regard to both eco-friendliness and technology innovation due to the nature of electric vehicles and the efforts of the development team. At some point in time, Tesla was even considered to be a technology company rather than a car manufacturer. At present, many grand automotive companies start investing in electric and hybrid cars; nevertheless, Tesla still holds the top place in this sector of the market.
Customer Relationship Management (CRM)
As mentioned before, Elon Musk has an immense influence on the relationship between Tesla and its customers. The consistent feedback exchange on social media promotes healthy CRM and, alongside the quality of the products, is accountable for customer satisfaction. As a result, Tesla clients demonstrate the highest levels of loyalty among all automotive companies, reaching the satisfaction level of 90% (Morgan, 2019). Furthermore, the transparent mission and focus of the company on technology and sustainable development unites the people with the same mindset, enhancing the CRM, as well.
References
Alvarez, S. (2021). Tesla (TSLA) Q1 2021 earnings results: $10.39B in revenue, beats with $0.93 EPS. Web.
Bhasin, H. (2019). Marketing strategy of Tesla. Web.
Fox, G. (2020). Tesla business model: It’s just different right! Web.
Fruhlinger, J. (2019). Tesla’s growing worldwide presence. Web.
Hayes, A. (2021). Cash position. Web.
Hayes, A. (2021). Liquidity ratio definition. Web.
Hayes, A. (2021). Why are Tesla cars so expensive? Web.
Macrotrends. (2021). Tesla: TSLA. Web.
Morgan, B. (2019). 10 customer experience lessons from Tesla. Web.
Tesla. (2021). Annual report. Web.
Tillman, M. (2021). Tesla models compared: Model S, Model 3, Model X, Model Y, Cybertruck and more. Web.
Zucchi, K. (2015). What drives consumer demand for Tesla? Web.