Introduction
Tesla Inc. is an American manufacturer of electric cars based in the USA. Since the demand for the products keeps increasing, the company plans to build a new Gigafactory in Austin, Texas. The project will start on January 1, 2022, and its expected duration of two years denotes that it should be completed by December 31, 2023. At present, the project is divided into two phases with individual tasks. The preliminary data analysis demonstrates that Phase One (infrastructure) will last for 380 days, while 470 more days will be needed to complete Phase Two (internal assembly and support systems). Tesla’s CEO, Elon Musk, stipulates that the estimated budget is $1 billion, while every day of delay will make the company incur $1 million of losses. That is why appropriate project management tools and methods should be used to ensure that the construction can be performed appropriately and in time. Careful analysis reveals that appropriate planning interventions are necessary to reduce the project duration and meet the stipulated deadline.
Task 1: Project Planning and Control Methods
Appropriate techniques are necessary to ensure that the project can be correctly implemented. Today, many options are available, and project managers are expected to choose the most suitable tools and techniques. The given section will be divided into two parts that will discuss project planning and control methods separately. In particular, each subsection will present three options and provide scientific evidence on why and how these methods can be used.
Project Planning Methods
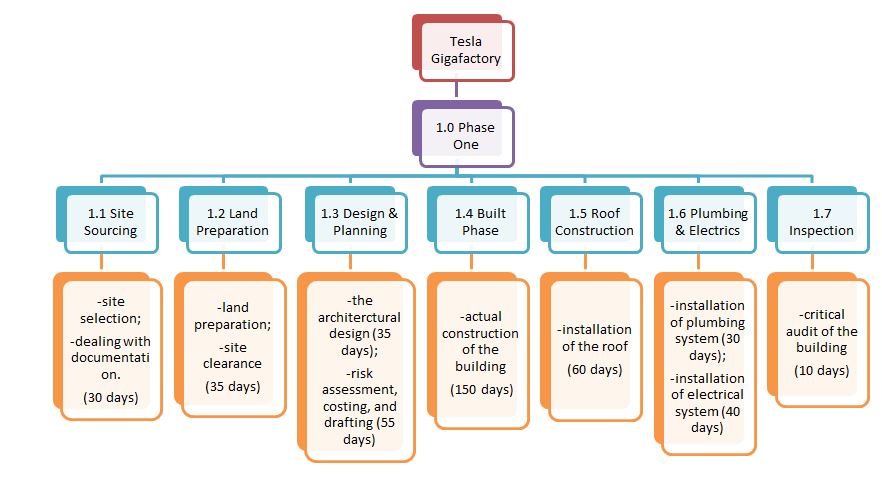
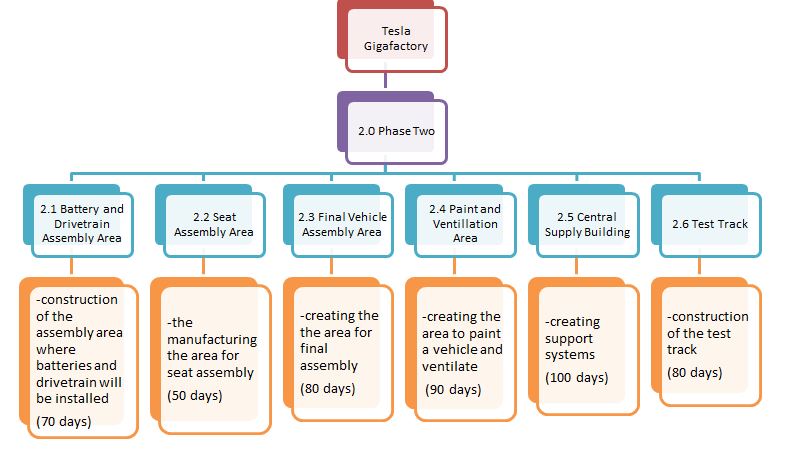
The WBS is the first project planning method that will be considered. According to Burghate (2018, p. 1), this technique stands for “the grouping of the work involved in a project oriented towards the deliverables that defines the total scope of the project.” In other words, the WBS divides the entire project into individual stages and highlights what tasks should be performed during each of them. The rationale behind using the given approach is that the WBS reveals the entire work to be done, eliminates the necessity to make project re-plans, is suitable for all stakeholders, and others (Burghate, 2018, pp. 2-3). That is why it is reasonable to apply this method to Tesla Gigafactory construction, and the specific WBS is presented below.
The second project planning technique refers to the Gantt Chart. This tool is appropriate for visualizing the project schedule, which leads to many advantages. In particular, the Gantt Chart allows for planning, documenting, and tracking the plan to identify what project stages are being currently implemented (Davis, 2019, p. 147). Another strength of this technique relates to its simplicity of creation and use because the Grant Chart reveals the entire schedule in a single place (Davis, 2019, p. 147). This planning method is significant, and the Gigafactory project can rely on it.
The CPM is the third technique that project managers can use to plan their work. Mahardika et al. (2019, p. 1) stipulate that this method is “a sequence of activities that determines the fastest time possible for a project to be completed.” In particular, it relies on a previously created WBS to identify individual tasks of a project and analyzes what activities make the longest path. This technique reveals which activities are essential for the duration of the project and which ones can be delayed. The CPM is suitable for identifying processes that can be accelerated to reduce the project duration.
Project Control Methods
Appropriate techniques are also required to monitor projects to ensure that the developed plan is followed. The first possible option refers to progress reporting as a way to control projects. This method stands for collecting data about the project’s progress and comparing the obtained information to the previously developed schedule. Manual data collection is labor-intensive and time-consuming, while the possibility of producing inaccurate information is also high (Moselhi, Bardareh and Zhu, 2020, p. 2). That is why a suitable variant is to rely on automated schedule updating and progress reporting systems (Moselhi, Bardareh and Zhu, 2020, p. 2). Consequently, progress reporting can be an effective project control method if adequately implemented.
Furthermore, the EVM is another project control technique that can be used. This approach implies that “the values estimated in the planning phase are compared with the project execution values, to determine project’s state, and in this way create any adjustments that lead to project success” (Tereso, Ribeiro and Cardoso, 2018, p. 1). In other words, the EVM focuses on the project’s schedule, costs, and scope to determine whether the current approach is sufficient to achieve the stipulated goals. If some inefficiencies are present, the EVM is helpful because it can advocate for implementing required changes to improve the situation and minimize adverse effects.
Finally, regular team meetings can also be considered a technique to control project management. This approach is helpful because professional managers gather and share information about their progress (De Silva, Samanmali and De Silva, 2017, p. 500). During such events, the team members should reveal whether they manage to adhere to the stipulated schedule. If some issues occur, the managers are expected to explain what efforts they are going to make to mitigate adverse impacts. Consequently, one can admit that regular team meetings represent an effective method to control project processes in a narrative format.
Task 2: Is Meeting the Schedule Possible?
As has been mentioned above, the project is expected to end in two years (750 days) by the January 2024 deadline. However, it is necessary to construct a network schedule for the project to calculate the exact number of days required to complete the project. That is why Table 1 below will present the list of all the project tasks, their duration, cumulative duration of the project, and any essential comments.
Table 1: Network Schedule
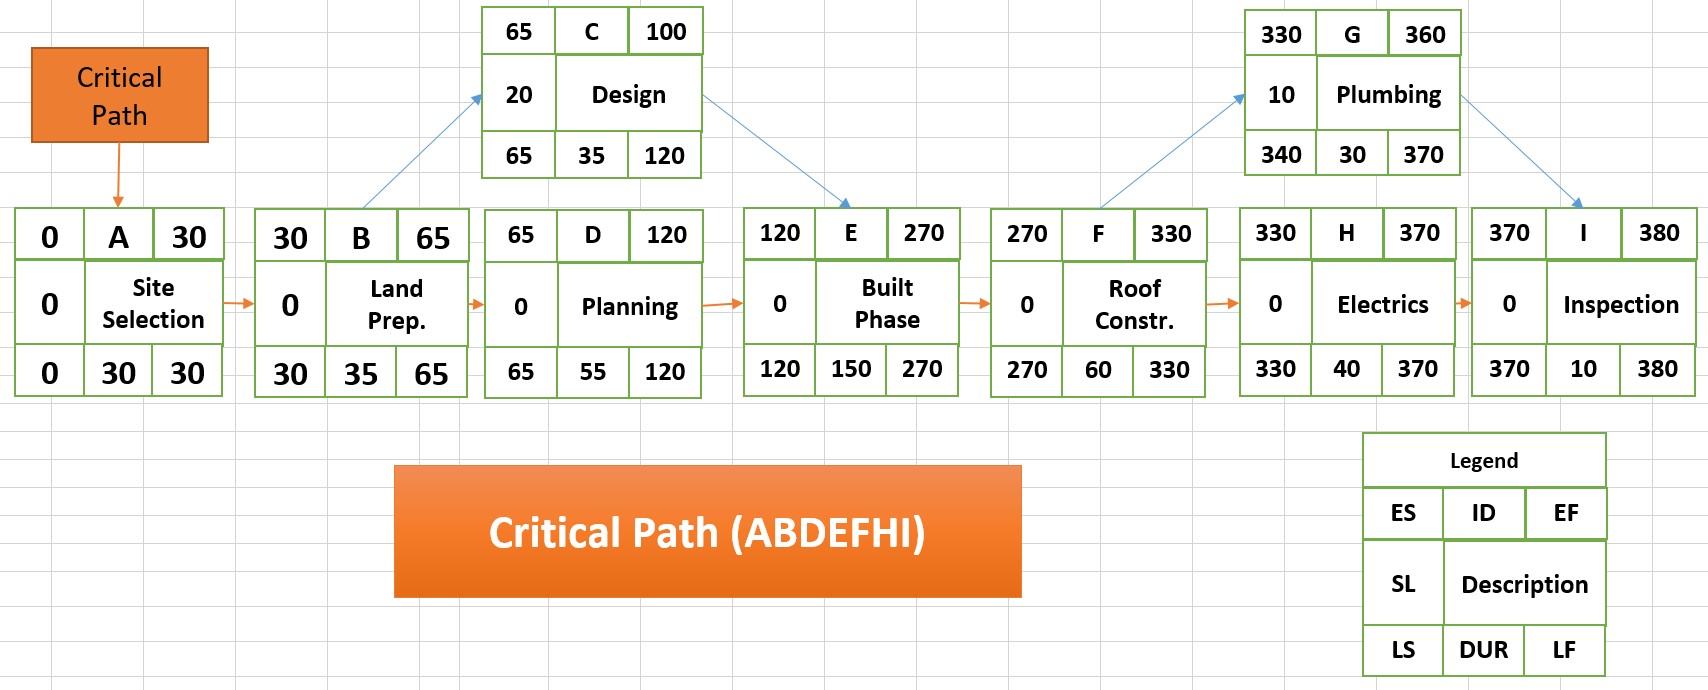
Table 1 demonstrates that if all the individual processes are performed consecutively, the project will last 850 days, which will result in a 120-day delay of the initial deadline. That is why it is necessary to create a network diagram to find the critical path for the project. Figure 3 depicts this visual, and it reveals that there are two instances when several processes are implemented simultaneously. Since Planning and Electrics last longer than Design and Plumbing, respectively, the critical path for Phase One is ABDEFHI which equals 380 days. A delay in any of these processes will increase the entire project’s duration, while minor delays in Design and Plumbing stages are allowed.
Simultaneously, Figure 4 presents the network diagram for Phase Two. It has been revealed that the N and O processes are not dependent, meaning that it is not necessary to wait for the M step to be completed to start implementing them. Thus, the critical path is N-O-JKLM, which is possible if the N, O, and J steps begin simultaneously. This path duration is 290 days, making the entire project cycle 670 days. The forward and backward passes prove that the suggested critical routes are appropriate for the project. Finally, one should claim that the parallel implementation of the N, O, and J steps will result in a 180-day reduction of the project duration.
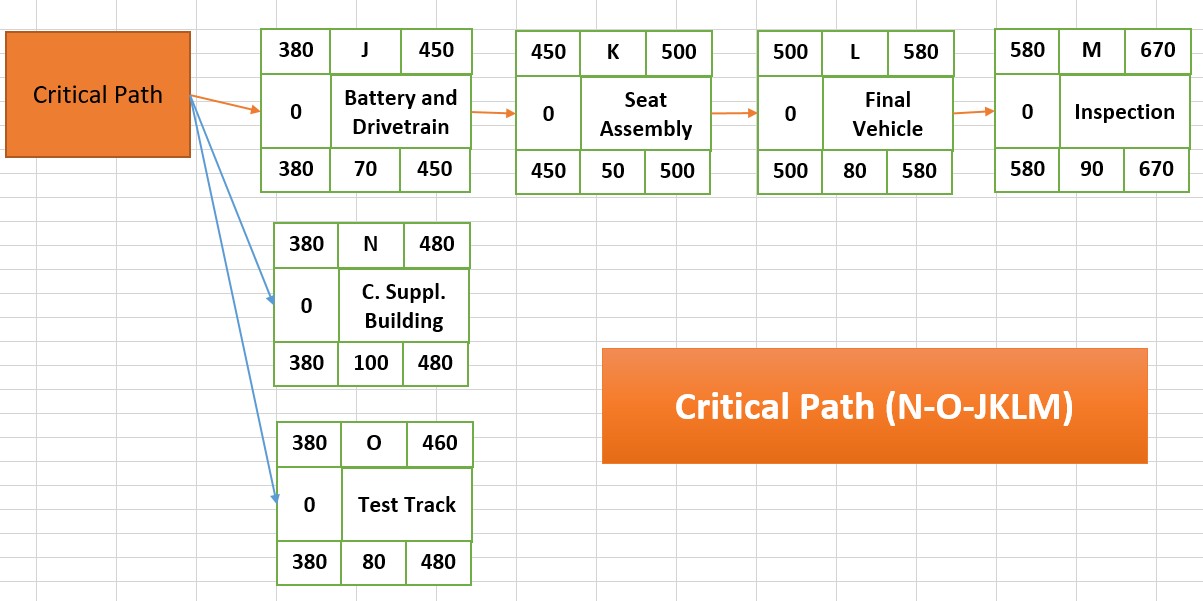
Figure 4 has demonstrated that starting the J, N, and O activities can significantly reduce the project duration. However, one should state that additional steps are needed to ensure that the schedule is met. In particular, it is necessary to ensure that each individual task is started according to the stipulated plan and no delays occur. Furthermore, since the given report advocates for simultaneous implementation of a few activities, the project will need sufficient resources and workforce, which is a requirement to deal with parallel activities.
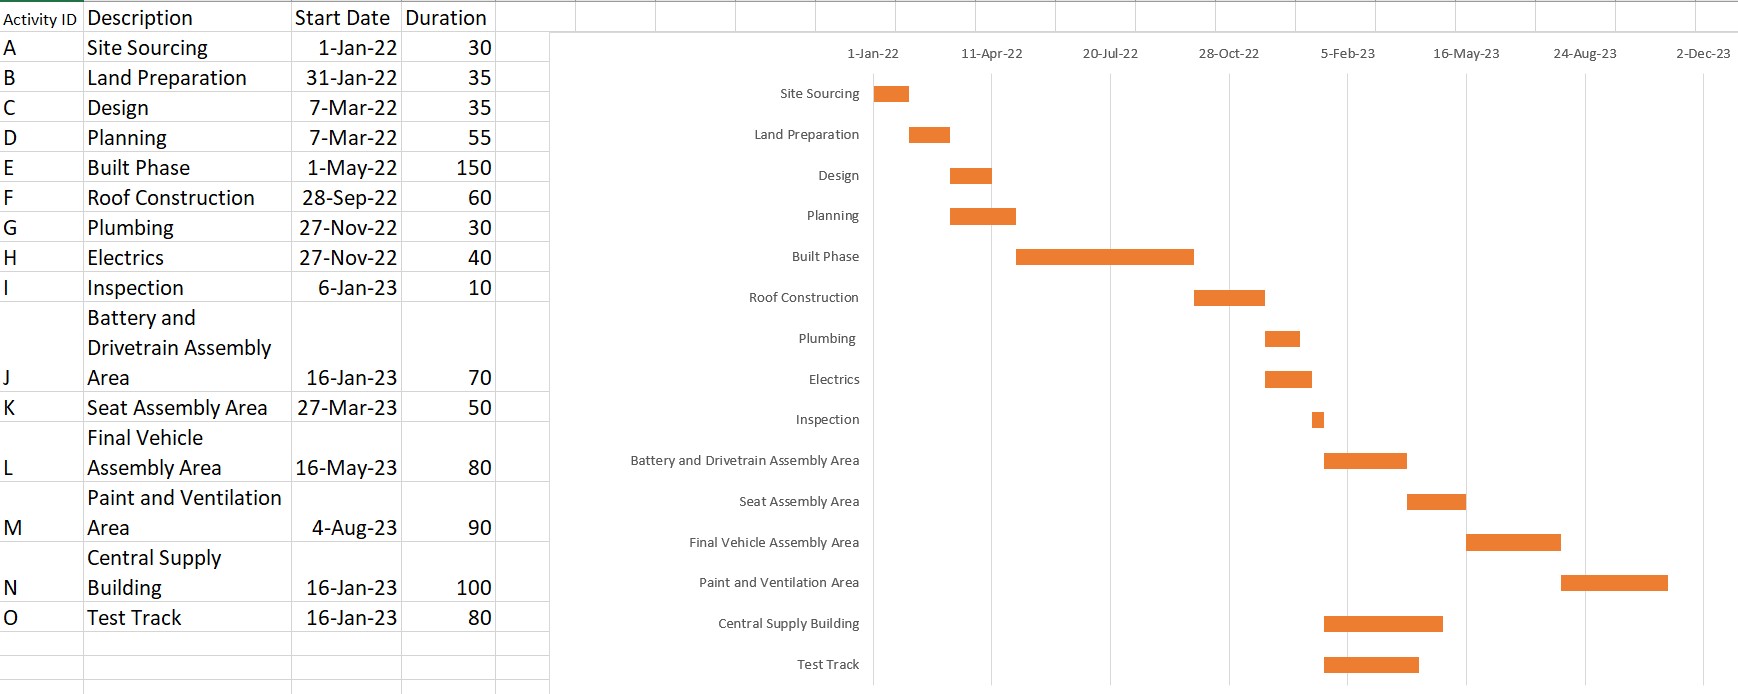
Now, it is possible to create a Gantt chart for the entire project. Figure 5 below depicts this chart that was created using Microsoft Excel. The graph reveals a straightforward process of project implementation and demonstrates that the Pain and Ventilation Area assembly should be the last activity that is expected to be completed on November 2, 2023. Thus, this information stipulates that the decision to implement a few tasks simultaneously contributed to the fact that the project should be finished by the January 2024 deadline.
However, it is impossible to mention that the Gantt chart has no limitations. For example, Ballesteros-Perez, Larsen, and Gonzalez-Cruz (2018, p. 21) admit that Gantt charts lack flexibility, denoting that it is challenging to modify this tool if the schedule changes. Simultaneously, Davis (2019, p. 147) clarifies that this visual is mainly a planning tool, meaning that it is less efficient for controlling activities. The rationale behind this statement is that it is challenging to estimate the percent completion of a single bar. Thus, one can conclude that an activity network assisted by appropriate computer software is necessary to monitor the actual progress of project activities and make necessary changes.
Task 3: Budget
The given section presents the estimated cost of the entire project. The top-down approach is utilized, which denotes that the previously created WBS was used as a basis to identify individual tasks and the required resources to implement them. Consequently, Table 2 below introduces the estimated project budget that equals $1.06 billion. This figure is slightly higher than the previously established sum of $1 billion, meaning that the project managers should look for additional financing sources.
The proposed budget is justified because it was created based on available data by Tesla. In particular, the organization has revealed how much money it needs to build a new Gigafactory in Austin, Texas. According to this official information, Tesla plans to spend $1.06 billion to build the facility (Lambert, 2021, para. 12-13). However, this sum did not include the Central Supply Building and Test Track. Consequently, the given report estimates the entire project in $1.06 billion.
Table 2: Project Budget
At this point, it is reasonable to highlight that this estimation approach implies a slight limitation. While some budget expenses were established according to the Tesla official data, other items were estimated using educated guesses. This fact could bring some inaccuracy in the final sum. However, the reliance on the already published details significantly increases the trustworthiness of the estimations made, which allows for expecting that the budget is close to the actual state of affairs.
Task 4: Project Management Methodologies
When it comes to dealing with a project, managers should choose a specific methodology. This term typically stands for a set of rules and principles that determine how activities should be planned and implemented. It is impossible to mention that some approaches are better than others because the same methodology can be suitable for one project and useless for another one. The given report will comment on the waterfall and agile methodologies and conclude which one is more appropriate for the Tesla Gigafactory project.
On the one hand, the waterfall methodology is among the most requested approaches. This strategy represents “a rigid planning in full details for the complete accomplishment of all the required tasks at the initialization of a project” (Emani et al., 2020, p. 103). In other words, this methodology depicts a linear and sequential process that should be followed to achieve the stipulated task. This approach is suitable for relatively easy projects that have a clear and evident goal that is not going to change. Furthermore, the waterfall option is appropriate when it is possible to predict and visualize the whole project when it is only about to start.
On the other hand, the agile methodology can be considered an opposition to the option above. The rationale behind this suggestion is that the agile approach relies on short-interval and step-by-step planning (Emani et al., 2020, p. 103). Ribeiro and Domingues (2018, p. 622) also add that this methodology is requested because it typically produces fast outputs and leads to cost reduction. The given approach is beneficial for those projects that are subject to constant changes and require timely responses to ensure further operation.
According to this information, one can firmly conclude that the waterfall methodology is more suitable for the Tesla Gigafactory project. The final goal is easily visualized, and the project is not expected to bring much volatility. Implementing the designed activities in sequential order can suffice to lead the project to its successful completion. That is why the waterfall methodology is a practical strategy to build the Gigafactory.
Conclusion
The project has analyzed the Tesla Gigafactory case and considered specific project planning and control methods. The investigation of the initial schedule revealed that the project could exceed the deadline if all the activities were performed sequentially. That is why the network diagram and the Gantt chart showed that a few processes, including Central Supply Building and Test Track construction, could be started simultaneously with the Battery and Drivetrain Assembly Area erection. That step can reduce the entire project duration by 180 days to ensure that it can meet the January 2024 deadline. The report has also estimated the budget and found that the project could cost $1.06 billion, meaning that managers could need to find additional financing sources. Finally, the literature review has revealed that the waterfall methodology seems appropriate for the project that is linear and not subject to many changes.
Reference List
Ballesteros-Perez, P., Larsen, G. D. and Gonzalez-Cruz, M. C. (2018) ‘Do projects really end late? On the shortcomings of the classical scheduling techniques’, Journal of Technology and Science Education, 8(1), pp. 17-33.
Burghate, M. (2018) ‘Work Breakdown Structure: simplifying project management’, International Journal of Commerce and Management Studies, 3(2), pp. 1-5.
Davis, W. (2019) ‘Gantt charts’, in William, S.D. and Yen, D.C. (eds.) The information system consultant’s handbook: systems analysis and design. Boca Raton, FL: CRC Press, pp. 147-150.
De Silva, N., Samanmali, R. and De Silva, H. L. (2017) ‘Managing occupational stress of professionals in large construction projects’, Journal of Engineering, Design, and Technology, 15(4), pp. 488-504.
Emani, M. et al. (2020) ‘Towards maturity of a software-based project management methodology considering a large-scale case study’, Journal of Applied Intelligent Systems & Information Sciences, 1(2), pp. 102-107.
Lambert, F. (2021) Tesla files for Gigafactory Texas approval, reveals budget for first phase. Web.
Mahardika, A. G. et al. (2019) ‘Analysis of time acceleration costs in level building using Critical Path Method’, Journal of Physics: Conference Series, 1424(1), pp. 1-6.
Moselhi, O., Bardareh, H. and Zhu, Z. (2020) ‘Automated data acquisition in construction with remote sensing technologies’, Applied Sciences, 10(8), pp. 1-31.
Ribeiro, A. and Domingues, L. (2018) ‘Acceptance of an agile methodology in the public sector’, Procedia Computer Science, 138, pp. 621-629.
Tereso, A., Ribeiro, P. and Cardoso, M. (2018) ‘An automated framework for the integration between EVM and risk management’, Journal of Information Systems Engineering and Management, 3(1), pp. 1-13.