Introduction
Quantitative studies often allow for a deeper understanding of phenomena (Campbell & Stanley, 1963), and a multiple regression is a method which permits for estimating whether there is a relationship between a number of predictor variables and an outcome variable (Frankfort-Nachmias & Nachmias, 2015). It can also be used to assess whether a variable mediates or moderates the relationship between a predictor variable and an outcome variable (Field, 2013). In this paper, an analysis of data provided in the file “Child Aggression.sav,” which accompanies the textbook by Field (2013) and can be found on “Datasets” (n.d.), is provided. More specifically, it is investigated whether the aggressiveness of siblings of a child is a moderator or a mediator of the relationship between the parenting style of a child’s parents and the aggression level of that child.
Prior to carrying out the analysis, the assumptions for a linear multiple regression are articulated and tested for the given data; no changes or transformations are applied to the data. A number of linear multiple regressions are then employed to analyze the data. The SPSS syntax files contents and the SPSS outputs are supplied in the appendices of the paper.
Underlying Assumptions for a Linear Multiple Regression
These assumptions may be formulated as follows (Field, 2013; Warner, 2013):
- The dependent variable needs to be quantitative and approximately normally distributed;
- The independent variables also should be quantitative and roughly normally distributed; however, they can be dichotomous or dummy;
- The observations should be independent of one another;
- There should be a linear correlation between every predictor and the outcome;
- Homoscedasticity of the outcome across the levels of every predictor should hold;
- There should be no multicollinearity between the independent variables.
Testing the Assumptions and Addressing their Violations
Assumption 1. The dependent variable (Aggression) is quantitative. Its distribution is as follows:
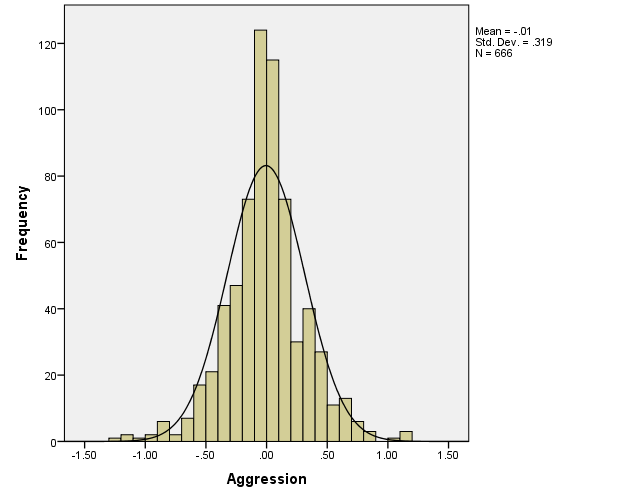
The kurtosis of the distribution is obviously positive; it is equal to 1.645 (see Appendix 1), which is an acceptable value (George & Mallery, 2016). Skewness is -.022, which is very close to normal. There are some outliers, but they do not appear to be extreme. So, the distribution can be judged close enough to normal.
If the assumption of normality was violated, it would have been possible to use data transformations (e.g., power or logarithmic transformations) to address the violations. Extreme and important outliers could have been removed from the data.
Assumption 2. Both independent variables (Sibling_Aggression and Parenting_Style) are quantitative. Their distributions are as follows:
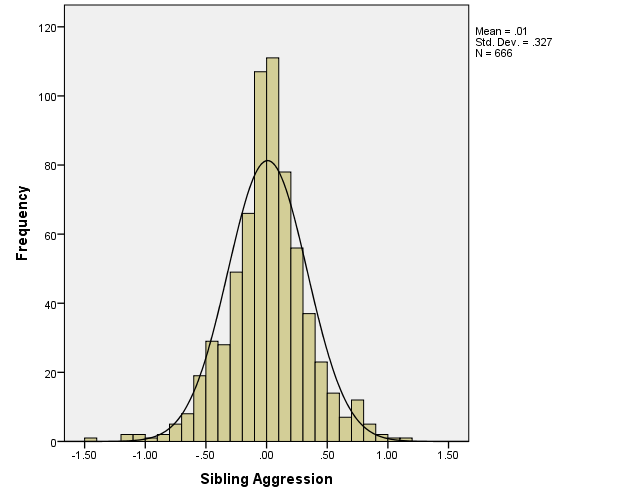
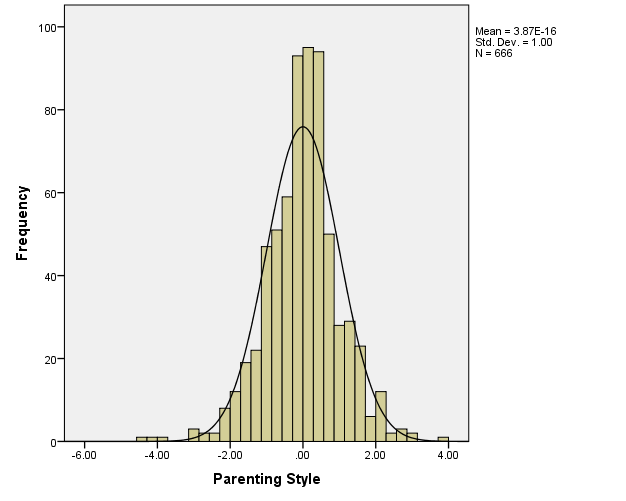
Apparently, both variables are distributed closely to normal. There are one or two outliers for Sibling_Aggression, and one or two outliers for Parenting_Style, but the histograms appear to be skewed in the direction opposite to where the outliers are located, so they may even “balance” the overall distribution slightly. In addition, the sample size is large (N=666), so these outliers should not pose a considerable threat. Therefore, no data transformations will be applied.
Violations of the Assumption 2 can be addressed in the same way as the violations of the Assumption 1 (data transformations or the removal of outliers).
Assumption 3. The observations are independent of each other; each observation represents a different child with the values of the variables independent of those of the rest of the children.
Violation of this assumption could be addressed by removing dependent observations from the sample.
Assumption 4. Linear correlation can be assessed by using the scatter plots:
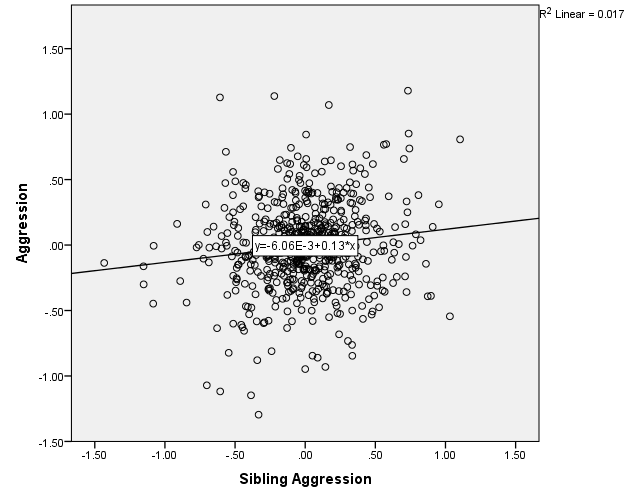
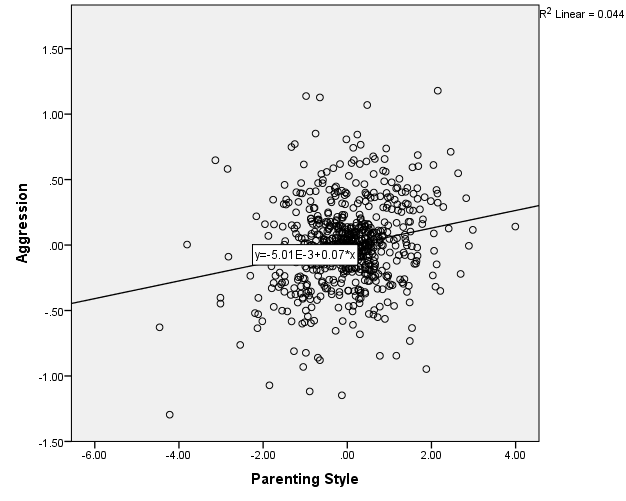
Therefore, there are slight linear correlations between Aggression and Sibling_Aggression, r=.13, and between Aggression and Parenting_Style, r=.21. The correlations are not strong, but, importantly, the scatter plots show that there are no apparent non-linear relationships, so the assumption is met.
The violation of this assumption can be addressed by data transformations (power, logarithmic, or other transformations). In certain cases, it is better to use types of analysis other than the linear multiple regression (Warner, 2013).
Assumption 5. Homogeneity of variances (homoscedasticity) across the levels of independent variables can be assessed by examining the scatter plot of standardized residuals vs. standardized predicted values (zresid vs. zpred) (Field, 2013).
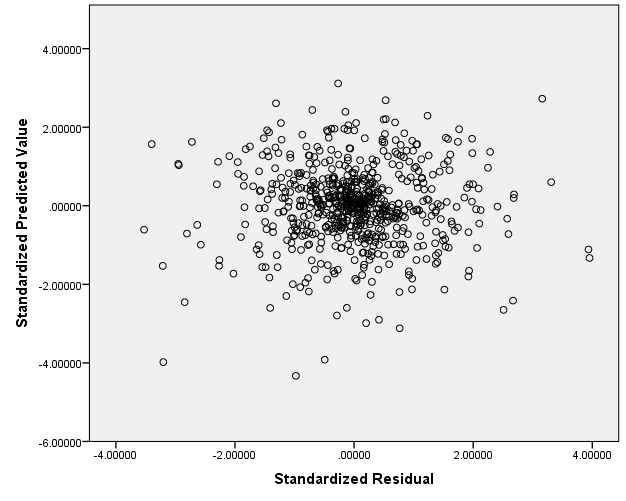
The zresid vs. zpred scatter plot shows that there is no violation of homoscedasticity assumption in the data. Additionally, it shows no violation of the assumption of linearity (Field, 2013).
Violations of homoscedasticity can be handled by using square root or logarithmic transformations of the data.
Assumption 6. Multicollinearity can be checked by obtaining variance inflation factor (VIF) (Field, 2013). As can be seen from Appendix 2, VIF=1.031, so the assumption of non-multicollinearity is not violated (Field, 2013).
The violation of non-multicollinearity can be addressed, for instance, by centering the data (deducting the mean score).
Null and Research Hypotheses for the Test
- H01: siblings’ aggression is not a moderator of the relationship between the parenting style of a child’s parents and that child’s aggression level.
- HA1: siblings’ aggression is a moderator of the relationship between the parenting style of a child’s parents and that child’s aggression level.
- H02: siblings’ aggression is not a mediator of the relationship between the parenting style of a child’s parents and that child’s aggression level.
- HA2: siblings’ aggression is a mediator of the relationship between the parenting style of a child’s parents and that child’s aggression level.
Syntax for Moderation
SPSS syntax for Moderation can be found in Appendix 3.
SPSS Output for Moderation
SPSS output for Moderation can be found in Appendix 4.
Results Tables for Moderation
The relevant output table for moderation analysis can be found in Appendix 5.
Syntax for Mediation
The contents of the Syntax files for Mediation analysis can be found in Appendix 6.
SPSS Output for Mediation
SPSS output for Mediation can be found in Appendix 7.
Results Tables for Mediation
The relevant output tables for moderation analysis can be found in Appendix 8.
Results
- The linear multiple regression using the forced entry method was conducted to check whether the aggression of children’s siblings was a moderator of the relationship between the level of aggression of children and the parenting style of their parents. No changes were applied to the data. The influence of the interaction of centered variables of sibling aggression and parenting style was not found statistically significant: β=-.039, t(662)=-1.012, p=.312, R=.234, R2=.055, R2adjusted=.050. Effect size as measured by the Cohen’s f2=.058 (small). Therefore, the null hypothesis H01 that the siblings’ aggression is not a moderator of the relationship between the aggression of children and the parenting style of their parents was not rejected.
- In addition, a number of linear multiple regressions using the forced entry method were conducted to check whether the aggression of children’s siblings is a mediator of the relationship between the level of aggression of children and the parenting style of their parents. No changes were applied to the data. The results of the statistical tests allowing for checking the conditions of mediation as described by Field (2013) were obtained:
- The predictor (Parenting Style) significantly predicts the outcome (Aggression) in the first model; β=.211, t(664)=5.554, p<.001;
- The predictor (Parenting Style) significantly predicts the mediator (Sibling Aggression) in the second model; β=.174, t(664)=4.552, p<.001;
- The mediator (Sibling Aggression) significantly predicts the outcome (Aggression) in the third model; β=.096, t(663)=2.491, p=.013;
- The predictor (Parenting Style) less strongly predicts the outcome (Aggression) in the third model than in the first model; β=.194, t(663)=5.057, p<.001.
Thus, it can be concluded that the sibling aggression is a mediator in the relationship between the parenting style of parents (predictor) and the level of aggression of a child (the outcome). Therefore, the null hypothesis H02 that the sibling aggression is not a mediator of the relationship between the parenting style and a child’s level of aggression has been rejected, and evidence has been found to support the alternative hypothesis HA2.
Adjusting the Sample Size
To obtain the results of a linear multiple regression with 80% power at α=.05, and the appropriate effect size (e.g., Cohen’s f2=.33 – a medium effect (consequently, with R=.498)) for two independent variables, it is required to utilize the sample of N=32, according to the data found in “Sample Size for Multiple Regression Table” (n.d.).
References
Campbell, D. T., & Stanley, J. C. (1963). Experimental and quasi-experimental designs for research. Boston, MA: Houghton Mifflin.
Datasets. (n.d.). Web.
Field, A. (2013). Discovering statistics using IBM SPSS statistics: And sex and drugs and rock’n’roll (4th ed.). Thousand Oaks, CA: Sage Publications.
Frankfort-Nachmias, C., & Nachmias, D. (2015). Research methods in the social sciences (8th ed.). New York, NY: Worth.
George, D., & Mallery, P. (2016). IBM SPSS Statistics 23 step by step: A simple guide and reference (14th ed.). New York, NY: Routledge.
Sample size for multiple regression table. (n.d.). Web.
Warner, R. M. (2013). Applied statistics: From bivariate through multivariate techniques (2nd ed.). Thousand Oaks, CA: SAGE Publications.