Abstract
The study of the development of anti-cancer drugs and preclinical toxicity tests has until today encountered a major problem identified as lack of a reliable in vitro-tumor model able to mimic in vivo conditions. These models provide a clear basis for understanding tumor-development processes and assists in the selection of agents from various chemicals to test the efficacy of drugs on cancer cells or tumor tissues. There are two important issues for an ideal cancer culture model. These include tumor-like cell aggregates, and the in vivo-like culture microenvironments. To address these two problems, an in vitro perfused alginate based on a three-dimensional cancer model and a 3D culture of cancer cells and related toxicity tests of the cancer drugs were done. The cells in perfusion culture showed higher proliferation rates and significantly, higher cell viabilities after a 6-day culture compared to statically cultured cells, especially for the cells in the 3D culture. MTs formed from these cancer models showed significant tumor-like morphological characteristics, a denser and highly stable structure, a higher cell viability, and varied drug response rates compared with spheroids.
Studies on the toxicity of drugs considered in this thesis relied on a systematic approach based on bi-directional cell viability studies, micro tumor formations, and drug responses on cells in different models of cancer in static and perfusion culture environments. The toxicity of paclitaxel and cisplatin drugs were compared between cells on monolayer spheroids, MTs, and real human tumor tissues with observations showing that the cells in 2D culture had the lowest cell viabilities while human tumors showed the lowest drug responses. Besides that, the response of drug to MTs was significant on human tumors, when the values of spheroids are relatively closer to the cells in 2D culture. When compared, the toxicity of the drugs on cells in static and perfusion culture with the cells in different models showed significantly different drug responses except for the cells on the monolayer. In addition to that, the difference between static and perfusion culture have shown varied behaviors on cells in different models with different action mechanisms on anti-cancer agents. The perfusion culture provides a steady, homogenous, and physiological tumor microenvironment for the growth of cells and thus affects the response of the drug and resistance rates. In conclusion, in vitro perfused 3D cancer model, developed in this thesis, proved valuable for cancer cell culture and related anti-cancer drug tests.
I could like to thank the following individuals, without their support, this work could not have been completed. Professor Zhanfeng Cui for his academic, administrative, intellectual, and moral support, Dr. Paul Ananda Raju who provided the initial foundational knowledge to conduct this work, Dr. Richard for providing the cell lines; Dr. Yasser for his fluomicroscope training and technical supports. Further, thanks to Dr. Cathy and Dr. Shengda Zhou for their administrative support and thoughtful advice, Dr. UdayTirlapur for the knowledge on the multi-photon microscope. On the other hand, my thanks go to Dr. zhaohui Li for her academic advice and bioassay advice, Dr. Xia Xu for her training session on Tissue Flex bioreactor making and setup; Mr Pierre-Alexis Mouthuy for his support and discussion of collagen scaffold; Dr. FengGu for his laboratory/human tissue facilities, assistance with the human cancer tissue work. On the other hand, my thanks go to Miss Kathy for advice on statistical analysis. All the other members of the Institute of the Biomedical Engineering group for scientific discussions, Tianjin Medical University Cancer Institute and Hospital for the supply of human tumor tissue samples, and all my friends and family members (especially mom and dad) for their moral support.
Introduction
Background
Despite significant advances in both radiotherapy and chemotherapy in the treatment of cancer over the last 200 years, cancer, one of the most dangerous diseases still remains one of the leading causes of deaths in the world today (Jemal et al., 2005). A statistical analysis by Thurston (2006) has shown that nearly one in three of the population in the world suffer from cancer while one in four die from cancer. In addition to that, Thurston (2006) and Thurston (2006) have shown that cancer is increasingly becoming prevalent and the chances of getting completely cured have declined significantly.
Different techniques are available for the treatment of cancer today. The technique often applied on a patient depends on the type of cancer and the progress or stage of the disease in the patient. Combinations of chemotherapy, surgery, and radiotherapy have shown significant improvements in the treatment of cancer when compared with the single treatment approach. Chemotherapy is applied before surgery to shrink tumor tissues making their removal easier. In addition, applying chemotherapy after surgery destroys and clears the remaining cancer cells completely. The importance of applying chemotherapy is to provide a chance for the development of anti-cancer drugs. However, currently, a major limitation in the development of the drug is limited knowledge on tumor model that could provide the selection criteria for agents from various chemicals to test the anti-cancer drugs for their efficiency in destroying cancer cells or tissues before sanctioning clinical usage of the drugs.
According toHorning et al., (2008), earlier studies and tests were at first animal-based in vivo models while current models are mostly 2D cell line based on in vitro models. However, these models were ineffective. Researchers took nearly 100 years to develop a reliable model for testing the drugs. The animal model presents similar drug responses due to the in vivo environment but the difference between animals, usually the mice and human body cannot be ignored. Cells based on the monolayer assay have become the main techniques in many stages of anti-tumor drug tests especially in the first step of studying the discovery of the anticancer drug. That is due to the ease of providing enough samples for large amount chemicals to test from the monolayer structure. However, when applying the model to test the efficiency of a drug, the discrepancy between the monolayer structure and the in vivo situation is significant. The three-dimensional culture is believed to mimic the 3D structure, in vivo-like tumor characteristics, which spans the gap of the monolayer culture and the animal test model.
The 3D structure affects the growth of cells and genes thus affecting the drug response as well. It has been proved that the IC50 values of anti-cancer drugs are significantly higher in 3D models than in 2D culture models (Horning et al., 2008). An in vitro 3D tumor model that could accurately show the toxicity assay of anticancer agents is apparently required for in vitro cancer cell cultures and in the research for anticancer drug development. However, in the study of 3D cancer cell culture, it is a challenge to design a scaffold, which could process the desired tissue properties (Horning et al., 2008). Current scaffolds have more or less limitations not only tumor biology but also have technical limitations such as time-changing environments, are time-consuming, and costly. This study took into consideration biomedical, technical, and economic needs when developing the alginate-based perfusion in vitro3D culture model, which employed the 3D cancer cell culture using related drug tests techniques.
Scope of Thesis and Thesis Outline
There are many techniques to carrying out 3D culture. These include scaffolds based 3D models with the most popular being the spheroids model based on culturing onto an agar-coated surface. Depending on the culture approaches and biomaterials used for 3D culture, test cells present different growth status and characters and all of these will have an effect on the response of drugs to the agents during the test. Thus, the main purpose of this study is to build a reliable model to better present in vivo tumor characteristics and provide accurate data as a baseline for clinical treatments.
In order to improve the accuracy of tests the toxicity of anti-cancer drugs, two main methods are used to improve both tumor tissues and the tests environment. Improving tumor tissue implies building a 3D micro tumor tissue, which has similar characteristics to the real tumor tissues from the human body by culturing cells in 3D scaffold. This could reduce the differences between real tumor tissue and the samples, to be used in drug tests to provide more reliable toxicity test results. In order to achieve this purpose, DLD1 and NCI/ADR cells were cultured in the developed alginate based in vitro3D culture model to form 3D micro tumors that have the 3D structure and similar characteristics to real solid tumor tissues. The MTs were compared with the currently most used 3D model (spheroids) and real human tissues from breast cancer and colon cancer patients to study the discrepancy between these models. Secondly, the perfusion culture was added into the alginate based 3D culture model in a stable physiological environment for tumor formation and drug tests procedures. Not only can the perfusion system improve the tests environment, which is similar to the internal human environment, but also it can support MTs formation and improve cell viability by keeping perfusing nutrients in which it is acting as blood vessels in tumor tissues active. Therefore, owing to these two improvements, the alginate based perfusion 3D culture model developed in this thesis is believed to improve the accuracy of anti-cancer toxicity of the drugs tests. The results and concepts in the proceeding chapters will be of value to researchers in the development of tumor models for anti-cancer drug tests.
Chapter 2 discusses the historical developments of the cancer disease, chemotherapy, and types of anti-cancer drug test models. Chapter 3 focuses on the basic toxicity study of cisplatin and paclitaxel to DLD1 and NCI/ADR cell lines cultured on a monolayer. In addition to that, the concentrations of each of the three drugs selected according to the drug dose responses will be conducted to study cisplatin and paclitaxel. Besides this, observations on the toxicity of alamar blue were done during the cytotoxicity study with the MTT assay selected for further toxicity of the drugs measurements. The next chapter is the basic study of the research with the following structure: Chapter 4 is devoted to adaptation of bioreactors into the monolayer cell culture, perfused cell culture, and toxicity of the drugs assay. On the other hand, in order to apply the three dimensional culture, the structure of bioreactor was improved as compared to the old version developed by Z.F.Cui and X.Xu in our lab (Cui et al., 2007). As a comparison of static and perfusion culture, study cells were cultured based on the method of monolayers. The proliferation and viability of cells were measured during the culture periods and the toxicity of the drugs responses were compared for the two drugs. The study in this chapter provided the basis for developing 3D perfusion culture model in the next part of the work.
In Chapter 5, the alginate based in vitro three-dimensional perfusion cancer model was developed. This model was employed to DLD1 and NCI/ADR 3D cell cultures and toxicity of the drugs study of cisplatin and paclitaxel. This part of the study focuses on three types of comparisons. First, comparisons of the drug responses of cisplatin and paclitaxel to DLD1 and NCI/ADR cells were done between 2D and 3D culture. Secondly, the characteristics of MTs formed in alginate beads were compared and drug responses to spheroids from the agar-coated surface were examined. Finally, the growth of cells status, MTs formation, and drug responds are examined when cultured under static and perfused conditions. Based on these comparisons, the 3D perfused cancer culture model developed in this thesis was proved as an improvement where cells in this model were presented with characteristics of the tumor-like structure. Thus, the model can provide data on the in vivo-like microenvironment for 3D cancer cell culture, relative toxicity of the drugs, and chemo-resistance in the study. Chapter 6 is a report on the study of the toxicity of drugs on the human tumor tissues, breast cancer tissue, and colorectal cancer tissues. This study compares the results with MTs, spheroids, and monolayer culture. A conclusion and suggestions for future works to understand in detail the complexity of in vitro tumor models, the studies are discussed in Chapter 7.
Literature Review
Cancer Disease and Chemotherapy
What Is Cancer
Nearly one third of the global population suffer from different types of cancer today with a prevalence rate showing significant appreciation. Studies by Thurston (2006) in the United Kingdom as an example showed the percentage of deaths related to cancer as only 10% of the entire deaths in the 1900s. New statistic show that about 160,000 people die from cancer every year, which is approximately 25% of all annually, registered deaths in the U.K. In addition to that, a statistical analysis by Thurston (2006) has shown that nearly one in three of the population in the world suffer from cancer while one in four die from cancer. On the other hand, Thurston (2006) has shown that cancer is increasingly becoming more prevalent and the chance of getting completely cured has diminished significantly. Even if the lumpectomy is successful, chemotherapist treatments remain dangerous on the normal tissues during and after the treatment period when applied concurrently with drugs to kill the tumor cells. This might leads to renal failure or damage to the immune system damage resulting from toxic reactions. One optimistic view is that while the patient has successfully undergone all treatments and seems to attain a cancer free cells status, we still are not sure whether the cancer will attack the patient the following years. Since cancer is a gene-related disease, it is a hidden problem mainly due to the occurrence of unexpected changes of the gene structure, a situation not to ignore, giving us a big therapeutic challenge(Kamb, 2005).
Cancer is a complex disease since caused by uncontrolled growth of cells in any part of the human body, introducing a lump of solid mass of cells known as a tumor. This is different from normal tissues with a growth rate of new cells and the death of old cells balanced. A disruption of the balance characterizes cells attacked by cancer. This disruption results from uncontrolled growth of cells or the loss of the cells’ ability to undergo suicide by a process called “Apoptosis”.
Cancer could originate in any organ and could spread to other parts if it is a malignant tumor. Scientists use a variety of technical names to distinguish different types of carcinomas, sarcomas, lymphomas, and leukemia (Weinberg, June 2006). Carcinoma is the most common type of cancer, arising from the cells that cover external and internal surfaces of the body such as the Lung, the breast, and colon. Sarcomas are cancers caused by cells found in the supporting tissues of the body such as bone, cartilage, fat, connective tissue, and muscle. Lymphomas are cancers that results from the lymph nodes and tissues of the body’s immune system. Leukemia is a class of cancer of immature blood cells that grow in the bone marrow and tends to accumulate in large numbers in the bloodstream.
Previously, people regarded cancer as a potentially dangerous disease due to cancer cells’ ability to spread to any part of the body, making surgical intervention impossible. Cancer is capable of spreading by two mechanisms: invasion and metastasis (Cavalli, 2009). Invasion refers to the direct migration and penetration of cancer cells into neighboring tissues. Metastasis refers to the ability of cancer cells to penetrate into lymphatic and blood vessels, circulating through the bloodstream to invade normally functioning tissues in other parts of the body. The tissue, which spreads this way, are called malignant tumors.
Cancer is perceived as a disease that attacks its victim with no apparent medical reason. While scientists have not known actual causes of cancer, a number of causes have been identified in scientific circles (Danaei et al., 2005). According to Doll and Peto, (1981), besides the intrinsic factors such as genetic heredity, diet, tobacco, and hormonal problems, scientific studies point to key extrinsic factors contributing to cancer developments as triggered by changes in a cell’s genes, chemicals, radiation, and viruses or bacteria (Kuper et al., 2000). Chemical and radiation induced damages on genes, virus induced damages, and alterations introduced into genes and hereditary transmitted alterations in genes makes a person more susceptible to cancer attacks. Genes are inherited instructions that reside within a person’s chromosomes. Each gene instructs a cell on ways to build a specific product, in most cases, a particular kind of protein. Gene alterations or mutations in various ways forms part of the mechanism causing cancer.
One group of genes leading to the development of cancer are damaged genes called oncogenes (Paramythiotis et al., 2003). By producing abnormal versions or quantities of cellular growth-control proteins, oncogenes cause a cell’s growth-signaling pathway to become hyperactive. The second in the group of genes strongly correlated to the development of cancer are the tumor suppressor genes. Tumor suppressor genes, such as the p53, according to Greenblatt et al., (1994), are normal genes with an absence that has the susceptibility of causing cancer. In other words, if a pair of tumor suppressor genes are either lost from a cell or inactivated through mutations, the functional absence allows the development of cancer. Individuals who inherit genes have an increased risk of developing cancer since they are born with a defective copy of a tumor suppressor gene. On the other hand, genes come in pairs (one inherited from each parent). An inherited defect in one copy will not lead to cancer, but if the second copy undergoes mutation, the person may develop cancer since there are no longer any functional copies of the gene.
A third type of genes implicated in cancer is the DNA repair gene. DNA repair genes code the proteins whose normal function is to correct errors that arise when cells duplicate their DNA prior to cell division. Mutations in DNA repair genes can lead to a failure in repair, which in turn allows subsequent mutations to accumulate (Edelmann et al., 1997).
The treatment of cancer is often a multipronged approach depending on the type of cancer and the stage or progress it has made into patient. Currently, the main approaches of cancer treatments are surgery, radiotherapy, and chemotherapy. Early diagnosis can lead to higher chances of cure and a reduced risk of the formation of secondary tumors when chemotherapy and radiotherapy are systematically applied.
Surgery is the first line of treatment used to fight cancer but is only effective when tumors are small and well defined. Even in the early stages, a patient needs chemotherapy and radiotherapy treatments after undergoing surgery to eliminate any left out cancer cells. Typically, chemotherapy and radiotherapy are complimentary before surgery to reduce the tumor and make surgery easier to remove any remaining cancer cells. However, when a tumor has spread to other organs of the body, it is difficult to remove all the tumor tissues and keep the organs functional.
On the other hand, radiotherapy uses X-ray or radiopharmaceuticals, as sources of γ-rays, which damage DNA and kill cells. As X-ray cannot only damage tumor tissue, radiation is directed towards the local tumor from a focused beam to protect healthy tissues. However, stray radiation exposes healthy tissues to the destructive effects of the side effect caused by the radiation. However, the latest technology consists of multiple beams configured to focus high-energy intensities on tumor tissues while exposing surrounding tissues to lower radiation energies. However, cancer cells are hypoxic compared to normal tissues, hence less sensitive to irradiation. Thus, oxygen or radio sensitizing drugs applied prior to radiotherapy sensitize tumor cells to get better results.
Chemotherapy cancer treatments rely on low-molecular-weight drugs to control the growth of cancer cell by killing tumor cells. Chemotherapy could assist surgery and radiotherapy to control the growth of tumor by killing cancer cells left behind after surgery or cells in the metastases status (Herskovic et al., 1992). Nevertheless, anti-tumor drugs are toxic to both cancer cells and healthy cells inducing side effects such as bone marrow suppression, GI tract lesions, hair loss, nausea, and the rapid development of clinical resistance (Gottesman, 2002). It is important to understand the development of chemotherapy as explained in the next section.
According to Talalay et al., (1988), to prevent cancer, the first step is to reduce the chances of exposure to particular kinds of carcinogens and virus with the greatest cancer hazards. Thus, people are advised to pay daily attention by reducing the use of tobacco products and avoiding excessive exposure to sunlight. In addition to that, limiting uptake of alcohol, tobacco, fats, and calories are other recommended measures (Armstrong and Kricker, 2001; Xu et al., 1992).
History of cancer
The Greek physician Hippocrates 460–370 B.C., regarded as the father of medicine, was the first to coin the word “Cancer”. He described tumors as carcinos and carcinoma also referred to as crab in Greek (2010). At the time, Hippocrates thought that the finger-like spreading tumor was similar to the shape of a crab. Later, in 28-50 B.C.,Celsus, a Roman physician, used the term Cancer instead. The term cancer also referred to which also referred to the crab in Latin. Another Roman physician Galen named tumor as “oncos”, in Greek, meaning swelling. He believed cancer was curable by cutting or cauterizing the infection at an early stage. Although this term is not well accepted as “cancer”, “oncology” is used instead to describe a specialized area of cancer research (Houten, 2009).

According to historical records, the earliest evidence recorded about cancer was by the ancient Egyptians, dating back to 1500 B.C. According to a copy found in an ancient Egyptian textbook on trauma, 8 cases of surgery were documented on tumors that happened on breasts. They did the palliative treatment with a tool called a fire drill, the only recorded cancer treatment. The ancient Egyptians thought God caused cancer. However, recent research at Manchester’s KNH Centre for Biomedical Egyptology of Egypt mummies has shown cancer was a rarity in ancient Egypt. The conclusion of this study is that cancer is a manmade disease and might be cause by environmental factors (Manchester, 2010).
Hippocrates’s theory proposed at the time that the human body was composed of four fluids, the blood, phlegm, yellow, and black bile. He argued that the cause of cancer was an excess of black bile. It was until the beginning of the Renaissance period, as early as the 15th century, when the Italians started to get a better understanding of the human body. At that time, scientists showed some important theories during that period, laying the foundation for the study of cancer. These included the understanding of blood circulation, the idea that the removal of a tumor was not possible if it had invaded the surround tissues without anesthesia. In 19th century, Rudolf Virchow, also known as the finder of cellular pathology made a big step in the cancer research owing to the use of the microscope. The microscope not only enabled a better understanding but also helped doctors to better diagnose the problem. The 20th century saw progress in many relevant area of research in cancer. Researchers had spread their research into cancer stem cells, Angiogenesis, Tumor Suppressor Genes, Tumor Microenvironment, Oncogene, Targeted Cancer Therapy, and any others similar areas. Better understandings of the characteristics and behavior of cancer cells lead doctors to apply systematic treatment methods to kill these cells, which spread through the body after surgery. In addition to that, after long time fighting with cancer, today doctors are able to give patients better diagnosis with multiple modern treatments. That is achievable by removing the primary tumors by combining radiation therapy with chemotherapy.
History of Chemotherapy and Anticancer Drug Development
Prior to the 20th century, the treatment of cancer was mainly limited to surgery and radiotherapy. However, due to micro metastases, the rate of cure was limited to approximately 33%. The use of Chemotherapy to fight cancer started as early as the 1900s. At that time, the German chemist, Paul Ehrlich, the father of chemotherapy emphasized on the technique by using chemicals to treat the disease. He was also the first person to employ the animal model to test the potentiality of anticancer chemicals. It was the first case introduced using drugs in the treatment of cancer in the human breast infected with cancer. The evidence showed that combining chemotherapy with surgery and radiotherapy might cure advances in cancer and make the drug attain optimal effects (Urschel et al., 2002, Steel & Peckham, 1979). The importance of chemotherapy created the opportunity for the development of anti-cancer drugs. The following picture lists the major events of cancer chemotherapy and related drug developments.
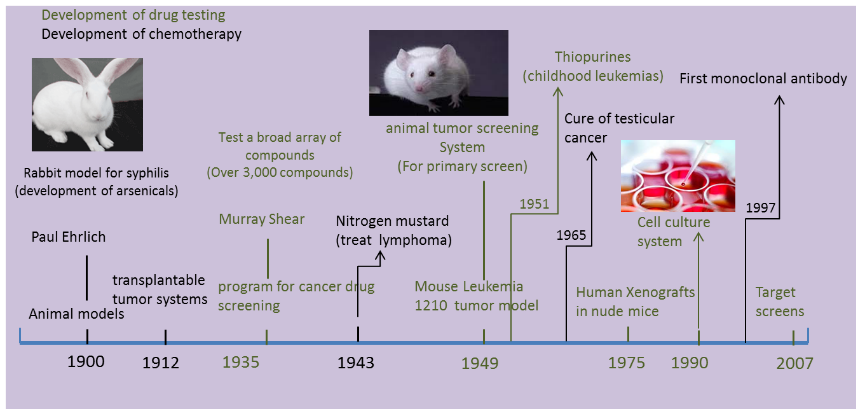
The two major limitations in drug developments using the tumor models were the inability to mimic accepter agents and the supply of facilities to test these drugs in any clinical organization. The first animal model used for drug tests was a rabbit model, used by Paul Ehrlich to test arsenicals to treat syphilis. However, early models for cancer drug tests were mostly tumor models in mice. In 1910s, George Clowes of Roswell Park Memorial Institute (RPMI) in Buffalo, New York, in the Roswell Park Memorial Institute made a major breakthrough with the first transplantable tumor model developed in rodents (DeVita and Chu, 2008).
Based on Paul Ehrlich’s research, early research scientists focused their studies for decades on different cancer models to test cancer drugs. The early models based on mice included the Sarcomas 37 model, usually used to test an array of compounds discovered by Murray Shear in 1937, the S180 model, and some other models also based on murine. Among the large amounts of different tumor models, Leukemia 1210 (L1210), murine leukemia induced by a carcinogen was considered as the most versatile animal tumor screening system and was adopted by the NCI as its primary screen (Grever et al., 1992).
It was in 1975 when scientists wanted to improve their prediction activities on anticancer drugs in humans that the L1210 murine model was replaced with Xenograft models. Here, human cancer was transplanted into an immune-deficient mice (Mattern et al., 1988).This new screen method can test a drug in vivo using similar tissues. However, due to the high cost and long pre-work periods, the numbers of drugs tested reduced significantly from 40,000 per year to 10,000. Similar researches on xenograft models and drug tests were conducted at the time (Dass et al., 2007, Needham et al., 2000).
Ying Zhang et al., described a systematic method to inhibit the growth of tumors in vivo culture of anti angiogenicendostatin-secreting Chinese hamster ovary (CHO) cells in microcapsules as small as 200μm in diameter (Zhang et al., 2007). The microencapsulation-based in vivo culture method offers a safe, highly efficient, and low-cost anti-angiogenesis approach to tumor therapy. The implantation of microcapsules of small sized and highly concentrated peritoneal cavity has the potential for use in the treatment of solid tumors.
J. K. Peterson and P. J. Houghton (Peterson & Houghton, 2004) reviewed the value and limitations of xenograft models by comparing data from animals and the human body. Results showed a significant difference between them, i.e. the in vitro serum protein binding showed 80–82% irofulven binding in mice and 51–52% binding in man, when systematically exposed to irofulven across the species.
These findings helped researchers understand the variance between preclinical tests with concrete clinical activity results. The agents had antitumor activities on tumors in mice, but were shown to fail when tested in man. These disappointments led to reasonable doubts about the true value of xenograft rodent tumor models by accurately identifying agents with significant clinical utility (Voskoglou-Nomikos et al., 2003). As discussed above, perhaps the basic problem was the difference between man and animals.
By 1990, developments in drug testing methods saw new developments in screen system based on human cancer cell lines become the main cancer tests and treatment methods. This improvement was due to the development of culture solutions first developed by the English physiologist Sydney Ringer. After nearly 30 years of study, Ross Granville Harrison published the results of his experiment and the tissue culture technique used in the study. In later years, cell culture techniques advances became the main methods to support research in biology, virology, and oncology. Thus, culturing cells on monolayers in the laboratory exposure of drugs became new and significantly utilized techniques for tests the toxicity of cancer fighting drugs.
Anticancer drug
Overview of mechanisms of action of chemotherapeutic agents
The anticancer drugs use different active mechanisms to control or interfere with the growth of tumor cells. Anti-cancer drugs fall into six groups based on the different target mechanisms. These mechanisms include, antimetabolites, DNA-Interactive Agents, anti-tubulin agents, signal transduction inhibitors, hormonal agents, and biological response modifiers, anti-angiogenic agents and so on. The following table lists typical anti-cancer drugs of each group and the specific action mechanisms for each category (Table 2.1).
Antimetabolites
The Antimetabolite mechanism mainly acts by interfering with key metabolic pathways which are relevant to the growth of the cells (Davidson, 1960). Typically, that is one of the main reasons for naming this category of drugs as anti-proliferative agents. In their active forms, the drugs target the high metabolic rates of target cells enabling the drugs to acquire selective toxicity since the growth rate of cancer cells is higher than normal cells.
Agents in this family fall into different categories since they inhibit different stages of the synthesis of DNA or target enzymes. Methotrexate is one of the main antifolate drugs that act by inhibiting the production of the enzyme dihydrofolatereductase (DHFR). On the other hand, hypersensitivity reactions are always followed by other forms of treatments during the treatment of a cancer patient (Alkins et al., 1996). One method to attain the after treatment is to administer purine. Purine antimetabolites act on the latter stages of DNA by inhibiting the enzymatic pathways in the biosynthesis of purine nucleotides. Pyrimidine antimetabolites work by interfering with pyrimidine synthesis, further inhibiting the synthesis of DNA in the S-Phase. In addition to that, there is a family of other drugs which work based on the thymidylate synthase, adenosine deaminase, and ribonucleo tide reductive inhibition mechanisms.
When administration of these drugs are done on a patient, healthy cells especially the high metabolic cells such as bone marrow, hair-follicles, and parts of the gastrointestinal (GI) tract, are killed in the process. In practice, that is one of the significant reasons for the side effects caused by the administration of ordinary drugs after applying other forms of treatment on a cancer patient.
DNA-interactive agents
DNA-interactive agents are a significant diverse group of agents interfered with when interacting with deoxyribonucleic acid (DNA).The mechanism for the agents is to interact with DNA processing by damaging DNA or by inhibiting the duplication of DNA repair. This family of drugs includes alkylating agents, cross-linking agents, intercalating agents, topoisomerase inhibitors, and DNA-Cleaving agents. The agents interact with DNA double helix by intercalating between the base pairs of DNA, intrastrandor-intrastrand cross-linking by binding to the helix to cleave to the DNA strands.
However, treating the target with these types of agents has side effects that lead to hair loss, GI toxicity, and irreversible bone marrow suppression. On the other hand, this treatment has the susceptibility of increasing the risk of non-lymphocytic leukemia on the patient in the latter part of life due to the damage caused on DNA during the treatments period (Noseda et al., 1988).
Other anti-cancer drugs
Beside the mechanism of interacting with DNA processing and cell division, there are other types of drugs working on different techniques. The first group is Signal Transduction Inhibitors that work by targeting the signaling processes of cells, including the growth, apoptosis, cell cycle, and intracellular protein degradation (Adjei and Hidalgo, 2005). According to Dumontet and Sikic, (1999), the second group are the antitubulin agents that act by disturbing dynamism of the microtubule, for example, by spindling the formation or disassembly of cells, leading to cell mitosis blockages and the eventual the death of cells (Dumontet and Sikic, 1999). Paclitaxel is a typical drug in this group that is hormone-dependent, which targets tumors in breast cancer, prostatic cancer, or neuroendocrine tumors. However, new types of drugs have emerged in chemotherapy. According to Miyachi et al., (1997), Marme (2003), and Marty and Pivot (2008), these new drugs include Biological Response Modifiers (BRMs) and Anti-Angiogenic agents, that have further enlightened new research and sight into the field of the treatment of cancer. Each category of drugs has its own advantages and limitations, making a combination with two or more drugs much more effective in comparison with using a single agent for chemotherapy. That might result in higher therapeutic efficiencies in the clinical treatments of cancer (Peters et al., 2000). Since many of the of new drugs are still in the earlier development stages, providing a suitable anti-tumor drug test model to predict the toxicity and efficiency of the dosage administered on a cancer patient can significantly contribute to the development of drugs and chemotherapy in the treatment of cancer.
Advance cancer drug tests models
The discovery and development of drugs to treat cancer is a long-term, highly risky, expensive, and time-consuming undertaking. The undertaking also consumes a significant number of human resource expertise besides other demands exerted on other resources. Thus, the whole process is a risky investment for industries leading to a significantly small number of one in ten attempts coming up with positive results in attempts to bring the production of cancer drugs into the market. Due to the exponential increases in the cost of developing the drugs, identifying poor candidates as early as possible has become the guiding principle in the discovery of cancer drugs. Hence, considering the economic advantages, industries have taken the option to rely on cell-based validations earlier in the drug development process.
On the other hand, recommendations show that when using chemotherapy treatments, the administered dosage should be the optimum dose that a patient can tolerate. If the dose cannot attain an effective level, the target tumour cells cannot be killed completely, decreasing the uptake of administered cancer drugs. At the same time, it can also support the ability to repair the damaged cancer cells. This helps tumour cells to develop a resistance to the drug, resulting in the decrease in therapeutic effects. However, if an overdose of the drug is administered on the patient during the clinical treatments or by use of a high drug-injection speed, it becomes dangerous for the patients as the patient can be killed by toxic reactions instead of the disease itself. However, recommendations show that a small range of dosages of the drug on the patient to ensure therapeutic effects with little toxic effects is important.
Drugs produced in the industry are not allowed for use in clinical treatments or brought to the market unless preclinical tests are conducted to ascertain their safety. These tests are usually on animals including Human Xenograft and Mouse Allograft as examples. However, in the therapeutic area, the patient is exposed to risks since the prediction data of the activity of the drugs by animal tests are either ineffective or inaccurate. Actually, these models were not predictive for some classes of cancer (Voskoglou-Nomikos et al., 2003). Either for the patients suffering from cancer or for industries, which gamble with the efficiency of the therapy characterized by in vitro anticancer drug tests models, is definitely needed.
The aim of drug tests is first to identify potential drug candidates which are used as the basis to develop a new drug. Secondly, drug tests can provide adequate drug dosage range for clinical treatments. Hence, providing trustworthy drug tests data is very important cancer research. However, there is lack of adequate in vitro models for tests anti-tumor drugs, though some models have existed for drug tests. The in vivo model is one in which the cells grow in the living body, mainly to test the dugs on animals. Drugs administered into animal in a vivo environment have shown reliable results. However, it has its own limitations largely due to the differences between human and animal species. Besides, in vivo tests are time-consuming and expensive.
To simplify the drug-tests procedure, cells and organ cultures have been used in vitro models in the research and tests for cancer drugs. In contrast to drug tests in vivo environments, tests in vitro have a number of advantages such as the ability to focus on specific elements, which are effective on tumours to optimise the development of new drugs. Since the number of experiments needed for different tests is large, in vitro tests was prioritized in the lab. However, in the case of in vitro tests, the condition is not similar to the conditions inside an organism. There is a distinct demand for the development of in vivo-like models and more physiological in vitro models. There is still a long way to go to develop a test system that can reflect the environment in the human body, but, at least, we can shorten the distance from the in-vitro test models into real tumours in-vivo environments. To attain this goal, various cancer models were developed by research groups worldwide to focus on various specific functions.
In Vitro cancer model
The in vivo AU8 model built into the living body employs the animal body as the guest body. Researchers inject cells into the animals and test them to get useful data, which is used as the basis to approve clinical trials of candidate drugs. Established facts show that when human cancer cell transplants occur in mice, they retain a significant number of characteristics of the original tumor (histology, chromosomal abnormalities, and surface antigen expression). On the other hand, if we could foresee the activity in vivo, with the required properties discovered in vitro tests, the discovery of drugs could reliably lead to industrial manufacturing of anti-cancer drugs (Popiołkiewicz et al., 2005).
It is worth noting that In vitro tests imply that any experiment-taking place in a controlled environment in the laboratory is outside the living organism. Previously, monolayers, together with organ cultures, have been the most significant and popular in vitro models for cancer research.
In contrast to drug tests in vivo, tests in vitro have a number of advantages:
- The in vitro method can significantly reduce the number of animals needed for toxicity tests and effects of different kinds of drugs.
- Monolayer culture models are easy for researchers to operate and convenient to set up.
- For in vitro tests, it is easy to find out the activity of drugs with chemical agents or elements of the anticancer drugs and their effects on tissues or tumors. It is possible to aim at the specific effects on tumors in order to optimize and develop new drugs. For example, a study by Joanna Popiolkiewicz et al. Popiołkiewicz et al., (2005), using the in vitro toxicity tests methods was done by selecting two less toxic compounds among the most active compounds toward cancer cells. These were among the most active derivatives, which showed toxicity level that were at least twofold less than the chemotherapeutics currently used in cancer therapy. These compounds are quite promising for use in the new development of cancer drugs.
- Help with the treatment in the clinic. Several types of treatment modalities can be used in cancer therapy such as chemotherapy or by surgical removal of the tumor. Selection of the therapy is limited to a broad scale of factors, including the patient’s age and the characteristics of the tumor. Using patients’ tumor cells to do in vitro tests with different chemotherapeutic agents to evaluate the sensitivity is quite helpful to clinical treatment. Some research done in this area has shown that this approach is feasible. For example, Job Komen et al. (Komen et al., 2008) tested the viability and apoptosis induction of the breast cancer cells in vitro to determine the effect of cytostatic drugs.
In vitro tests has a number of critical limitations. Typically, that is due to the differences in the internal conditions of the living organism making the result differ from the result in vivo. The effectiveness of the concentrations received from in vitro tests might not be practical useful in clinical applications. That is due to the cells in vitro not capable of performing some of the functions performed in vivo and no longer influenced by the systemic regulatory mechanism (DIPAOLO, 1965). The concentration of drug is insufficient when used in living organisms. Research to develop a physiologically and more reliable in vitro model is apparently necessary.
Monolayer cancer model and three-dimensional cancer model
On the other hand, cell-based assays have become the main methods involved in different stages of anti-tumor drug tests. Monolayer culture are based on multi-dose drug tests followed by cytotoxic assay, the most accepted and widely used approach in early drug tests. However, significant discrepancies observed when evaluating drugs in vivo could be due to the 3D structure of the tumor. A 2D monolayer culture could not appropriately symbolize complete situations in vivo tumors, thus, an in vitro tumor model that could represent the 3D structure is required in the research and discovery of drugs.
Limitation of monolayer culture
Previously, monolayer culture was the most popular in vitro model for cancer research and formed the basis for much of our knowledge on the molecular biology of cancer (Yamada, & Cukierman, 2007b). The 2D monolayer culture model has its own merits in that many cell lines adhere to the flat surface, proliferate, and have high cell viabilities during the culturing period. It is convenient to set up the experiment since it is easy to get a large number of cells by simply sub culturing the cells. In this case, it is not a problem to get enough cell samples to run a parallel test. Due to these advantages, the monolayer culture is still the major approach used in many studies. However, more and more evidences have suggested that cells grown on the flat substrates differ in many biological characteristics from those grown in more representative 3D tissue microenvironments. Monolayer culture has limitations to accurately reflect the in vivo tumor response, which means the drug response results are acquired from 2D culture and might not simulate physiological conditions which are shown to be inadequate and unreliable (Horning et al., 2008).
First, monolayer models are substantially different from the in vivo solid tumor in that they lack the required structural architecture. Besides their differences in the morphological architecture, it has been reported that some cell lines might have lost their characteristics and different gene expression during the culture periods on monolayer substrates(Birgersdotter et al., 2005). Further, the epithelial cells might have the characteristics that only tumor cells display. It has also been shown that the growth of cell lines on monolayers is faster than normal and susceptibly loses their original behaviors. In addition, the 2D models cannot simulate the interactions between tumor cells and ECM, which are crucial in tumor biology and development of drug resistance (Cukierman et al., 2002). Finally yet importantly, studies based on monolayer culture cannot stratify cancer cells according to their potential for invasion or evaluate the anticancer drug efficacy with regard to cancer cell invasion and metastasis (Doillon et al., 2004).
Therefore, the multicellular 3D tumor model was developed to overcome these problems. Compared to conventional monolayer cultures, 3D cultures can restore physiological and morphological features similar to the corresponding solid tumor in vivo. The 3D model is much more reliable regarding the response to chemotherapy agents.
Advantage of 3D culture
After being first utilized in biomedical, research in the early decades of the twentieth century show that the three-dimensional culture technique are well accepted in these years since they span the gap between the monolayer and real animal tests. It provides deeper insight into the mechanisms and expression of the cancer malignancy. The primary advantages of 3D cultures are based on their structure. Besides these, 3D cultures also have other advantages and the potential of being a better model with the following features:
Heterogeneous tumor model
The tumor inside the human body grows in an environment, which has a non-uniform distribution of nutrients and required chemicals. Therefore, different regions inside the tumor have a variety of cell activities resulting in significant cellular heterogeneity. Due to the limitation of mass transportation, cells in 3D culture have different phenotypes as in solid tumors. We could find cells by proliferating, non-proliferating, and necrotic phases in spheroids formed in 3D models. Compared to the homogenous cells in 2D culture, a 3D tumor model are significantly realistic.
Support co-cultivation
A tumor is comprised of two distinct compartments:
- The parenchyma and
- The stroma
In many tumors, the basal lamina (also called the basement membrane) separates the tumor cells from stroma. Tumor stroma is formed from the elements that are derived from the circulating blood and from adjacent tissues. Research has shown that almost all elements found in normal connective tissues, such as blood vessels, plasma protein, proteoglycans, interstitial collagens, fibrin, fibronectin, connective tissue cells, and inflammatory cells, may exist in stroma (Sugiura et al., 2008a).The main functions of stroma are to support nutrition and the removal of wastes. Tumor proliferation is highly related to the amount of stroma. If stroma cannot supply enough nutrition during the growth of a tumor, Neoplasm necrosis may possibly occur. Stroma also affects the invasion of tumors invasion in that stroma element could induce the tumor to spread and become invasive. Since the stroma regulates the tumorigenesis and interchange of cells or fluids, a tumor model without the stroma may not truly reflect the response of the effects of drugs, effect, especially for some types of tumor, such as breast cancer. These types of tumors have a more than 80% of tumor mass which is stroma (Mendez Ribas). Therefore, in this case, co-culture of malignant cells and other cell types found in stroma form a more complex solid tumor, which has significance for the research in tumor biology and drug tests.
3D cultures are suitable for culturing multiple cell types that support co-culture tumor cell lines with epithelial cells or fibroblastic. This could provide us a more realistic tool to elicit an in vivo like response to anticancer reagent. In fact, it has been shown that cells in 3D culture have a similar drug sensitivity trend as malignant cells in vivo. Horning et al. have proved that compared to 2D culture, the anti-proliferation effect of drugs in a 3D model was 12- to 23-fold different as regards the half-maximal inhibitory concentration (IC50) value (Horning et al., 2008).
Cell shape and environments provided
The cell shape in 3D and monolayer culture are apparently different in that the growth of the cells on a monolayer lose their epithelial and fibroblast shapes(Yamada and Cukierman, 2007a). More importantly, the differences in the shape of the cells affect signaling of the cells or gene expressions. A 3D model also provides a physiological tumor environment instead of the biomaterials used as scaffold to mimic the extracellular matrix (ECM). Therefore, three-dimensional models provide a better platform for studying cell-cell signaling and cell-matrix interactions.
Three-dimensional models
In order to obtain accurate drug test results, 3D cancer cell models were the main approaches used to represent the structure and character of tumor tissue in vitro. Traditionally, spheroid formed on agar-coated culture surface in spinner flask was the most popular and widely used technique to produce 3D in vitro cancer models. More recently, scaffold-based cultures, micro-carrier beads, and engineered perfusion bioreactors have been developed, increasing the range of tissue engineering methods. In addition to that, they provide great support in the development of studies on the toxicity of drugs.
Spontaneous cell aggregation
Some cell lines can spontaneously aggregate when cultured in a suspension to form 3D spheroids. Derivative of these cell lines are from metastases and spheroids that are formed from cell lines that are similar to vascular tumor nodules. Cells in this models have three different phases just like in vivo tissue: proliferating, quiescent and necrotic (Sutherland, 1988). This model is not only structural but also functional from the monolayer culture. Nevertheless, this is only limited to a few specific cell lines. Normally, cells cannot get together spontaneously but need to avoid adhere to substrate and forced to growth together. Thus, this model is only realizable for special cell lines.
Spheroid
Spheroids are 3D cell aggregations that can mimic the structural characteristics of micro tumors. Historically, the use of spheroids as an invitro model began many years ago. Aggregates of embryonic cells were first developed and it was only later when these tumor developments were utilized. In accordance with the type of cell type and growth conditions, the sizes of cellular aggregates could vary from 20nm up to 1mm as the maximum diameter (Burdett et al.1984 ). In order to obtain the cell aggregations, cells must have the ability to adhere to each other, which means they must not grow on surface of substrates. For some cell lines with spontaneous cell aggregation abilities, the cell aggregation can be easily form when cultured in a suspension. Considering most of the cell lines are difficult to aggregate, spheroid formations need to be induced by inhibiting contact with the substrates.
To achieve this objective, the simplest way is to coat a given surface with specific hydrophobic biomaterials to avoid cell adhesion. In this case, cells are induced to grow together as 3D aggregates. The cells will first grow together and then attain a larger size by proliferation. The most widely used material is agar. Other substrates, such as agarose gel and matrigel, can also be used to prevent adherence by using the same principle of inhibiting meaningful contact with the surface of the container used for culturing (Kim, 2005).
Besides culturing cells over the coated surface, the spinner flask is another widely used method in the study. Due to the movement of fluids, the spinner flask can avoid the cells exposure to the substrate surface, thus improving the spheroid’s nutrient penetration. Finally yet importantly, the impact property increases, and either reduces the duration of cell aggregation or produces a greater number of spheroids. Other approaches such as roller tubes and gyratory shakers use similar principles. However, most of them cannot control the number of cells per spheroid. To improve the distribution, a hanging-drop method is successfully used on a broad range of cell lines. Compared with the growth on non-adherent surfaces, the coefficient of variation for HepG2 spheroids sizes reduces from 40–60% to 10–15%, but attain a round shape when using the hanging-drop method (Kelm et al., 2003).
Spheroids have a distinct advantage in tumor research with a characteristic layer-like structure defined by a necrotic core, an inner layer of quiescent cells, and a layer of proliferating cells resembling a typical tumor structure (Ferreira et al., 2003).This structure is formed by laminating the transportation of nutrients. Such spheroid made structures are more reliable in the research of chemotherapy reagent tests. However, spheroids that are formed from liquid either overlay cultures or in spinner flask are not enraptured in the biomaterial. That means this model cannot mimic the environment with extracellular matrix (ECM) which surround a cell. ECM plays an important role in regulating cells and structure of tissues and their functions. As cell-ECM interaction is an important approach to affect cell behavior through receptor-mediated signaling (Rosso et al., 2004), spheroids formed in this environment may lost some cell functions or unregulated cell proliferation or phenotype (Taipale et al., 1998).
Micro carrier
The biotechnology offers different demands with different purpose. These include the low cost and large production amounts. The most significant advantage of using micro carrier for cell culture is providing large scale cell culture which is match the demands of commercial manufacturer. By using micro-carriers, amount up to 200 million cells per militer are possible. Micro-carrier beads can produce large amounts of cells due to the large surface area they provided, which could be applied in producing, for example, viruses for vaccines (Clark and Hirtenstein, 1981).The smaller size of micro-carrier beads, the larger surface in settled bed volume can be provided for cells. Besides this, due to the easy control of culture parameters, for instance PH and nutrient, micro-carriers can provide a homogenous culture condition which give cells high viability even though the cell production is huge.
The applications of micro carriers are diverse and are currently available in different sizes, coatings, and materials for various applications. The adhesion of cells onto the surface is fundamental to micro-carrier culture. Although the material have been used to produce a variety of macro carriers, such as plastics, polyesters, glass and dextran, beads are always coated by collagen and gelatin. In micro-carrier culture, cells grow on the surface of micro-carrier beads or grow inside the pores of macro-porous.
It is a convenient 3D model by using micro carriers that are easily set up by simply mixing cells with micro-carrier beads. The high cell concentrations with coated surfaces could induce cells to form small-sized spheroids on the surface of the micro-carrier beads or the through pores in the macro-porous. The beads with micro spheroids then adhere together forming bigger spheroids with micro carrier beads residing inside. Another way to perform 3D culture is to use micro porous carriers to grow the cells. Since the growth of cells on the surface of the beads relatively firm, it is possible to apply the model for perfusion culture where cells do not separate from beads. The high perfusion rate can not only ensure availability of a sufficient number nutrients, besides the ability to remove the toxicity of metabolites (Runstadler, 1989).This structure also provides an environment to grow cells inside the pores with sufficient protection.
Nonetheless, the growth of cells in macro porous carrier delays until the pores are fully covered by the cells. In this case, large carriers with small pores will restrict the diffusion of nutrients and oxygen, which will affect cell viability. On the other hand, it is difficult to harvest cells from micro carriers especially by harvesting spheroids from macro porous carriers. The large-scale cell culture makes this even more complex and difficult. Thus, the micro-carrier or macro-porous carrier models are good in producing large-scale cells or viruses. However, to produce micro tumor spheroids samples for drug tests, it shows limitations. For micro-carriers, cells attached to the surface of the beads are not round shape spheroids. Instead, the cells grow on the monolayer on the surface of the small spheres. On the other hand, though macro-porous carrier cells aggregate inside the pores, it is difficult to control the size of spheroids when they are released from the carriers. The spheroids samples used for drug tests need to be controlled in a similar condition within a limited size range, since they are difficult to achieve using this model.
Scaffold-Based 3D Culture
Collagen
Collagen is the most popular material used in tissue engineering especially for the culture of chondrocytes. When the mixture of cell suspension and collagen gel in culture plate is seeded, cell aggregations form after several days in a 3D culture. Some researchers believe the aggregation is the similar to spheroids, but cells in collagen can better reflect the cell behaviors by contact with cells and extracellular matrix (Burdett et al., 2010). Collagen can mimic the loose or dense connective tissue surrounding cells, depending on the collagen concentration. The collagen tumor model can help in understanding the interaction between cells and extracellular matrix (ECM) and the different cell responds to various stiffness of the ECM. Spheroids formed from collagen scaffold have been used for anti-cancer drug tests and have shown significantly higher drug resistance to drugs with comparison on a monolayer culture.
However, the collagen has its own limitations as well. Firstly, the collagen is like to losing water after long-term culture, which will destroy the 3D scaffold structure. Thus, this is not suitable for long time cell culture. Secondly, the cells cultures in collagen cannot be released which limited the utilization of collagen in some areas of study. For toxicity of the drugs assay, the standard deviations are close to the homogenous of samples. If micro-tumors cultured from collagen scaffolds cannot released, the selection of samples become impossible. Thus, it is hard to control the difference between each micro-tumors used as samples for toxicity of the drugs tests.
Alginate
Another commonly used biomaterial is the alginate. Alginate is a family of polyanionic copolymers derived from brown sea algae (Li and Zhang, 2005). Owing to its biocompatible and low-toxic characters, Alginate is widely used for wound dressing, immobilization matrix, in drug delivery, and in tissue engineering.
As alginate can be a simple gelation with divalent cations such as Ca2+, Mg2+, Ba2+, and Sr2+, making alginate scaffold for 3D cell culture become easy. Cells are enraptured in alginate by dropping Alginate-cell suspension mixture into isotonic Cacl2 cross-linking solution, forming alginate beads (Figure 2.3). This is a convenience 3D culture model that just putting formed beads in well plate and add culture medium. Cells will get together and form spheroids inside the beads. Used alginate concentration is various from 0.8% to 2.2%.The alginate beads made by 1.2% alginate, can keep culturing 7 days and then structure will get looser. The higher alginate concentration used, the longer beads can maintain the shape. But this is not the only parameter, since the pore size of beads, spheroids size and distribution are correlative with alginate concentration, the experiment design need to take all the concerns into account.
Alginates are well accepted due to its simplicity of use, and the hydrogel character makes it a good artificial extracellular matrix material. The interaction between cancer cells and beads can mimic situations inside human body as if those cells interact with sticky surrounding materials. Beside this, Job et al. found that chondrocytes cultured in alginate could produce matrix and steadily increased through the culture period(van Susante et al., 1995). It has been proved that matrix can regular the secretion of proteins called angiogenic factors. These proteins allow tumors to develop blood-vessel networks and eventually metastasize, or spread to other parts of the body. Claudia Fischbach et al. has proved that the anti-capability is regulated by 3D culture using Alginate as 3D scaffold material (Fischbach et al., 2009). If alginate is employed to drug tests research, drug penetration through alginate can mimic the procedure that drug go through the stroma to reach the tumor cells.
High porosity of alginate allows high diffusion rate of nutrient which cells need for growth (Smidsrød and Skjåk-Braek, 1990).This character can provide researcher spheroids with higher cell viability. On the other side, the pore may cause leaking of the cells during culture process. As the pore size can be adjusted by using different alginate concentration, the concentration of alginate will be designed before utilized on different cell type or organs. Compared to the traditional spheroids formed on the agar-coated surface, the spheroids formed inside the alginate beads are smaller but with better distributions. This may cause by the moving resistance because of gel’s viscidity. The restriction of moving distance can only allow cells aggregate within a region that result in fewer cells in one spheroid but greater numbers of spheroids with similar size. On the other hand, spheroids produced from agar surface are small numbers and bigger size, which is more suitable for individual monitoring research (Kim, 2005).
Besides this, Alginate has many other advantages relevant to its unique bio-character which make this material a widely range application. Vary types of cell lines have been successfully cultured in alginate gel. Alginate is a reliable material for tissue engineering and making great effort on tumor biology.
Perfusion culture model
Some researchers have mentioned that the current 3D tumor model do not have the transport function such as blood vessel system in solid tumor.A 3D perfusion culture can help the spheroids cultured in 3D models maintain cell viability to grow bigger in size. Considering the nutrient, and oxygen diffusion limitation, the thickness of spheroids can only attain a value of 100μm in static culture (Shvartsman et al., 2009).
Perfusion cell culture is known to provide a steady and stable culture environment due to the continuous supply of nutrients and removal of wastes. Perfusion culture is more physiological as it mimics the environment inside the human body. The cell physiology is significantly influenced by even tiny changes in the culture environment. Hence, it is very important to provide a stable environment to test the drugs, and the concentration of the drug that is made constant in perfusion culture as well.
In static cell culture, the culture medium is supplied in batches, and is manually replaced by fresh medium at regular intervals. If the culture lasts for a long time, the culture conditions change with time and cells become starved of nutrients with time, requiring the nutrients to be replaced several times in the process. This will result in a fluctuating and unsteady culture (Zhao and Ma, 2005). However, for the drug test experiments, the drug is added when cells are seeded on a culture plate. On the other hand, when the drug is removed, it will be spent in the spend medium time when changing the culture medium, which means that the drug should be added every time the culture medium is changed. This is a waste of drug and might be a source of errors on the results. A stable culture environment is important because even minor changes in extracellular conditions may greatly influence the cell physiology (Wu et al., 2006a). On the other hand, it poses contamination risk when changing medium time after time.
Perfusion culture can avoid the problem mentioned above. Perfusion culture continuously supplies culture medium along with the drug been tested, which means it does not need change of either growth medium or drug, and can reduce side effects from contamination risk. In Conclusion, it is generally believed that perfusion cultures are capable of not only capable of keeping the culture system sterile during the entire culture period but also capable of providing a culture system for continuous nutrient supply and waste removal in order to keep the culture environment more stable.
Three-Dimensional cell culture systems are proving essential for promoting the functional behavior of mammalian cells and immortalized cell lines in vitro (Dvir-Ginzberg et al., 2003).But in vitro static 3D culture model lack the ability to perfuse tissues like in vivo and cells at different depths can be in different nutritional states(Keith and Simon, 2007). Thus, the perfusion technique was introduced in 3D culture and plays a critical role during cell seeding into scaffold and whole culture process.
For most scaffolds, the static cell-seeding method without fluid flow is usually inefficient, and cell distributions are different from the top to the bottom of the upper region of the scaffold which is largely confined (Dar et al., 2002). The perfusion bioreactor was employed to avoid this problem. Thus, it provides an interstitial fluid flow to enhance cell distribution in the scaffold matrix, leading to high cell-density 3D cultures. According to reports, seeding efficiency values between 42% and 84%, depending on the type of cell, flow rate, and the pore size of the scaffolds (Kim et al., 2000)(Wendt et al., 2003).
In the present paper, perfusion technique was used together with 3D culture, which is quite popular with some bioreactor fabricated with these two functions to mimic a human environment for credible cell-based assay results. A pressure-driven perfusion culture micro chamber array was developed for parallel drug cytotoxicity assay (Sugiura et al., 2008b). Their system allowed the delivery of differently conditioned media from macroscopic medium-stock chambers into the cell culture micro-chambers by utilizing single pressure sources. However, utilization of a small amount of perfusion system was shown to be necessary when conducting tumor culture and anti-cancer drug tests.
In this thesis, a 3D perfusion culture model was developed for breast and colon cancer cell culture and relevant drug tests conducted. The tests used a combination of the advantages of 3D culture and perfused culture models, systems believed to provide a steady environment for the growth of cells and an environment rich in solid tumors with characteristics that are prevalent in vivo tissues. It also was a further evaluation of the accuracy with which cells respond to drugs.
Drug efficacy and cytotoxicity assay
The first case of utilizing cell culture system to evaluate toxicity of anticancer drugs was observations of antineoplastic effect of nitrogen mustard in 1943. After that, there is a wide variety of assays designed to evaluate the effectiveness of drugs on cells. These assays are classed as two groups: assays for cell survival and assays for cytotoxicity. The main approach currently existing for cytotoxicity assays include Trypan blue dye exclusion, 51Cr release, MTT reduction assay, Alarmar blue and flow cytometer. Cytotoxicity is the property of being toxic to cells, which access the structural integrity and metabolic functions after the drug based treatment.
The integrity in the measurements of cell membranes is one of the most common way to measure viability of cells and cytotoxic effects. There are many dyes used to determine the integrity of cells, for instance neutral red, trypan blue dyes and fluorescent compounds. If cells are still alive, their cell membranes are intact and inaccessible. Agents that are toxic to cells often damage cell membrane and broke membrane integrity which let vital dyes freely cross the membrane and stain intracellular components(Riss and Moravec, 2004).
Another cytotoxicity assay, MTT or MTS assay is a quick assay that allows a large number of assays to be measured in a single batch. Owing to this advantage, MTT assay is widely used in new drug developments. The first case that uses MTT assay to measure the number of cells was first reported in 1980s. MTT (3-(4,5-Dimethylthiazol-2-yl)-2,5-diphenyltetrazolium bromide, a tetrazole) is a yellow water-soluble tetrazolium dye which is reduced by live cells to purple formazan product and is insoluble in aqueous solutions. The amount of MTT-formazan produced can be determined using an automated spectrophotometric micro plate reader when dissolved in a suitable solvent.
Similar characteristics define the MTT assay, Alamar Blue assay is also a measure of the viability of cells with 96 well plates. However, MTT is toxic to cells and is an endpoint assay when Alamar blue leaves the cells after the measurements are taken. The oxidized form of Alamar Blue is a dark blue color with little fluorescence and the color turning the color to red when added to live cells. Viable cells reduce Alamar blue which reduces the resulting form is strongly fluorescent. The optical density or fluorescence, which is a reflection of cell viability, is monitored using a spectrophotometric plate reader. There are several significant advantages to the Alamar Blue assay. The indicator can directly add cells and have non-toxic to cells implying that the cells can continue culturing without washing them off. Alamar Blue assay does not require any special handling or disposal methods since no radioactive or toxic materials are used.
Flow cytometer is a powerful assay, which can measure several parameters such as the cell cycle, the cell viability, among other parameters. In flow cytometer, cells are prepared and stained according different needs. Cells in liquid stream are mobilized into a single-line to intersect a laser beam through hydrodynamic focusing. As cells pass the laser beams, scattering properties and fluorescence emission are monitored and recorded for analysis. If cells are prepared with live-dead dye, the flow cytometer can provide the number of dead cells and viable cells. As the flow cytometer can measure cell cycle, cells treated with drugs that inhibit cell proliferation measurements. In addition, Flow cytometer can tell which phase of cell cycle the cells are inhibited.
Cytotoxicity assay is the most important tool used in test studies of the toxic effects of drugs and makes a significant contribution in the effort to discover and develop anti-cancer drugs. However, there is no perfect assay technique fitting perfectly into the cell lines situations and meets stringent experimental requirements. To get the accurate outcomes, the cytotoxicity assay is recommended to run at least two assays which are correlation on the principle underlying the assay.
Summary
This chapter gives a brief review on the history of chemotherapy and drug development, and summarizes existing in vitro models for toxicity of the drugs assay. Traditional monolayer culture technique failed to recreate the actual environment of tumors. Relatively, three-dimensional system is an advanced tests platform that can mimic the tumor 3D feature and provide more physiological tumor microenvironment. Therefore, 3D cancer model is believed as a more reliable model for drug tests. However, the static culture lack the ability to perfuse tissues like in vivo and cells at different depths can be in different nutritional states. To better support drug development research, there is a distinct demand of develop an in vivo like, more physiological in vitro models. The aim of this research is attempt to build up a complex 3D perfusion tumor model, which have the functions similar to in vivo tissue for drug tests and investigating basic mechanism of tumor genesis.
Anti-cancer Drug Tests With Monolayer Cell Culture
Introduction
As discussed in the last chapter, chemotherapy plays an important role in cancer combination therapy. There is the belief that all types of cancer could be treated if patients could undergo treatment with a correct combination of the right agents and right doses. In this case, the pretest work for cancer drug research is extraordinary important.
The main aim of tests the efficacy of cancer drugs is to identify potential candidate drugs for the development of the new agents, and pretest toxicity effects of drugs before applying the drugs for clinical treatment. For the discovery of drugs, a number of compounds identified with toxic effects on cancer cells are removed to save money and resources. Before candidate drugs are made available for clinical use, their toxic effects need to be tested each time, and a safe range of drug doses and drug action mechanism established. In addition, these works are mostly studied on monolayer cells culture and drug tests carried in the laboratory. The results are combined from cytotoxicity tests with animal tests. On the other hand, drug-test data are used as the basis to approve clinical trials of candidate drugs. With the development and discovery of drugs, there are new compounds found toxic to cancer cells and considered as a new choice of cancer drugs. Drug tests are especially important for the new compounds that do not experience any clinical trials. Thus, researchers need to study the correct dose with optimal treatment effects and minimum side effects.
That provides reliable data for drug tests and is very important for the research in cancer. Research has established that traditional in vitro drug tests approach is based on monolayer cell culture. On the other hand, standard drug assay determines the ability to inhibit the growth of cells by inducing cell apoptosis (Bernhardt et al., 1992). As the first step in tests of drugs in the study, the basic toxicity of two commercial drugs, DLD1, and NCI/ADR cell lines were tested on monolayers. In this chapter, the drug dose used for further drug studies included the cytotoxicity measurements approach. The work in this chapter is a study grounded on further 3D drug tests.
Materials and Methods
Chemicals and Reagents
The chemicals used included RPMI-1640 Medium with 20mM HEPES, 1X Trypsin-EDTA, antibiotic/antimycotic solution, Trypan blue, MTT,Paclitaxel and Cisplatin purchased from Sigma-Aldrich Company Ltd (Dorsett, UK), fetal bovine serum (FBS) from M.B. Meldrum Ltd., (Bourne End, UK) and Alamar blue from Invitrogen Ltd (Paisley, UK), PDMS and cross-linking agent were purchased from Dow Corning Corporation (U.S.A). The gene reporter and transfection Reagent are from AMS Biotechnology (Europe), Ltd. Other consumptions used, such as culture flask and pipettes were purchased from VWR International Ltd (UK).
Cell lines employed in this work
- DLD1
DLD1 is human colorectal cancer cell line. DLD1 cells were shown in Fig.3.1(Plate A) - NCI/ADR
NCI/ADR is a human breast cancer cell line. NCI/ADR cells were shown in Fig.3.1 (Plate B).
Both cancer cell lines, NC1/ADR and DLD1, were kind gifts from Dr. Richard Callaghan (Nuffield Department of Clinical Laboratory Sciences, University of Oxford).
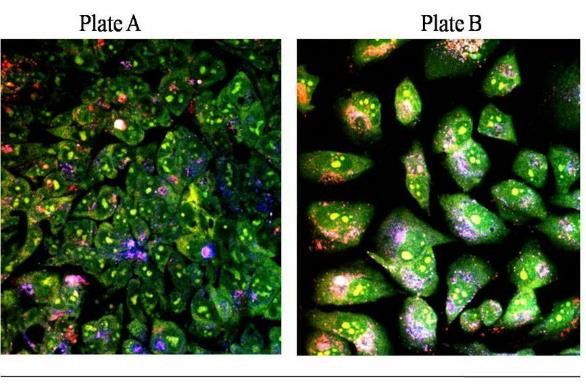
Plate A, DLD1 and Plate B, NCI/ADR consist of both cells stained with acridine orange and imaged with Oxford University’s multi-photon microscope.
Image courtesy of Centre for Tissue Engineering and Bioprocessing .University of Oxford
Anti-cancer drug employed in this work
Two commercial drugs were selected for the experiment.
Paclitaxel
Paclitaxel is a highly complex compound extracted from the Pacific yew tree Taxusbrevifolia with antineoplastic activity. Paclitaxel is a white powder and hard to dissolve in water. Thus, DMSO is usually used to dilute the drug to the right dose. It has a molecular weight of 853.93 and a molecular formula C47H51NO14(Figure 3.2). Paclitaxel was first found with the potential as an anti-cancer drug in 1960s by a screening program coordinated by the National Cancer Institute (NCI). After nearly 20 years study, Paclitaxel was introduced in clinical trials for its effectiveness as a drug with significant effects on different types of cancer. Safety tests were done in 1983 as sponsored by NCI. Until the 1994, paclitaxel proved its substantial antitumor activity against metastatic breast cancer. The toxicity of paclitaxel against breast cancer cell lines previous studies showed that the number of surviving cells fell sharply when exposed to paclitaxel (Liebmann et al., 1993). The cytotoxicity of paclitaxel observations on cancer cells in a 3D culture system showed different responses. Presently, paclitaxel has become a major chemotherapy agents used on a wide range of cancer diseases. However, it is commonly used in combination with cisplatin or carboplatin in the treatment of ovarian and breast cancer (Rowinsky and Donehower, 1995).
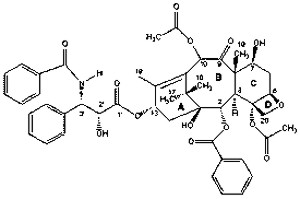
Paclitaxel is an antitubulin agent, which works by disturbing microtubule dynamics during the mitosis process. The mechanism of Paclitaxel’s action is that Paclitaxel inhibits the disassembly of microtubules by promoting the polymerization of tubulin, thereby resulting in the inhibition of chromosomes separated during cell division. In the process of mitosis, a large number of microtubules form which are normally de-polymerization to free tubulin at the end of cell division. However, Paclitaxel targets the quickly growing cancer cells, promoting microtubule assembly by stabilizing the microtubule complex and disturbing them from breaking down (Schiff and Horwitz, 1980). This is made of tumor cells, which are inhibited in G2 and M phase of cell cycle until the death of the cell. Paclitaxel also induces apoptosis by binding to and blocking the function of the apoptosis inhibitor protein Bcl-2 (B-cell Leukemia 2). Beside this, paclitaxel also acts as an immunomodulation to produce tumor necrosis factor TNF-αby active macrophages. The produce of TNF-αpromote the production of interleukin-1,IFN-α and IFN-β which leads to inhibition of the growth of cells or eventual cell death.
Cisplatin
Cisplatin is an inorganic platinum agent (cis-diamminedichloroplatinum) with antineoplastic activity and proven as the most potent antitumor agents known, displaying clinical activity against a wide variety of solid tumors (Fuertes et al., 2003).Cisplatin was originally prepared and reported in 1845 and was identified as an effective compound with the ability to block cell division. Eventually, Cisplatin was introduced in clinical practice in 1979 in UK. Initially, cisplatin was used as a single agent to treat patients infected with metastasis tumor and, subsequently, was used to non-refractory disease and conventional chemotherapy. Recently, cisplatin has been used in combination with chemotherapy with various regimens and some new agents (Martin, 2001).Cisplatin has been used to treat various types of cancers, including sarcomas, some carcinomas (e.g. lung cancer, and ovarian cancer), and lymphomasespecially metastatic germ cell cancers. Until now, Cisplatin was widely used for chemotherapy and still used today despite the new range of developed drugs.

Cisplatin has platinum complexes that produce intra-strand cross-links as the major groove of DNA that looks like kink, the DNA at the adduct sites. These cross-links cause cells undergo apoptosis. Cisplatin binds to DNA on one side and binds to a protein on the other side. When the DNA is damaged, the DNA repair system is made active. However, the bonded cisplatin protein prevents the removal through DNA repair, leading to the death of the cell. Breast cancer cells have been treated with cisplatin in 2D and 3D culture system (Doillon et al., 2004, Otto et al., 1996). Cells treated with cisplatin were found and arrested at phase G2 when induced to apoptosis. In addition to that, for the three dimensional culture, cell aggregates were decreased after treatments and tumor-like structures were either diminished or even absent when treated with higher concentrations of cisplatin.
Cell culture
Monolayer cell culture
For maintenance, cell lines were grown as monolayers on the surface of standard T-75cm2 tissue culture plates with RPMI-1640 Media (w/Sodium Bicarbonate, supplemented with 10% fetal calf sera and antibiotics). The flasks were incubated at 37°C in an incubator with a humidity of 5% CO2. As a part of the maintenance, the cells were sub-cultured twice a week. Sub culturing involved trypsin zing confluent monolayers to remove cells from the surfaces and disperses the monolayer as single cells. The cells were re-seeded at 25% confluency in new T-75cm2 tissue culture flasks with fresh culture medium and cultured as before. According to Paul Raju’s previous study, who worked on cancer cell research in our group, 25% confluent cell density gives cells the highest activity and proliferate rate. In this case, the monolayer culture used 25% confluence as cell seeding density. A confluent monolayer consists of 100% of the tissue culture surface area occupied by a monolayer. Twenty-five percent confluences were attained by growing cells to 100% confluence in standardized 6-well cultured plates. Cells were removed by trypsinizing them, and the total number of cells determined. The total number of cells was divided by the surface area occupied by cells in the 6-well plate (9.5 cm2) which gave the area required by a single cell (see Table 2.2). Based on this, the total number of cells that occupy 25% of the surface area equivalent to 24-well (1.9 cm2) and 96-well (0.32 cm2) were calculated.
Drug dose-response study
Before starting the drug tests study, drug dosages applied to the cells under examination were first determined. The IC50 of paclitaxel and cisplatin were examined by determining the response curves of the drugs. The drug dose response describes the changes and effects of different drug dose on cell lines. On the other hand, studying the dose-response can determine the potency of the IC50 drug dose and the hazardous dosage of the drug. A dose-response curve is a simple X-Y graph relating the magnitude of drug dosage to the response of the cell line and the % inhibition of the drug. The curve should be similar to the one shown in Figure 5.2, the dosage of the agents are on the X axis with the response plotted on the Y axis (Kearns, 2009). From the results, the first point which is slightly above zero, which is the threshold dose with the lowest effect. Increasing the dosage of the drug, the response becomes larger until an hazardous dosage level is attained. A study of the dosage response curve, the range of drug dosages, which allow the growth of cells in the log phase, is determined.
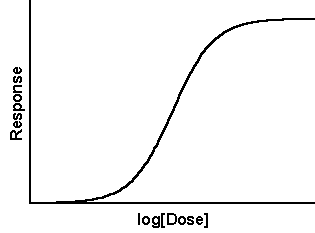
DLD1 and NCI/ADR cell lines were seeded at 25% confluency into each well of the 24 well culture plates, allowing for the adherence to the surface during the overnight period. Paclitaxel and Cisplatin were prepared with a1mg/ml stock solution in DMSO, and stored at – 80°C. Prior to the experiment, drugs were thawed then applied to each of the cells with the final concentrations in the micromole range. Both drugs, paclitaxel and cisplatin, were applied to cell lines of fifteen different drug doses and cells cultured without the drugs being used as control. After three days drug treatments, the resulting cells were analyzed by trypan blue assay.
Growth inhibition by agents
DLD1 and NCI/ADR cell lines are treated with both paclitaxel and cisplatin for growth inhibition studies. According to the drug dose responds study, three drug concentrations were selected and applied during the test study. Then, the cells were attached to the surface overnight while culture media was removed and 1mL fresh media (RPMI 1640 with Bicarbonate buffer/supplemented with FBS and antibiotics) with different drug concentrations added to each of the wells of the culture plates. Culture plates were incubated in a standard humidified incubator at 37°C. In order to study the growth of cells and cell viability during the culturing period, the drug under consideration was exposed for a period of 7 days with samples taken for each toxicity of the drugs assay every day.
Cytotoxicity assay
Cytotoxicity assessment with trypan blue exclusion method
The trypan blue exclusion assay is a routinely employed method for discriminating live cells from dead ones (Kim et al., 2009). The assay is based on the premise that live cells exclude the dye because they have a functioning cell membrane whereas dead cells permit the dye to enter because of a dysfunctional membrane ─ a typical characteristic of dead cells is a dysfunctional membrane. As a result dead cells accumulate the dye and appear blue (the dye itself is blue colored) when observed under a standard microscope while live cells appear transparent.
Cell toxicity of a given experiments were carried out by first removing the monolayers from the bioreactor/tissue plate surface and dispersing them into single cells by trypsinization with repeated pipetting. To wash the cells, fresh medium (500μl) was added to the trypsinized cells (in a 1.5 ml eppendorf vial) and centrifuged for 5 min at 500 X g. Cells were then re-suspended in 100μl medium, mixed with trypan blue at a ratio of 1:1, loaded into a hemocytometer and counted for live and dead cells. A minimum of 100 cells were counted. Based on the cell percentage of counts, inhibitions were calculated using equation 3.1.
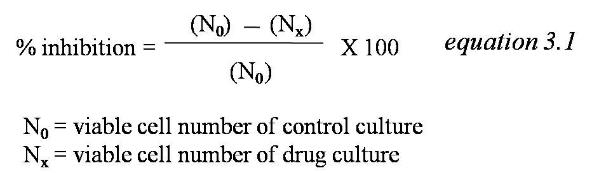
Cytotoxicity assessment with alamar blue assay
Alamar Blue assay is a technique for measuring the number of cells and their viability. The major advantage of the assay technique is that Alamar Blue is nontoxic to most cell lines, which allows alarmar blue to leave the cells after the measurements are taken (Nakayama et al., 1997). Due to this characteristic, alamar blue is used for monitoring the growth of cells and their toxicity response with time. On the other hand, a large number with similar cell viability assays are toxic to cells and significantly kill the cells after measurements are taken making alamar blue superior to other tests (Al-Nasiry et al., 2007). On the other hand, scientific studies show that alamar blue is toxic to some cell lines including ovarian cancer cell line (C.Squatrito, 1995). In Robert’s study, alamar blue shows significantly toxicity levels with prolonged exposure. In addition to that, Robert mentioned that the number of cells decreases significantly to less than 20% of the control after 72 hr. exposure to alamar blue. If alamar blue is toxic to cell lines, then the monitoring of the growth of cells in a span of several days is no longer accurate. In this case, the toxicity of alarmar blue has been tested with DLD1 and NCI/ADR by first utilizing this assay in the toxicity study.
The general techniques for measuring cytotoxicity using alamar blue are simply in three steps. First, harvest the cells and prepare them to the density around 1×10⁴cells/mL, and treat reagents with the agents identified in the research. When the samples are ready, alamar blue is added with a 10% y volume of the reagents of the volume in the well. Depending on the types of vary cells, samples are incubated with Alamar blue for 4- 8 hours before measuring them using spectrophotometry or fluorescence.
DLD1 and NCI/ADR cells are seeding in 24 well plate with a cell density of 10 x104 and 5×10⁴ respectively. They are attached to the surface for 24 hours. According to the alamar blue assay technique, alamar blue was added at an interval of 5%, 10% and 15% by volume in the well and cultured for 6 days. During this time, cell viability tests were done on a daily basis with exposures to alamar blue dye within that period. The cytotoxicity of alamar blue to DLD1 and NCI/ADR was measured using the Trypan blue exclusion technique.
Cytotoxicity assessment with MTTassay
MTT standard curve on monolayer
Cells whose densities varied between 4×10⁴ cells/ml to 4×10⁵cells/ml were harvested and prepared by placing them in 96 well plates attached to the surface and cultured for one day. At the end of incubation, the cells were removed from the culture medium and changes for 200µL fresh medium and 50µL MTT solution (5mg/mL in PBS) recorded. Aluminum foils wrapped plates were incubated for four hrs. After which the medium was changed to accommodate the 200µL DMSO in order to dissolve the MTT-formazan crystal. The plates showed a 570nm reading on the spectrophotometry plate reader. In this way, a standard curve plotted for absorbance against the number of cells was determined.
MTT assay for drug responds test
Cell lines were cultured in 24 well plate and expose to drugs for the test study. After the drugs were exposed, the cells were washed twice using the PBS and changed for the fresh medium for a single day’s additional culture. MTT were added in a similar way with standard curve study mentioned above. As the culture plate used are 24 well plate, the volume of culture medium (1mL), MTT solution (200µL) and DMSO(1mL) were 4 times of the volume used for 96 well plate. Three wells were used for each drug concentration to give triplicate readings in a single experiment.
Results and Discussions
Dose-responsecurve
Both DLD1 and NCI/ADR were exposed to Paclitaxel for drug responds study. For paclitaxel, fifteen drug doses, 0.05µg/mL, 0.1µg/mL, 0.3µg/mL, 0.4µg/mL,0.5µg/mL,0.8µg/mL,1µg/mL,1.5µg/mL,2µg/mL,3µg/mL,5µg/mL,8µg/mL,10µg/mL,15µg/mL, were applied to cells for three days. From the below graphs, the IC50 of paclitaxel for DLD1 and NCI/ADR are 3.996µg/mL and 4.860µg/mL. Considering the convenience of preparing the experimental work, three doses were chosen for paclitaxel are 0.5µg/mL,5µg/mL, and 10µg/mL.
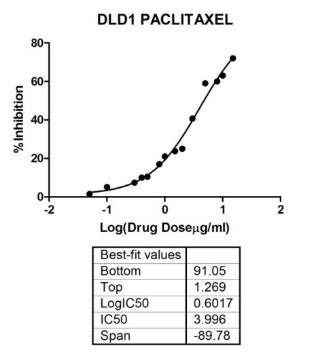
The dose of 5µg/mL is nearly the IC50of paclitaxel for both cell lines, 0.5µg/mL and is smaller causing a 10% inhibition while the 10µg/mL is a higher dose able to kill 80% of the cells. According to clinical data trials from Tianjin medical university cancer institute and hospital, the dosage of drugs used for clinical treatments was between 10µg/mL to 15µg/mL depending on different stages of the patients. Thus, 10µg/mL was chosen for further drug tests on paclitaxel.
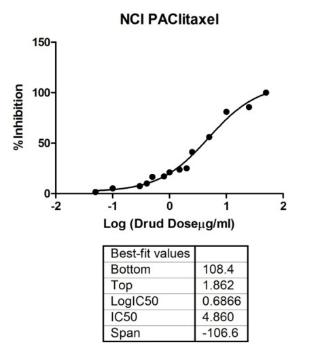
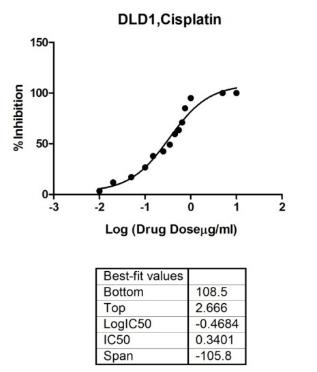
For Cisplatin, 15 drug doses, 0.01µg/mL,0.02µg/mL, 0.05µg/mL, 0.1µg/mL, 0.15µg/mL,0.25µg/mL,0.35µg/mL,0.45µg/mL,1µg/mL,0.55µg/mL,0.65µg/mL,0.75µg/mL,1µg/mL,5µg/mL,10µg/mL, were applied to cells for three days. From the above graphs, the IC50 of cisplatin for DLD1 and NCI/ADR are 0.3401µg/mL and 0.4536µg/mL. Considering the convenience of experiment preparing work, three doses chosen for cisplatin are 0.05µg/mL,0.5µg/mL, and 1µg/mL.
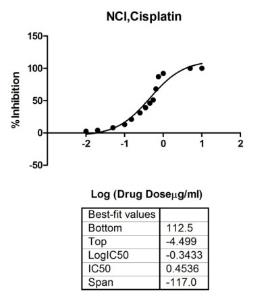
The dose 0.5µg/mL is close to the IC50of cisplatin for both cell lines, 0.05µg/mL is a smaller dose that causes 10%~20 percentage inhibition. The entire populations of cells were shown to die when exposed to cisplatin of 1µg/mL for three days, thus 1µg/mL is chosen as the hazardous dose of cisplatin. According to data on clinical trials from Tianjin medical university cancer institute and hospital, the dosage of drugs used for clinical treatments of cisplatin is 0.03µg/mL to 1.5µg/mL depends on different stage and patients. These three doses,0.05µg/mL,0.5µg/mL, and 1µg/mL, are all include in this clinical range of doses used in the study.
Toxicity of Alamar Blue
Initial experiment is about the growth of cells curves in the presence of Alarmar blue dye. According to alamar blue‘s instruction, DLD1 cells are cultured in 24 well plates with a cell density of 4 x10⁴ cells/mL. Moreover, 10% by volume of alamar blue was added into the well and cultured for 72 hr. The number of cells was then measured using both the Trypan blue assay and the Alamar blue assay. However, results from the data shown in following table show that the number of cells cultured with alamar blue decreased to 20% of the cells cultured without alamar blue ( control) after 72 hr. The manufacturer’s instructions recommended exposure to alamar blue for 4~8hr before test and even after an 8 hrs. Culture with AB, shows the number of cells having dropped by 2%.
Table 3.2 Number of cells assay when cells growth with alamar blue.
In order to confirm the cytotoxicity of alamar blue to cells, both DLD1 and NCI/ADR were cultured in 24-well plate with cell density of 10 x104 and 5×10⁴respectively. That was after a one-day culture to allow, cells attached to the surface of culture plates. During the study, Alamar blue additions of 5%, 10%, and 15% respectively by volume were cultured for 6 days during the study.
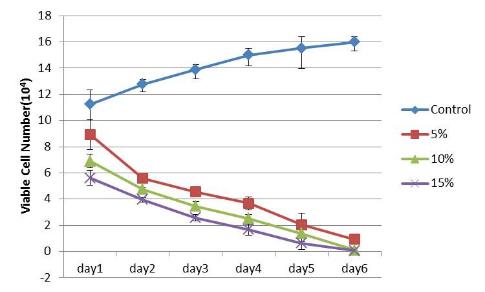
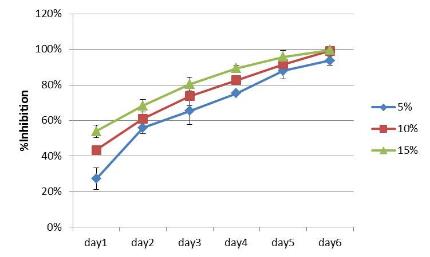
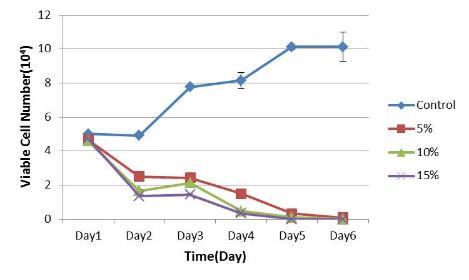
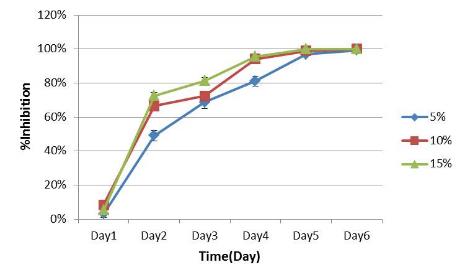
From the figure 3.7 and 3.8, alamar blue shows cytotoxic effects to both DLD1 and NCI/ADR cell lines. Cells cultured without alamar blue were grown in the wells with the number of cells kept constant or significantly reduced to low values when alamar blue was present in the culture. The inhibition of growth was registered after 24 hrs with alamar blue culture getting significantly worse until all the cells died after 6 days. This proved the significance of the cytotoxicity of alamar blue making the assay not suitable for these two cell lines.
Table 3.3 Concentration effects of Alamar blue on the growth of cells.
In addition to that, the cells cultured with different doses of alamar blue give a dose-dependent cytotoxicity values (Table 3.2). The most used concentration is 10% of alamar blue, but even with lower concentrations (5%), the growths of the cells showed significant inhibition for both cell lines shown above with half the number of cells inhibited. Due to this reason, utilizing alamar blue assay to study the toxicity drugs on DLD1 and NCI/ADR cell lines is inaccurate. Typically, alamar blue will affect the results with the death of cells occurring because of not only the agents but also the alamar blue, with the possibility of magnifying the effectiveness of the anti-cancer drug.
Growth inhibition of cancer cells by anti-cancer agents
Before applying the above mentioned agents to the different culture models, the cytotoxic activity of paclitaxel and cisplatin against cancer cell lines were assessed. DLD1 and NCI/ADR cell lines were cultured in 24 well plates whose cell densities were 3× 10⁵and 0.9× 10⁵ respectively. A 25% confluence on the 24 well plates was used in the study. The agents were used on the cells after a one-day pre culture, allowing cells to be attached to the surface of the plates. The drugs were diluted to three concentrations using the RPMI medium by exposing the cells on day 0. During the 8 days drug treatments, cells were daily trypsinized and viable cells were counted using trypan blue and MTT assay. For each specific group, the mean ± SD of the data was determined at least for the three separate experiments.
Cisplatin inhibition study on DLD1 and NCI/ADR cell lines
A cisplatin stock solution (1mg/ml) was made by DMSO and diluted to three concentrations, 1μg/mL; 0.5μg/mL; 0.05μg/mL, using a RPMI culture medium for the inhibition study. The growth curve and growth inhibition against the drugs were observed on DLD1 (Fig.4.5; 4.7) and NCI/ADR (Fig.4.6; 4.8) cell lines from day1 to day 6.Cells cultured without applying the drug were used as the control in the study.
From the growth curve and inhibition studies, cisplatin showed significant toxic effects on DLD1 and NCI/ADR cells. Cells cultured without cisplatin experienced better growth with better proliferation rates though the cells were inhibited by cisplatin and even killed in the following days. The percentage inhibition caused by the drugs increased by increasing the concentration of Cisplatin. For DLD1 cell lines, 15.84% cells were inhibited at 0.05µg/mL and 64.04% inhibition was observed at 1µg/mL cisplatin after a one-day drug treatment. A similar trend was observed on NCI/ADR cell lines with only 4.53% inhibition observed at 0.05µg/mL. Hoverer, when presented with higher dose (1µg/mL), more than half of the cells (69.81%) were inhibited after a 24hr exposure. After a 7days culture with cisplatin for both cell lines, nearly 100% inhibition were observed for the three-drug concentrations. The data indicated that Cisplatin was obviously cytotoxic to both cell lines.
Paclitaxel inhibition study on DLD1 and NCI/ADR cell lines
Paclitaxel stock solution (1mg/ml) was made by DMSO and diluted to three concentrations, 10μg/mL; 5μg/mL; 0.5μg/mL, in a RPMI culture medium for the inhibition study. The growth inhibition study was investigated using DLD1 (Fig.4.5; 4.7) and NCI/ADR (Fig.4.6; 4.8) cell lines. Cells treated with paclitaxel on day1 lasted for 8 days. Cells cultured without the drug were used as the control in the study. The viable number of cells was determined by trypan blue dye and MTT assay.
Observations were made on the growth inhibitions against different concentrations of Paclitaxel (molar concentration) as observed on DLD1 and NCI/ADRcell lines (Figure 3.15, 3.16).The growth of the cells inhibited by paclitaxel and inhibitory effects increased by increasing the dosage of the drugs. For DLD1 cell line, the lowest growth inhibition (13.60%) observed at 0.5μg/mL drug concentration (C3) and 78.69% inhibition at 10μg/mL drug concentration (C1) on day 8. The NCI/ADR cell line was more sensitive to the drugs. At 0.5μg/mL drug concentration, very little growth inhibition equivalent to (6.78%) were observed attaining a 95.45% growth inhibition rate at 10μg/mL drug concentration on day 8. The data indicated that Paclitaxel was cytotoxic to both cell lines.
Concentration dependent inhibition of cisplatin and paclitaxel
A number of different data values shown in the last part showed independent inhibitions of cisplatin and paclitaxel. In addition to that, the inhibition data presented here was concentration dependent. Available data were collected after day 3 and both cancer drugs showed an increase in growth inhibitions with concentration increases in drug concentrations.

Summary
The following study used DLD1 and NCI/ADR cultured and treated with paclitaxel and cisplatin on a monolayer culture showed significant results. According to the response study of the administered doses of the drug, three drug doses selected for each drug and used for the following drug tests research gave results that were recorded. Paclitaxel and cisplatin showed significant cytotoxic effects on DLD1 and NCI/ADR cells by inhibiting the growth of cells killed after a long culturing period. Since the Alarmar blue is toxic to DLD1 and NCI/ADR cell lines, this assay cannot be used for cell viability assay for the research. Although trypan Blue exclusive assay is a straightforward and accurate method, large scale administration of the drug test samples required an approach that could be used to analyze several samples at the same time. In this case, this study chose trypan blue assay combined with MTT assay to analyze the toxicity of the drug on cells. The approach on toxicity studies on the drugs in this chapter is based on monolayer culture. This technique has proved the most popular method owing the short time required for its preparation. However, due to the use of 3D structure of tumor tissues, the monolayer-based test might prove inaccurate, leading to the development of new culture models.
Bioreactors for Perfused Culture System
Introduction
The tests on cancer drugs are mostly based on monolayer pretests in laboratories or when introduced to live guest cells in the body including in vivo animal tests. However, these two approaches have already been affirmed, thus a discrepancy from the real human solid tumor tissues for both.
An innovative model could help bridge the gap between traditional 2D cell culture tecniques and labor-intensive animal modelsmimicking in vivo environment and presenting results that are more reliable. As in vivo tissue, organs are three dimensional, cells cultured. In 2D they lose their 3D characters such as morphology and gene expressions (Yamada and Cukierman, 2007b). Thus, three-dimensional cultures have been used in a wide range of biological cell studies. The 3D technique is applied in drug tests. In addition to that there is always a difference in the toxicity of the drugs between 3D and 2D culture models (Dhiman et al., 2005).This discrepancy might provide wrong information of the in vivo response to the activity of the drug (Birgersdotter et al., 2005, Zhang, 2008).
Current 3D scaffolds majorly rely on static culture conditions. Culture medium additions, alterations done as regularly as specified, and depends on different cell lines. That increases the chance of contaminations occurring while cells being cultured are forced to endure nutritional and acidity changes. Since cells are quite sensitive to the surrounding environment, this situation may lead to inaccurate toxicity of the response of the drugs. Thus, perfusion culture provides reliable toxicity information about the drugs, thus providing a stable and reliable environment for testing the drug.
Besides that, normal 3D culture has the limitation in the nutrition and oxygenation perfusion, which is not attainable by simple diffusion. 3D dynamic culture model, as a simulation of vascular system, can significantly improve the cell viability in vivo. Increasing tissue thickness is a limitation that increases in importance (Yamada and Cukierman, 2007b). That is especially for the drug treatment tests, since the death of the cells caused by nutrient restrictions improves the efficiency of the drugs. It has been established that blood vessels involved in the study not only require nutrients and oxygen for transportation, but also signal any regulatory pathways that are not yet fully elucidated (Levenberg, 2005). That is why many researchers are studying on the area of format engineering blood vessels with stem cells or endothelial cells to understand the whole process. As this research is still immature and hard to prepare homogenous drug test samples, we employed this engineering bioreactor based perfusion system for the anti-cancer drug tests.
A bioreactor is a manufactured or engineered apparatus used for bioprocesses. Bioreactors are widely used in tissue engineering research, which offers a biologically relevant model for 3D dynamic culture. The bioreactor based perfusion culture resolves problems of 3D culture such as inadequate nutrition and oxygenation. Since it is possible for the bioreactor to combine 3D culture and perfusion culture, it is widely applied in general-purpose cell-based research.
Bioreactors are applied mainly in two areas. These include cells cultured through high throughput bioprocessing. Bioreactors used for parametric measurements are usually micro scale. In this case, it is easy to carry out a number of experiments under controlled homogeneous conditions. With the help of micro-bioreactor, researcher can monitor PH changes ,dissolved oxygen, and mass transfer during the growth of cells (Harms et al., 2006).
The microenvironment plays a crucial role in cell differentiation and greatly impacts therapeutic efficiency (Stroock and Fischbach). Some cell lines, such as mammalian cells and stem cells, are sensitive to microenvironments and require high nutrition for long term culture (Korin et al., 2009). Bioreactors are applicable in long term 3D culture in a well-defined and homogenous culture environment (Wu et al., 2006b). With the help of a bioreactor, the perfusion culture can provide a tightly controlled and quantifiable culture environment.
For drug treatment tests, even minor alteration of the microenvironments can change the physiology of cells and change the response of drugs.Owing to the steady environment provided by the bioreactor, it has applications in studying the metabolism and toxicity tests of drugs. For instance, the pressure-driven perfusion culture micro chamber array was developed for parallel drug cytotoxicity assay by shinji Sugiura et al., Sugiura et al., (2008a) and the perfusion 3D high-aspect tower fabricated by Yoonsu Choi.et al. (Mito et al., 2009) for support cultures and delivery of reagents.
In this inquiry, bioreactors are employed for perfusion culture in the following drug test studies. The reason for utilizing the bioreactor is based on the previous experience in the use of a similar system for human bone marrow cells (hBMCs) culture and drug tests (Cui et al., 2007) by colleagues in our group. However, for this study, the previous bioreactor and perfusion system altered for 3D cancer culture and drug test research.
Requirement for perfusion cell culture
Perfusion culture implies culturing cells in a dynamic environment, with a culture medium flowing through cells in contrast with the static culture. This is a stable and fresh environment, which keeps the supply of the culture medium and the removal of the medium at the same time, affecting the growth of cells and the efficiency of the drugs. To culture cells in a perfused condition, some elements are required as discussed below.
The Pump
In this study, the syringe pump was utilized as the dynamic supplier. The pump employed in this study has ten channels suitable for the drug test study with multiple drug concentrations. Since the medium will flow over the cells, a suitable flow rate is important during the culture period due to the shear force, which affects the growth of cells. However, the overlay flow will cause shear stress and may influence the growth of cells and cell physiology (Smith et al., 1995, Wu et al., 2008). However, the flow rate employed for this study is only 13.7µL/ hr., low enough to prevent this effect.
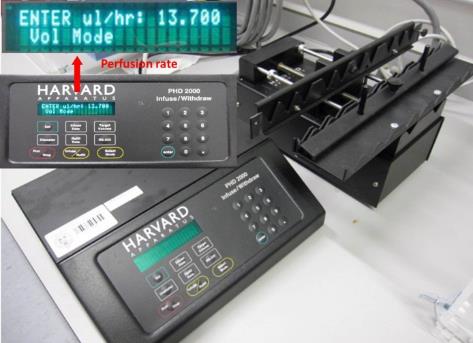
The Desktop incubator
A certain condition is important for cells to proliferate and remain viable. Besides supplying the required nutrition, the cells are kept in the incubator to provide a 37 0C, 5% CO2 and humidity environment. This is similar to the cells cultured in perfusion culture. In this study, the perfusion culture system is kept in the desktop incubator, which could provide 370C, 5% CO2 and humid environment.
Tissueflex
Tissueflex bioreactors were developed by Z.F. Cui and X.Xu in our lab (Cui et al., 2007).In brief, bioreactors were prepared by mixing polydimethylsiloxane (PDMS) with cross-linking agent, poured into 24 well-plate formatted polystyrene molds, de-gassed for ~30 min (to remove bubbles), and baked overnight at 60 °C. The baking process fully cross-links PDMS.
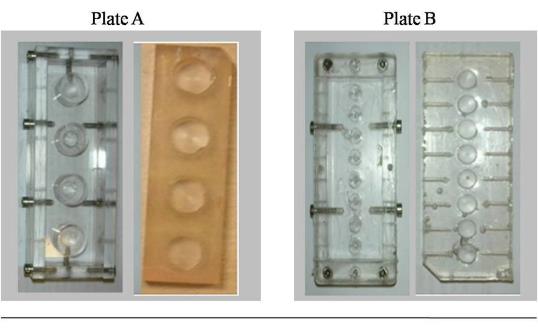
Molds are shown in Plate A, on left and subsequently fabricated bioreactors are shown in Plate B on the right side.
Successful cell culture has a number of basic requirements, including sufficient nutrients, gas exchanges (oxygen in, carbon dioxide out), and sterile conditions to ensure the culture is not contaminated. TissueFlex® bioreactors have many characteristics that match the following requirements:
- Perfused: steady state nutrients supply and waste removal without contamination;
- Gas permeable: good gas exchange again without any risk of contamination;
- Transparent: allowing ready observation of the cells and optically based bioassays;
- Self-sealing: the walls can be injected through to inoculate or sample the culture without having to open the culture vessel;
- Versatile: suitable for multi well plate format, high throughput applications using commercial equipment;
- Flexible: allowing mechanical stimulus e.g. for musculoskeletal cell culture;
- Can be Sterilized by standard methods;
- Scaffold for three-dimensional tissue growth can easily be included.
The TissueFlex® bioreactors were shown to give significant viability to the cells compared with static culture. This was achieved in an excellently controlled with physiologically relevant parameters such as pH and nutrient concentrations. The whole bioreactor based perfusion system was housed in a desktop incubator as shown in following picture (Figure 4.4). For this study, the perfusion system was used for cancer cell culture and anti-cancer drug tests.
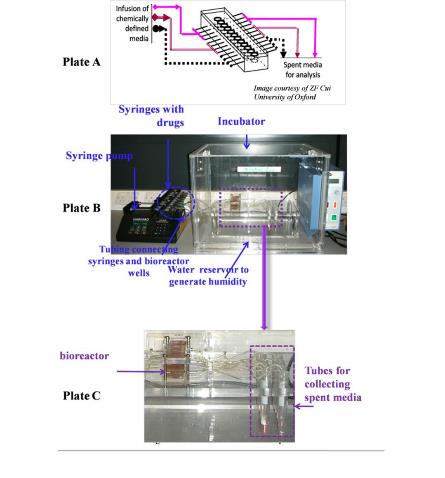
Plate A. A schematic of the diagram of the set up Plate B. The setup de facto Plate C. Close up of the bioreactor.
Adaptation of Tissueflex for Cancer Cell Culture
Since bioreactors will be used for perfusion culture, a study that will be introduced in the following chapter, there is needed to grow cells in the bioreactors within the 24 well plate formats. In addition to that, cells were cultured in both standard plates and bioreactors (tissue flexes) on monolayers when conducting a comparative study to confirm bioreactors are suitable for the growth of cells.
The seeding of the cell lines was done in a solution with a density of 2×10⁵ cells/cm2 before being grown in a RPMI-1640 Medium (w/Sodium Bicarbonate supplemented with 10% fetal calf sera and antibiotics). This was done with the plates incubated at 37°C in a 5% CO2 humid environment for the cells cultured on 24 well culture plates DLD1(colon cancer cell line) and NCI/ADR (human breast cancer cell line).
On the other hand, the bioreactors first underwent autoclave sterilization, and then were coated with poly-lysine (overnight) to be cultured in the bioreactor. Poly-lysine neutralizes hydrophobic surfaces allowing cells to attach to the surface to form a monolayer. Cells were then seeded into each well of the bioreactor with a similar seeding density of cells cultured in plats and allowed to adhere to the bioreactor surface overnight. Incubation was at 37°C under 5% CO2, while the humidity was similar for the cells cultured in plates.
After a three days culture, the number of cells and viability were counted using the trypan blue assay (Figure 4.5). The number of cells and the viability of the growth of the cells in the bioreactor and standard culture plates were compared. Within one specific group, data was presented as the mean ± SD for at least three separate experiments.
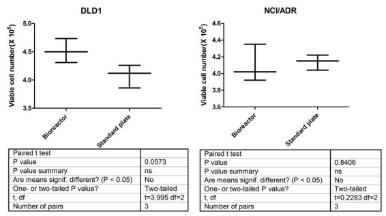
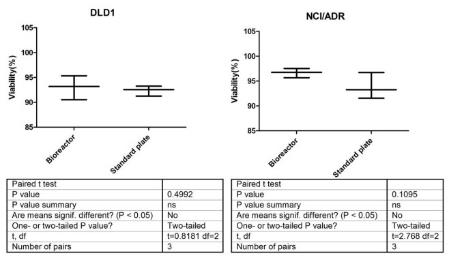
From the above figures, the number of DLD1 cells is larger when cultured in bioreactors than in culture plate. In addition to that, NCI/ADR shows a contrary situation compared to DLD1 cell line. However, all these differences are not significant where, P>0.05. Thus, the rate of DLD1 and NCI/ADR cell proliferation lines are almost the same when cultured in bioreactors and 24 well culture plates. Besides, the numbers of cell viabilities when cultured in bioreactor and culture plate also show a non-significant difference between these two culture methods. The viability of both cell lines are approximately 90% after three days of culturing. The cells cultured in bioreactors are slightly higher than cells cultured in plates. This could be due to the PDMS use of a gas permeable material, which provides more oxygen in the environment. That makes the cells to thrive by growing rapidly in these environments. This proved that the bioreactor made by PDMS could support the growth of cells not affected by the results based on comparative drug tests experiments between static and perfusion culture.
Adaption of Tissue flex for Toxicity of the drugs Tests
Cultured DLD1and NCI/ADR cells were applied in three different concentrations of Cisplatin. Bioreactors made by PDMS were prepared and coated with poly-lysine (overnight) before the cell seeding. A similar cell density used for two culture systems consisted of a similar concentration of drugs. The cultured cells were harvested after three days, with trypsin and the resulting toxicity measured by try pan blue assay (Fig.4.6).
To conduct a significance test, a t-test analysis done on data values with P values larger than 0.05 to prove and determine the differences of the drug test results based on the two methods showed the results were not significant. By comparing the rate, growth, status of the cells, and the toxicity responses of the drugs, bioreactors were used to support the growth of cells showing no additional effects on drug test results. In conclusion, there were no differences when culturing occurred on culture plates and in bioreactors with the culture cells. Thus, the results were utilized in the following experiments to study the static and perfusion culture.
Adaption of Tissue flex for perfusion culture
Perfusion culture based on bioreactors had cells seeded in bioreactors wells. A syringe pump supplied the culture medium with the appropriate solution and the waste medium was pumped out through the tubes and collected at specific points in the system during the culturing period. The infusion flow rate was 0.0138 ml/hr. The total amount of media infused was tracked (1ml), which was observed to be equivalent to the amount of media in each well of the parallel static culture experiment. The whole culture system was housed in a desktop incubator at controlled atmospheric temperature (37°C) and humidity.
Proliferation of cancer cells in perfusion culture system
Two cancer cell lines, DLD1 and NCI/ADR, were seeded into the bioreactor with a concentration of 2-×105 cells/ml then cultured under static and perfusion controlled conditions. The effects of dynamic culture on the growth of cells and viability were assayed with the Trypan blue and MTT assays. The whole experiments lasted for ten days with measurements taken every day. Data comparisons between static and perfusion for monolayer culture and three-dimensional cultures were done. In this study, each specific group of data are presented as the mean ± with the standard error of the mean (SEM) from at least three separate experiments recorded. To compare drug responses under the two culture conditions, a two-tailed Student’s t-test with the value of p < 0.05 was regarded as significant.
To evaluate the perfusion culture system for human cancer cell culture, DLD1 and NCI/ADR cells assessed for proliferation and cell viability for over a period of 10 days of perfusion culture were registered. The total number of viable cells showed that cell proliferations occurred in the perfusion system (Fig.4.8). Resulting data were analyzed by t-test to determine the significance in the differences. The p-value of NCI/ADR cells was larger than 0.05, implying that the NCI/ADR cells have similar proliferation rate when cultured in static and perfusion conditions. However, for DLD1 cell lines, the number of viable cells cultured in perfused condition was significantly lower than cells cultured in static (p<0.05). This could be due to two reasons that perfused culture cells might affect cell attachments, which is important for 2D culture. In addition, the other reason might be that the flow may take away a small number of molecules, which support the growth of the cell during the cell-culturing period. However, we assume that this is not a problem for 3D perfusion culture cells as these cells are protected with biomaterials covering the cells when they are still single cells. 4.5.2 Cell viability of cancer cells in perfusion culture system Cell viability of DLD1 cell line was quantified by MTT and trypan blue assay (Fig.3.2). The results showed that there were no significant differences (P>0.05) between static and perfusion for 2D culture due to its structural characteristic limitations. Although the perfusion keeps a nitrite supply for cells, this can only affect the growth of cells on the surface of culture plate.
Adaption of Tissueflex for three dimensional culture
DLD1 and NCI/ADR cells were first seeded into the alginate beads consisting of a cell seeding density of 2×10⁵ cells/ml. They were then cultured for six days to form micro-tumors, which were required for the study. Then, the micro-tumors were removed after the alginate beads had been dissolved and washed three times in the culture medium. Microtumors were then put into the bioreactors and cultured under both static and perfusion culture conditions. However, during the culture periods, a problem was noted.
For the three-dimensional cultures, the cells were put into bioreactor without pre-coating them. In this case, cells could be washed away by flowing the washing medium. According to hemocytometer results on the spent medium collection, 1.5×10⁵ cells on the average were lost for the 1mL spent medium after a three-day culture period. In this case, in order to employ bioreactors for the three-dimensional perfused culture, bioreactors required further improvements.
Improvement of Bioreactors
Avoiding cell lose during perfusion culture
To avoid the loss of cells during the perfusion 3D culture, which could result in inaccuracies in the effectiveness of the drugs, the bioreactor was improved by adding 40µm or 70µm pore sized membranes at the head of outlet tube (Fig 2.1) for the NCI/ADR and DLD1 3D culture environments respectively. These are shown in plate B of figure 2.1. The pumping of the culture medium is from the input tube at the lower position and pumped out from the outlet tube on the higher level. The flow mixes the medium with fresh medium, which provide cells a much fresh environment.
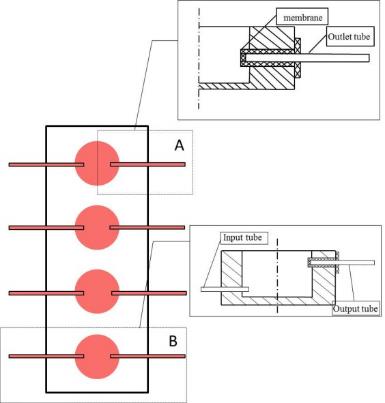
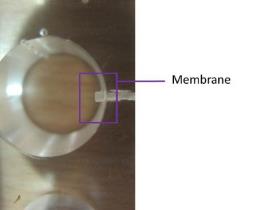
In order to confirm the function of the membrane, cells with and without the membrane were cultured in bioreactors for the comparative study. The DLD1 and NCI/ADR seeding for the cells was into the alginate beads consisting of a cell density of 2×10⁵ cells/ml and cultured for six days to form the required micro-tumors. Then, the micro-tumors were then removed after dissolving the alginate beads and washed three-times with the culture medium. Microtumors were then selected by size, which is controlled in 40~70 and 70~100, respectively for NCI/ADR and DLD1 cell lines, using the 40µm 70µm and 100µm pore size filter (Fisher, UK). Insertion of the Microtumors was done into bioreactors, which are with and without membranes, for a three-day culture on the same cell density. Tubes were used to collect the spent medium during the culture period. The spent medium thus collected was centrifuged and number of cells was measured by MTT assay.
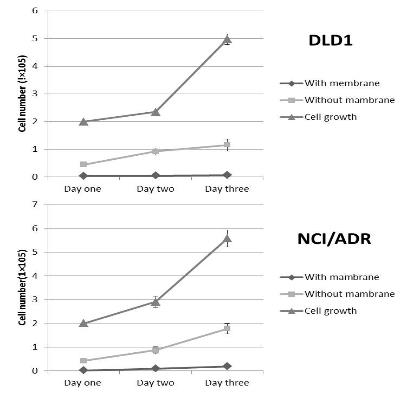
Compared to previous bioreactor, micro-tumors cultured in current bioreactor showed a loss of a smaller number of cells during the perfusion culture period. For DLD1 cell lines, cells in bioreactors without membrane lost 23.25% (1.15×10⁵) cells and the improved bioreactor reduced this loss to 1.37% (0.068×10⁵) when there were 4.97×10⁵ cells in the culture wells. Similar trends in were observed with NCI/ADR culture that decreased the washed away cells from 31.82 % (1.77×10⁵) to 3.48% (0.18×10⁵) at day three when 5.57×10⁵ cells were in the culture well of the bioreactor. The sizes of the pores chosen for the bioreactor are bigger than the average size of the pores of the micro-tumors resulting in their blockage. However, from the data we could conclude that few cells were washed away during the experiment. That might be due to single cells coming off from the micro tumors during the culture period. DLD1 is more aggregative than NCI/ ADR that means the DLD1 cells are likely to adhere together. Thus, DLD1 formed bigger size micro tumors and cells are hard to release from the micro tumors than NCI/ADR cells. In this case, the number of DLD1 cells lost is significantly much higher when compared to NCI/ADR.
No matter the technique for culturing the cell or drug tests done, samples applied to different group, used to compare the study need have to be similar. This is the basic requirement for the comparison experiment. Nearly 20% of cells lost during the culture period had a problem, not to be ignored. The 3D perfusion experiment using the previous bioreactor cannot assure the integrality of the samples though it provides reliable data. Improving the bioreactor reduced this lost to acceptable levels. The perfusion culture system based on the improved bioreactor can be trust for further 3D culture and drug tests study.
Bioreactor mount
To prevent liquid link and provide an orderly platform for the bioreactors, a bioreactor mounting was designed. The Bioreactor mount was designed with three specific parts. The first part was designed to provide a pressure cover at the top of the mounting to avoid the liquid leaking from the lid of the bioreactor. Two rows of grooves were added to both sides of the bioreactor to line up the meshed tubing. The third important part was the batch with a 15ml tube with holes to support the tubes to collect spent medium.
In the study, the perfusion culture protection and prevention from coming into direct contact with any leaking liquids used in the study and loss of experimental samples were supported on the bioreactor mounting and membranes. The improvement of bioreactor culture system provides a stable and reliable condition for cell relative study and analysis.
Summary
In this part of the study, bioreactor (tissue-flex) cells were used for cell cultures based on multiple approaches. When the cells were cultured in bioreactor on a monolayer, a cells growth well, the proliferation rate and cell viability were non-significant factors, and were different to the cells grown in standard culture plates. Cisplatin was introduced for the drug test studies and the toxicity response showed no significant differences as well. This proved that bioreactor made by PDMS can support the growth of cells and might not affect the results of the following drug tests experiments. As cells are happy to growth in the bioreactor, DLD1 and NCI/ADR cells were cultured in perfusion system. Perfusion culture is believed to provide a more stable and physiology environment. The total number of viable cells showed that cell proliferations occurred in the perfusion system and has no significant differences from the static cultured cells when they were cultured in monolayers.
This could be due to the limitations of the 2D culture where tissues in three-dimensional cultures rely on nutrient diffusion. We assume therefore that significant difference between perfusion and static for three-dimensional cultures are likely to occur. To avoid losing cells during the 3D perfusion process, bioreactor was improved by adding membranes. The improved bioreactor reduced the number of cell lost to an acceptable level thus, keeping the samples intact during the culturing period. Cells are sensitive to the culture environment hence small differences can affect the growth of the cells and relatively any cell based study. Providing a stable environment is extremely important for agent test studies while studies show that perfusion culture can improve the culture condition of the cells. After monolayer culture of DLD1 and NCI/ADR cells in perfusion culture system, bioreactor was confirmed suitable for cell culture. And due to the membrane added, bioreactors are support not only cells growth on the surface of the bioreactor but also micro tumors growth in suspension. Thus, further studies concerning 3D models for cancer cell culture and drug tests are recommended in view of this part.
Development of in Vitro Perfused Three-Dimensional Cancer Model
Introduction
Tumor biology is extremely complicated and not yet fully understood in the realms of scientific knowledge. However, either the characteristics of tumors or tumor environments strongly respond to the cytotoxic effects of anti-tumor chemotherapeutic agents (Raghunand et al., 1999b). To test the results from the effects of the drugs with accuracy on tumor cells, both cell culture models and the culture environments used in the tests are the key considerations and critical factors in the tests. Thus, cancer-cell culture models with complex tumor-cell structures and related microenvironments additionally play significant roles in testing the cytotoxic effects of the drugs in chemo resistance studies.
The drug is a product not allowed for clinical use, hence not brought to the market unless preclinical tests are conducted with positive results. Currently, the tests are manly done on animals, such as the Human Xenograft and the Mouse Allograft (Hanson et al., 1984). For the therapeutic area, there is always a risk to patients because the predicted data on the effects of the drugs by animal tests are either ineffective or inaccurate. Actually, these models were shown to have some limitations and were not predictive for some types of cancer (Voskoglou-Nomikos et al., 2003, Bailey et al., 1984). For both the patients suffering from cancer or for industry use, questioning the efficiency of the therapeutic approach, a specific in vitro anticancer drug-tests model is definitely needed.
Research has shown that, cell based assays have become the main method in many stages of anti-tumor drug tests owing to the simple operation and a large scale number of tests. However, the discrepancy between monolayer culture and in vivo situation is significant. This is due to the lack of 3D structures for monolayer-cultured cells. Three dimensional culture has shown differences with the monolayer culture across a number of characteristics including morphology and genecology (Yamada and Cukierman, 2007b). An in vitro 3D tumor model to represent the 3D structure is apparently required for drug discovery research.
There are many approaches to conduct 3D cultures. Among these models, spheroid is the most popular technique (Kondo et al., Shield et al., 2009). Spheroid is a three dimensional cell aggregation that can mimic the structural characteristics of micro tumor. In order to get the cell aggregations, cells must have the ability to adhere to each other, which means they must not grow on the surface of the substrates. To achieve this purpose, the simplest way is to coat the surface with specific hydrophobic biomaterials such as agar, agarose and matrigel to avoid cell adhesion. In this case, cells are made to grow together and then get bigger sized by proliferation (1984). Spheroids based 3D cancer model contribute to the understanding of tumor biology, pathology and toxicity effects of the studies on the drugs (L’Esperance et al., 2008, Prados et al., 2008, Shield et al., 2009).
There are also other ways to culture cells in 3D scaffolds using biomaterials such as collagen and alginate (Agrez, 1989, Furukawa et al., 1992). Alginate is a family of polyanionic copolymers derived from brown sea algae. Alginate is accepted due to the simple way of using it and the hydrogel characteristics that make it a good artificial extracellular matrix material. The high porosity of alginate allows high diffusion rates of the nutrient, which are needed for the growth of the cells. The very material adopted in this study is a 3D scaffold compared with agar scaffold. Different 3D models have their own limitations and benefits. The study of building suitable 3D cancer model is important for the development in the knowledge of cancer and anti-cancer drug tests.
Although the cells cultured in 3D models can better present the 3D structure of the tumor tissues, the current 3D culture has the limitation of nutrition and oxygenation perfusion, which cannot be achieved by simple diffusion. Increasing the thickness of tissues makes the limitation more significant. 3D dynamic culture model, as a simulation of vascular system, can significantly improve the cell viability in vivo. Besides these, the perfusion culture can provide a stable and physiological microenvironment for 3D cancer cell culture. The features of hypoxia, low blood supply, and acidity characterizing tumor environments represent key factors in tumor malignancy and tumor progressions, which shows the importance of the tumor environment. In addition, among these complicated factors, the pH of tumor microenvironment (tumor acidity) has been proved to be effective on many tumor functions including invasive and chemo-resistance (Martinez-Zaguilan et al., 1996, Gatenby et al., 2006). The perfusion culture can easily regulate the culture pH during the growth of the cells and drug treatment period. This is extremely helpful for a better understanding of the relationship between tumor acidity and tumor progression or the effectiveness of chemotherapeutic drugs (Montcourrier et al., 1994).
In this study, a 3D alginate-perfusion culture model was developed. The 3D culture provided cancer cells with similar characteristics to tumor like structures. Combining the perfusion function, this alginate perfusion culture system can stimulate the blood vessel function in a real tumor, which is believed can provide an accurate approach for testing the drug in the study. In addition, this model is useful for other correlated tumor function studies and chemo-resistance studies.
Materials and Methods
Cell preparation
For maintenance, DLD1 (colon cancer cell line) and NCI/ADR (human breast cancer cell line) cell lines were grown as monolayers on the surface of standard T-75cm2 tissue culture plates with RPMI-1640 Media (w/Sodium Bicarbonate, supplemented with 10% fetal calf sera and antibiotics). The cultures were incubated at 37°C in a 5% CO2 humid environment. After two days, when the cultures were nearly confluent, the cells were trypsinized, and then sub-cultured in a newly created environment. As a part of maintenance, cells were sub-cultured after every two days and cell viability tests conducted with trypan blue to insure high quality cells for further experiments.
In vitro three dimensional cancer model
Microtumors formed in 3D alginate scaffold
Alginic acid sodium salt was purchased from Sigma-Aldrich. Alginate was dissolved in 0.9% NaCl at a concentration of 1.2 %( w/v). The solution was constantly stirred throughout the night to ensure the alginate sterilized by autoclave dissolved completely. In order to study the best cell seeding density, the cells were harvest and suspended in the 1.2% alginate solution at a density from 0.5×10⁵ to 8×10⁶cells/ml (Hauselmann et al., 1992). Microcapsules were produced by using the 22 g needles (Wang et al., 2001). For cross-linking, the alginate and cell suspension were dropped into a 102mM CaCl2 solution (Figure 5.1). After 10minutes cross-linking, alginate beads were removed and washed three times with 0.9% NaCl for 10 min each time and twice with fresh culture medium before they were transferred into 24-well culture plates. Alginate beads were then transferred to plates at a density of 10 beads/well with 1ml fresh medium. The culture plates were incubated at 37°C in a 5% CO2 humidified atmosphere.
The cultures lasted for 10 days and the alginate beads were each day taken out and dissolved with Citrate buffer (55 mM sodium citrate, 30 mM EDTA, 0.15 M NaCl).Cell viabilities were measured using the trypan blue assay. At the same time, two perpendicular diameters of the micro-tumours were every day measured by Nikon microscope. The volumes were calculated from the following mathematical expression:

Where a and b are the transverse and vertical radius. A=2a is the equatorial diameter and B=2b is the polar diameter, which are the shorter and longer diameters(Sasaki et al., 1984). The experiments are tripled and the data shows in figures are the average of volume SD.
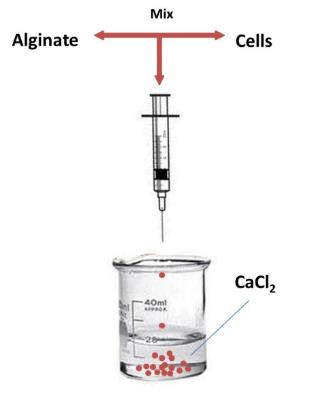
Spheroids formed on agar coated surface
DLD1 cells were harvest and sub-cultured onto plates pre-coated with 0.5% noble agar (Sigma-Aldrich; Yuhas et al., 1977). DLD1 cells were suspended with a fresh culture medium to a mixture at a cell density of 1×10⁵cells/mL. Then, the mixture was dropped onto the surface of the substrates at a density of 10 drops/well plus 1ml fresh medium. In this way, the number of cells in each well for the two culture models (alginate beads and agar-coated surface) was the same. The cultures were lasted for 10 days and theviability, diameters and and distribution were measured in the same way with micro-tumors (MTs) mentioned above.
Character study of spheroids and micro-tumors
DLD1 cells were cultured in alginate beads, and then cultured on agar-coated surfaces at a cell density of 1×10⁵cells/mL for 8 days. During the culturing period, spheroids and MTs were observed with the morphological effects at day 2, day 4, day 6, and day 8. The observation of spheroid and MT’s morphologies were then separated into three groups. The first group was the status of the culture for both spheroids grown on the agar surface and MTs grown in alginate beads. Secondly, spheroids were taken out of the agar surface while the MTs were released after dissolving alginate beads. After centrifuging the samples from each well, they were re-suspended with 200µL fresh culture mediums and well mix through the up and down pipetting technique. Then, the samples were observed for their morphological behaviour of spheroids and MTs after being re-suspended. In the same time, the viability was measured by trypan blue assay as well. For the third group, the spheroids and MTs were treated with trypsin and then washed with PBS and incubated for 10 minutes and gradually, the morphology of spheroids and MTs, were taken before and after trypsin treatment were comparisons.
Three dimensional perfusion culture
Proliferation and Cell viability of cancer cells in 3D perfusion culture system
DLD1 cells were seeded in alginate scaffolds as mono-dispersed cells at acell density of 1×10⁵ cells/mL. The alginate beads were transferred into wells of both 24-well culture plates and bioreactors for static and perfused culture. In order to test cell viability and number of cells, alginate beads were dissolved using citrate buffers and MTs released from alginate were washed with PBS and re-suspended with fresh culture medium. Then the number of cells and viability tests by trypan blue exclusion assay were conducted. This culture lasted for eight days and the viability number of cells and cell viabilities were measured every day during culture period. In addition, the data from static and perfusion culture were compared and analyzed using a statistical t test.
Restructured micro-tumors formation in perfusion culture system
In order to study the structure of micro-tumors formation in perfusion culture system, DLD1 cells were cultured under static and perfused conditions for six days. For each day, Alginate beads were taken from each well and MTs were released by adding citrate buffer and then re-suspending in a 100µL fresh medium. The numbers of MTs with a diameter bigger than 40µm was counted using the hemocytometer for each well and the morphology observed by Nikon microscope. Beside this, the distribution and volume of MTs formed from static and perfusion culture were calculated by the equation mentioned previous.
Drug treatments
Drug response on cells growth on monolayer and in 3D culture
DLD1 and NCI/ADR cells were first cultured in alginate beads at a cell density of 1.25×10⁵ cells/well (1.0×10⁵ cells/mL and 10 beads per well) for 6 days from day 0 to day 6.After six days cultivation, MTs were released from alginate scaffolds by dissolving the alginate beads with citrate buffers. MTs, which are in the range of 70µm to 100µm, were selected with cell seizes. These selected MTs, were re-seeded in alginate beads at a density of 0.5×10⁵MTs/mL with a 22g needle. Washed beads twice with PBS for 10 min and twice with fresh culture medium for 5 min before transferred into 24-well plates at the seeding density of 10beads/well. In this case, MTs encapsulated in alginate and re-seeded at a density of 0.625×10⁴ MTs/well. The MTs were cultured with 1ml RPMI1640 with 10% FBS and 1% AB with drugs at different doses.
At day five, DLD1 and NCI/ADR cells were cultured on monolayers at a cell density of 1.25×10⁵ cells/well for one-day culture to let cells attached to the surface. In this case, on day 6, two drugs, paclitaxel and cisplatin, were applied to cells both on monolayer and MTs reseeded in alginate beads.
Drug stock solutions of (1mg/ml) were made using DMSO and diluted to three concentrations by use of the RPMI culture mediums for the inhibition study. Two concentrations of paclitaxel (10μg/mL and 5μg/mL) and three concentrations of cisplatin (1μg/mL; 0.5μg/mL; 0.05μg/mL) were tested on cell lines. Drug treatments lasted for three days and a one 1mL fresh medium and changed for two days further culture. After further day culture, medium was removed and changed for 1mL fresh medium and 100µL MTT was added to the MTT assay.
Drug response on spheroids and MTs
DLD1 and NCI/ADR cells were cultured in alginate and agar surfaces with cells whose density was 1.25×10⁵ cells/well (1.0×10⁵ cells/mL and 10 drops per well).The spheroids and micro-tumours were collected at day 6 and MTs were released after dissolving the alginate beads. The sizes of the samples were limited to 100µm to 70µm use cell seizer. After tissue selections were done, spheroids and micro-tumour were re-seeded in alginates and transferred to the bioreactors at a density of 0.625 × 10⁴ MTs/well and exposed to cisplatin and paclitaxel at varying concentrations of 1μg/mL;0.5μg/mL; 0.05μg/mL and10μg/mL; 5μg/mL, respectively. After three days of treating the drug, the medium was removed and replaced in a fresh medium for two days to further culture the cells. The response to the drug by the spheroids and MTs in static culture was analysed using MTT assay after further culturing.
Drug response on spheroids and MTs cultured in static and perfused culture
Besides the drug treatments in static culture, spheroids and MTs were exposed to Paclitaxel and Cisplatin under perfused culture. The formation of spheroids and alginate used same method mentioned in the previous section.The spheroids, micro-tumours were collected at day 6, and MTs was released after dissolving the alginate beads. After the tissues were selected, which selected in the range of 70µm to 100µm, spheroids and MTswere reseeded in alginate and transferred to bioreactor at density of 0.625×10⁴ MTs/welland set up in perfused culture system. Three same concentrations of cisplatin and paclitaxel were prepared and pumped into the bioreactor wells for three days. The diffusion rate is 13.7µL/hr, which supplied with a 1mL culture medium and a similar dose of drug after three days and is similar to the samples cultured in static bioreactors. After three days treating with the drug, the response of the drug was analyzed by MTT with the same technique mentioned above.
Cytotoxicity assay with MTT assay
MTT standard curve for 2D and 3D culture
First, the standard curves for 2D and 3D culture were analyzed. For the 2D standard culture, cells were each seeded into each well with 24-well plates at a 10-cell density varying from 1×10⁵cells/well to 1×10⁶cells/well. After a one-day culture, to let cells attach onto the surfaces of the substrates, the medium was removed from the plates. That was attained by adding 1mL fresh culture medium to a 100µL MTT solution (5 mg/ml MTT in PBS). The plates were incubated for 4 hours and the purple crystals formed were dissolved in DMSO. The absorption was measured using a spectrophotometric micro-plate reader at a test wavelength of 570 nm. In this case, a linear relation between number of cells and absorbance was calculated.
For 3D MTT standard curve,the cells were encapsulated in alginate with cell densities of 4×10⁵ cells/bead. Placed alginate beads in 24-well flat-bottomed micro culture plates at various plating densities from 4×10⁵ 1ml−1 well−1(one bead) to 4×1061ml−1 well−1(10 beads). Cells were incubated for 36 h at 37°C, 5% CO2. At the end of incubation, remove the medium from all wells and change the fresh medium. Following, 100 μL of MTT solution in PBS at 5 mg ml−1 was added to each well to perform a quantitative colorimetric assay for cell proliferation. Then the micro culture plates were incubated at 37°C for 4 h. After the incubation, the medium in each well was discarded and 1ml of dimethyl sulfoxide (DMSO, Sigma) was added to the wells to dissolve the dark blue crystal, made from mitochondrial enzymes obtained from MTT. Since the DMSO requires more time to get into the center of alginate beads, the DMSO solution in each well was agitated for 30 min to dissolve the crystals in each well completely. Then the medium was transferred to the 96-well plate and readings taken on a microplate reader (Bio-Rad, Model 525). Then a linear relation between the number of cells and absorption levels were calculated.
The assay reading was 570 nm.
MTT assay for toxicity of the drugs
For drug treatments on cells in the monolayer culture, after the three days of exposure, one-day further culture was applied by changing the 1mL fresh medium. Then the solution was removed and replaced with a 1mL fresh culture medium in a 100µL MTT solution in a concentration of 5 mg/ml MTT in PBS. Plates were then incubated for 4 h in order to form purple crystal and then were dissolved in DMSO. The absorbance was measured with a spectrophotometric micro plate reader at a test wavelength of 570 nm.
For the 3D drug treatments, at the end of the drug exposure period, remove the medium with drug and feed beads with1ml fresh medium for one day further culture. After the further culture, the medium will be changed for fresh medium and add 100μl of MTT solution in PBS at 5 mg ml−1 to each well to perform a quantitative colorimetric assay for cell proliferation. Then the micro culture plates were incubated at 37°C for 4 hrs. After the incubation, the medium in each well was discarded and 1ml of dimethyl sulfoxide (DMSO, Sigma) was added to all wells to dissolve the dark blue crystal. Then the DMSO solution in each well was agitated for 30 min to dissolve the crystals in each well completely. Then the medium will transfer to 96-well plate and read on a microplate reader (Bio-Rad, Model 525). Three wells are used for each drug concentration to give triplicate determinations within one experiment.
Statistical Analysis
All the data are presented as mean± the standard deviation from at least three separate experiments.The data of each group were compared andtwo-tailed Student’s t-test was used to judge statistical significance. If the calculated p-value is below the threshold chosen for statistical significance (0.05), then the null hypothesis which usually states that the two groups do not differ is rejected in favor of an alternative hypothesis, which typically states that the two groups, be compared, do differ.
Results and Discussions
Microtumor formation
Alginate scaffold 3D model
Alginate is a family of polyanionic copolymers derived from brown sea algae. In molecular terms, alginates constitute a family of unbranched binary copolymers of 1-4 linked β-D-mannuronic acid (M) and α-L-guluronic acid (G) acid of widely varying composition and sequence (Figure 5.2) (Smidsrod and Haug, 1972, Smidsrod and Skjak-Braek, 1990, Boylan, 1971).The monomers are arranged in a pattern of blocks along the chain. G-blocks is the most important structure feature for alginate gel formation because divalent cations, for instance Ca2+ and Sr 2+, are prefer to bind to G-blocks in a highly cooperative manner(Smidsrod and Skjak-Braek, 1990).
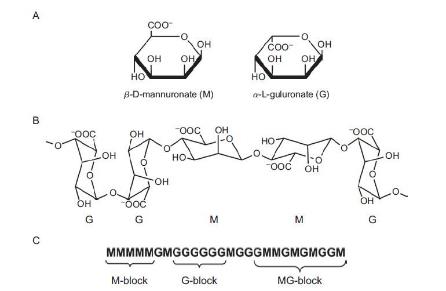
Among many vary techniques for 3D cell culture, alginate become the most widely used 3D culture methods by immobilizing living cells (Nunes et al., Rao Ch et al., 2008). Alginate gel beads was considered the most promising and versatile method for cell immobilization and culture methods for cell lines and small organs (Smidsrod and Skjak-Braek, 1990, Hertzberg et al., 1992).The wide applications of alginate was due to the single-step process and the gentle environment provided (Sakai et al., 2008, Griffiths, 1990). Thus, these characteristics made alginate gel compatible with most cell lines (Lin et al., 2009, Frampton et al., Kumabe et al., 2006). In this study, alginate was chosen as the material for the 3D culture model. The alginate has many outstanding advantages, which are list below.
High porosity and molecular diffusion
The diffusion of substrates and products are related with pore size and the pore size distributions(Smidsrod and Skjak-Braek, 1990). For alginate beads, small molecules such as glucose has high diffusion rate through alginate matrices. There are some larger molecules diffusional restriction depending on the molecular size and different alginate pore structure. Although the high porosity is the reason for causing cell to leak into the alginate-encapsulated cultures, for the cancer cell culture and microtumor formation, the leaking of cells is not a problem since the proliferation rate of the cells is high with relatively larger sized MTs. In this case, the high porosity become the outstanding advantage for high diffusion rates for substrates and other useful products.
Biocompatibility
In order to use as the 3D cell culture scaffold material, the biocompatibility is extremely important. For the cell culture for further transplantation applications (Schulze et al., 2000, Zhao et al., 2008), the biocompatibility is important that could be absorb and replace the damage organs and tissues. For other cell line culture, at least, the material is not toxic to cells. Alginate has no toxic to cells that only few sensitive cells may harm by small amount of polyphenols.
Mechanical strength
The mechanical strength is dependent on the amount of G-blocks in the gel. The mechanical strength is also affected by the concentrations of both Na-alginate and CaCl2(Smidsrod and Skjak-Braek, 1990, Maiorella B, 1989).Thus, the mechanical strength of alginate gel can be controlled by changing the Ca-alginate concentrations or just using the alginate content different amount of G-blocks. This controllable swelling property is an important advantage that could provide cells a flexible gel environment. Moreover, for cancer cell culture and MTs formation, the swelling and dissolution properties provide a softer and a slowly increases the alginate’s pore sizes. The swelling structure of alginate can just meet the increased demand of nutrient for MTs as compared with single cancer cells.
High chemical stability
In contrast to other hydrogels, Ca2+-alginate is more stable. The stability of alginate beads are affected by presence of anti-gelling cations such as Na+ and Mg2+(Smidsrod and Skjak-Braek, 1990). In addition, it is sensitive to chelating compounds such as citrate and lactate. It is easy to avoid this limitation by using culture medium containing a few millimolar free calcium ions and to reduce Na+, Ca2+ ratio. In addition, in this way, citrate buffer can easily release the MTs.
In this study, alginate was choosing as the scaffold material for 3D cancer cell culture model. In order to obtain alginate beads with efficient properties, there are severalparameters need to consider.
Type of alginate
The amount of G-blocks results in different mechanical strength and different type of alginate has varied amount G-blocks(Stabler et al., 2001). Alginate with high G-content has high mechanical strength and stable structures (Constantinidis et al., 1999, Stabler et al., 2002). Alginate with low G-blocks forms softer and more flexible gels. As the alginate has the swelling character that if swelling and recovery of cell is required for cultivation, the low G-blocks alginate is better for the choice. The average length of G-blocks (NG>1) over 10 belong to the high G-content which are always extract from old hyperborean plants. The alginate used for immobilization is mostly from Mpyrifera (macrocystispyrifera) with lower strength and stability than alginate made from L- hyprborea (Laminariahyprborea) (Smidsrod and Skjak-Braek, 1990).The alginate employed in this study is extracted from brown algae and the NG>1 is approximately 5 and belongs to the low G-content and have relatively leaner characters.
Concentrations of alginates
The concentrations of Na+-alginate and CaCl2 will affect mechanical strength and porosity of alginate gel. The higher alginate concentration results in more stable and convenient bead structure for long-term cultivation(Smidsrod and Skjak-Braek, 1990). On the other hand, the lower concentration of alginate leads to better diffusional characteristics but at the meantime also results in less lasting time due to destabilization of beads. According to Stabler et all,(Stabler et al., 2001). Inorder to achieve sufficient bead stability and optimum mass transfer, the optimal concentrations of alginate should be in the range of 1% to 1.5% (w/v)(Selimoglu and Elibol). The concentration of alginate introduced in this study is at a concentration of 1.2 %( w/v) which is just in this range.
Bead size
The bead size is affected by concentrations of CaCl2, viscosity of Na+ -alginate and the syringe diameter(Klokk and Melvik, 2002, Martinsen et al., 1989). Although the beads sizes decreased by increasing the concentrations of CaCl2, it has also been reported that concentrations of CaCl2 over 50mM does not affect bead size. The concentration of CaCl2 introduced in this study is 102 mM, thus will not affect the bead size. The increase of alginate results in an increase of in the beads size and thus leads to the higher mass transfer restriction. However, with the certain type and concentration of alginate, the bigger bead size of alginate have higher amount of G-blocks, which leads to increase of mechanical strength and higher mass transfer restriction. On the other hand it was also been reported that by the increase of the size of beads, the greater cell concentrations could be reached. The diameter of bead below 1mm is sorted to small size beads. Thus, to obtain sufficient diffusion with convenient cell concentrations, the alginate beads were made by 22gauge needles (nominal inner diameter of 22gauge is 0.413mm).
Cell concentration
Since the pore size of beads, MTs size and distribution are correlative with seeding cell density, this experiment designed to get the best cell seeding density that can give bigger size and higher cell viability MTs. MTs were measured as described in “Material and methods” and volume of MTs were show in the following figure (Figure 5.3).
Obviously, cells cultured at 1×10⁵ and 2×10⁵ cells/ml cell densities formed larger sized micro-tumours than the others especially after five days culture. At day six, the average diameter of MTs formed in alginate beads with cell density of 1×10⁵ is 78.68 µm, which is almost five times larger than MTs formed at the cell density of 8×10⁵ (16.2µm). Actually, the diameter of DLD1 cell is around 12µm so that aggregations, of which diameters is around 16.2µm cannot be considered as spheroids. Average diameter of MTs in density of 1×10⁵ and 2×10⁵ are 78.68 µm and 94.69µm after six days cultures, which are apparently much larger than diameter of single cell. Along with MTs growth to bigger size, the viability could be decrease due to limitation of nutrient and oxygen diffusion. The viability of MTs were measured by both trypan blue and MTT assay during the eight days culture (Figure 5.4).
Viability of MTs formed in Alginate with cell density of 0.5×10⁵ cells/ml is the highest among eight densities. However, on day six, the average diameter of MTs at the current density was 43.9µm, which is half the size of MTs at the density of 1×10⁵. The disparity increased on day eight. MTs at a density of 1×10⁵ had high cell viabilities on day six. The viability of MTs was 88.37% and after eight days of culturing, 70% cells were, still alive.In this case, combining the viability of micro-tumours with 1×10⁵ cells/ml seeding density showed not only bigger sized MTs, but also better distributions and higher viabilities. The selected density of applied cells in the following 3D culture related experiments showed significant results. Figure 5.5 show the morphology of MTs formed with DLD1 cells in the cell density of 1×10⁵cells/ml.
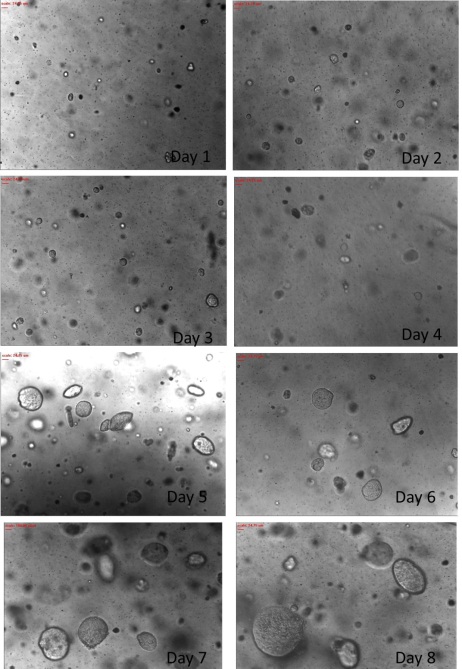
DLD1 cells in the cell density of 1×10⁵cells/ml.
Spheroids and Microtumors
Character study of spheroids and microtumors
Morphology
Spheroids formed on the agar surface are one of the most popular 3D models for tumour cell culture and widely used in tumour biology, pathology and oncology (Bryce et al., 2009, Oktem et al., 2006). There are several approaches to complete spheroids culture and cell seeding on the agar surface is the most common way to achieve(Verma et al., 2009). Thus, this very approach was selected as the best approach to culture cancer cells as spheroids. In the study, the spheroids and microtumor formed in alginate beads were compared with morphology and tumour like characteristics.
In order to compare the morphology and the characterict of spheroids and microtumors, DLD1 cells were cultured on an agar surface and in alginate beads respectively at a cell density of 1 ×10⁵cells/ml for eight days. Then, the spheroids and micro-tumours were observed and the size was measured using a Nikon microscope. Figure 5.6 shows the morphology of MTs and spheroids during the 8 days of the culturing period. At the same time, the diameters of spheroids and micro-tumours were measured using a microscope and the resulting volumes were calculated and listed in table 5.1.
Based on the results of the aggregate volumes, observations show that the spheroids formed on Agar were larger than MTs formed in alginate beads. In addition, the difference turns to distinct after six days culture that there is a nearly 40µm3×10–3 bigger volume for spheroids as compared to MTs. In addition, at day 8, even the average diameter of spheroids (113.47µm) is more than 10µm larger than MTs (101.69µm).
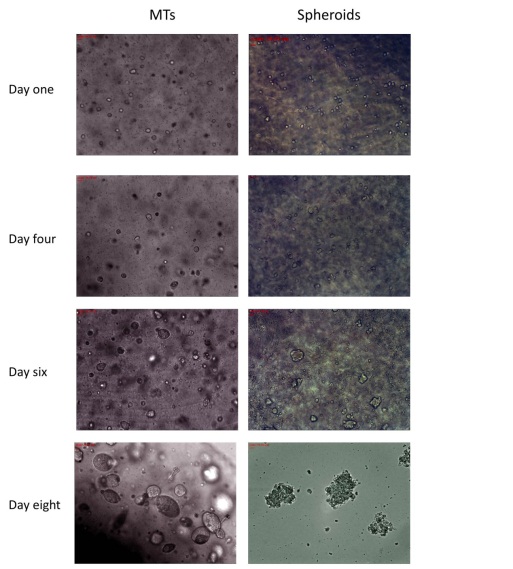
Spheroid formed on Agar surface (left side) and in Alginate beads (right side).
Deducing from the pictures, the morphology of MTs present a circular shape and a tumour-like dense structure while the spheroids were observed to have less dense structures compared with MTs. In addition, MTs show better distributions than spheroids. The difference should significantly contribute to the structures that resemble the ECM of the alginate scaffold. Picture in (Figure 5.7) shows the difference between these two culture models. The cells in alginate beads were capsuled and surrounded with an alginate gel while cells grown on agar surface were left relatively free. The alginate gel provides an environment similar to ECM microenvironment to regulate tumour generations. The cell-cell and cell-ECM interactions strongly enhance tumour aggressiveness (Fischbach et al., 2007, Burdett et al.). Thus, that is the reason for MTs to exhibit a higher level of tumour tissue–like structure with morphological characteristics. Research has shown that alginate beads are better scaffold for 3D cancer cell culture compared with other sources.
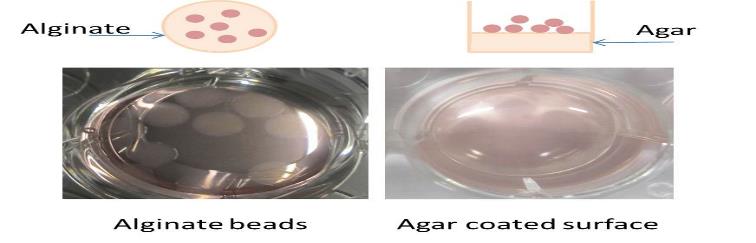
Trypsinizing
(Note: this part of work is in collaboration with Dr. Paul AnandaRaju).
The more tumour-like structures observed according to the morphology of MTs showed significant results. However, to study the characteristics of tumour-like MTs and spheroids, both aggregates were treated with trypsin after which they were incubated for 10min with observations on the resulting morphology made. According to the study, MTs was first released from the alginate beads in the suspension that was used and later treated with trypsin. The figure 5.8 and figure 5.9 compare the morphology of spheroids and MTs before and after the trypsinization process.
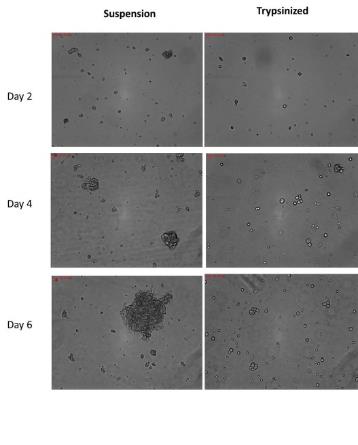
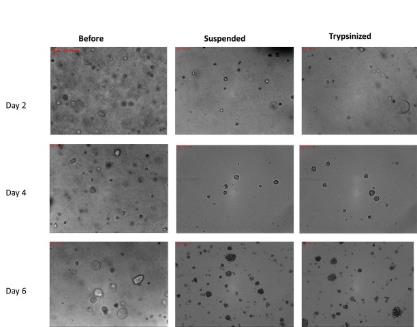
From the results, MTs did not disperse into single cells after they were trypsinized. However, spheroids were dispersed either into single cells at an early culture period or subsequently reduced to smaller sized spheroids after six days of culturing. Spheroids formed after two days cultures were mostly dispersed into single cells after trypsinizing. However, spheroids formed after 4days culture, had almost 80% spheroids were dispersed into single cells while others reduced to smaller sizes (average diameter is 25.89µm). Form the pictures, the edges of the cells could be observed clearly after trypsinizing the spheroids including the rest of the aggregates, indicating that the cells were released from aggregates. On day six, the average diameter of spheroids decreased from 82.36µm to 39.29µm with several single cells prevalent.
Nevertheless, this situation never happened for MTs with the purpose to maintain the circular shape and dense structure after trypsinization. Observations showed MTs formation took longer time than MTs, which remained relative smaller after the two-day culture. However, MTs did not disperse into single sized cells. In addition to that, the MTs formed after a four days culture. A few MTs cells were reduced to smaller sizes but rarely were single cells observed. In addition, for MTs that cultured for six days, MTs were almost not affecting by trypsin and the average diameter of MTs was just 3µm decrease. Compared to the 40-µm reduction, the difference of MTs can be ignored.
That could be due to similar stroma-like microenvironment, which was provided by using the alginate gel, which mimic the ECM in tumor tissues. Through the alginate 3D culture, cells can interact with neighbor cells and surrounding biomaterials similar with extracellular matrix (ECM). And these cell-cell, and cell-ECM interactions establish a 3D communication network that maintains the specificity and homeostasis of the tissues(Kim, 2005).Besides this,tumor stroma play an important role in modulates tumor progression and malignant (Kuperwasser, Nielsen et al., 2008), that 3D culture with alginate gel can help on understanding the process of tumour formation and malignancy as well.
MTs presented in vitro tissue like characteristics that real solid tumour tissue could not disperse into single cells by trypsinizing. Thus, the MTs have more similar structure and characters to tumour-like tissue. In addition, this alginate based 3D cancer model is more suitable for in vitro tissue like 3D cancer culture and related toxicity of the drugs tests.
Viability
After the above study, MTs were believed to have more physiological structures and tissue-like characteristics. Besides that, the viability of the cells viability was an important feature to evaluate the culture model. However, the DLD1 cells were cultured with both alginate and agar scaffolds and the viability were tested after 6 days culture (figure 5.10). A t-test was used to both culture models from the data and the P-value is greater than 0.05. Thus, the viabilities of these two models have no significant differences. The figure5.11 present the viability of MTs cultured in alginate after 4 days with MPM and from the picture, we could find that cells in MTs growth with high viability.
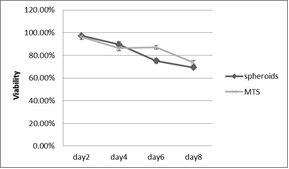
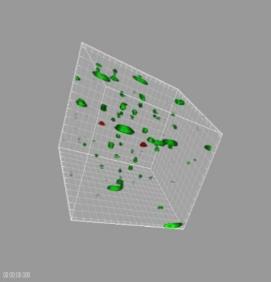
The growth situation in 3D scaffold indicates that alginate scaffold is suitable for the tissue-like growth of DLD1 and NCI/ADR cancer cell lines in vitro. Combining the nice morphology and tissue like characters of MTs, the alginate was believed to provide a much suitable 3D culture model for in vitro tissue like 3D cancer culture and related toxicity of the drugs tests.
Perfusion culture in 3D model
In order to improve the alginate 3D culture model, perfusion functions were introduced into the study. Traditional three-dimensional cultures are mostly static and do not have any diffusion function. The perfusion culture introduced in this study keeps providing a fresh medium and removes expended medium at the same time. In this way, perfusion culture improves the growth of the tumour environment, which is extremely important for tumour progression and many tumour functions (Sordat et al., 2000, Kuperwasser, Takeichi, 1994). Besides this, the fluid can help the medium in diffusing into the tissue to improve cell viability. That is typically to present the advantages of the perfusion 3D culture model compared to traditional static culture models. The proliferation and viability of cells grown in perfused 3D culture models were studied and comparison made with traditional static culture models.
Cell proliferation and viability in perfusion 3D culture
For the DLD1cell line, cells cultured in perfused condition present higher proliferation rate after six days and. Although during the whole culture period, the difference between these two culture approaches is not significant since the p value is bigger than 0.05. However, when DLD1 cultured on monolayer under perfused condition, number of cells is significant lower than cells in static. Compared with this situation, at least we could prove that there is no problem for DLD1 cells to growth in perfused system. In addition, the data of number of cells in perfused culture do shows 2.45×10⁵ higher compared to static after six days culture although this disparity is not significant according to statistic analyse.
For NCI/ADR cell lines, cells in perfused condition present higher proliferate all over the culture period and this difference is significant (p<0.05). This is proved that perfusion culture support the growth of cells in 3D culture and cells are happier when cultured in fresh and table environment this perfused culture provided.
Cell viability of DLD1 cell line was quantified by MTT and trypan blue assay. There is no significant difference(P>0.05) between static and perfusion for 2D culture due to its structure character limitation. Although the perfusion can keep supply nitrite for cells, but this can only affect cells growth on the surface of culture plate after all. On the other hand, for 3D culture, cells cultured in perfusion system showed higher viability and metabolic activity than static especially after day five. The viability of DLD1cells cultured in perfusion on day10 (79.59%) is nearly 30% higher than static culture(50.56%). It is because cells cultured in 3D scaffolds have a 3D structure and culture medium cannot get through into the center of cell aggregates by simply diffusion. In this case, perfusion system improved this situation by the help of fluid flow.
Microtumors formation in perfused culture
Since the perfusion culture can improve the cell viability during the long time cell culture, it is worth to consider that whether the cells cultured in 3D will present different spheroids character during the microtumor formation period. DLD1 cells were seeding in alginate scaffolds as mono-dispersed cells of 1×10⁵ cells/ml on day one and cultured for 6 days. In order to track microtumor formation process, samples were observed by Nikonmicroscope. The pictures showed infigure.5.16are comparison of MTs formed in static and perfusion culture. The total MT number and the average diameter of microtumors were then measured every day using microscope. As in the below figure and table, the total numbers of MTs bigger than 50µm were calculated and the average diameter were listed.
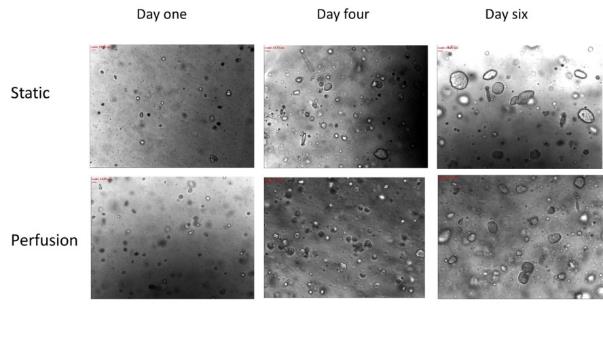
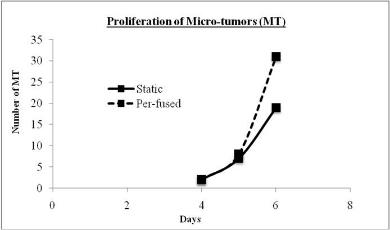
Table 5.2 Assessment of micro-tumour size in alginate scaffolds.
After 6 days culture in alginate beads, both static and perfused cultures show sample numbers of MT. According to data in Table 3.1, microtumors formed in perfusion culture are slightly smaller than static. However, MTs in perfused culture have higher production than static culture, which are 31 and 19 MTs harvested in a 1.2 mm X 1.2mm image at day 6 respectively. The proliferation and good 3D microtumors formation of DLD1 cells demonstrated the reliability of the bioreactor based perfusion culture system for culturing cells in 3D.
Drug treatments
Size selection
Before applied to drug tests, MTs were selected by size and diameter of MTs in the range of 70µm to 100µm were selected (Figure 5.18).From the pictures, MTs after size selections are in the similar size and better distribution.
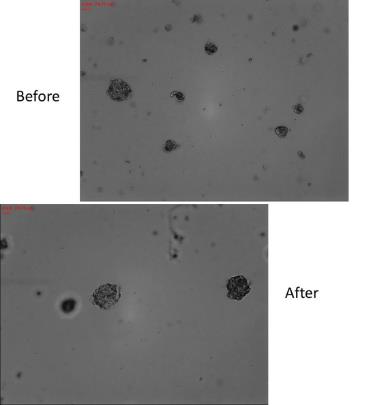
Drug response on cells growth on monolayer and in 3D culture
In this part of study, DLD1 and NCI/ADR cells were cultured on monolayer and in alginate for 3D cultures and related drug tests. The results shows below are the toxicity of the drugs study of paclitaxel and cisplatin when exposed to cells cultured on monolayer and in 3D culture. The comparative data was analyzed by paired t-test on each drug concentration.
Drug response to paclitaxel on cells in 2D and 3D culture
Paclitaxel was employed to both 2D(24-well plate) and 3D (alginate scaffold) cell cultures for three days treatments at two concentrations. The toxicity of the drugs was compared for 2D and 3D culture (Figure 5.19). It was observed that in 2D cell culture, 75.40% cells were inhibited when exposed to 5µg/mL paclitaxel, whereas for 3D culture, the percentage of cell inhibition is 55.9%. In this case, the IC50 value of paclitaxel (drug concentration needed to reduce the growth of cells by half) for 3D culture is 5µg/mL, which is bigger than the IC50 value for 2D culture. Paclitaxel concentration of 10µg/mL results in nearly 20% higher inhibition in DLD1 the growth of cells in 2D cell culture (92.76%) as compared to 72.15% on 3D culture. This can concluded as cells in 3D culture are more resisted to paclitaxel than cells growth in 2D.
Each point represents the mean of the results from three experimental readings. The error bars denote SD (Standard Deviation for n=3).
Each point represents the mean of the results from three experimental readings. The error bars denote SD (Standard Deviation for n=3).
Paclitaxel was employed to NCI/ADR cells in both 2D(24-well plate) and 3D (alginate scaffold) cell cultures for three days treatments at two concentrations as well. The toxicity of the drugs was compared for 2D and 3D culture (Figure 5.20) in the same way with DLD1 cells. It was observed that, two paclitaxel concentrations are all results in almost 10% higher inhibition in NCI/ADR the growth of cells in 2D cell culture as compared to 3D culture.
Drug response to cisplatin on cells in 2D and 3D culture
Cisplatin was employed to both 2D (24-well plate) and 3D (alginate scaffold) cell cultures for three days treatments at three concentrations. A comparative study of toxicity of the drugs was done for the 2D and 3D culture (Figure 5.21). Observations showed that in 2D cell culture, 61.21% cells were inhibited when exposed to 0.5µg/mL cisplatin, whereas for 3D culture, the percentage of cell inhibition is 51.07%. In this case, the IC50 value of cisplatin (drug concentration needed to reduce the growth of cells by half) for 3D culture is 0.5µg/mL, which is almost twice bigger than the IC50 value for 2D culture (0.3µg/mL). Cisplatin concentration of 1µg/mL results in 93.55% high inhibition ofDLD1 the growth of cells in 2D cell culture that almost killed all of the cells in culture, as compared to 20% lower inhibition (73.43%)in 3D culture. The drug efficiency of cisplatinto DLD1 cells is much higher in 2D compared to 3D culture.
Each point represents the mean of the results from three experimental readings. The error bars denote SD (Standard Deviation for n=3).
Three different concentrations of cisplatin were employed to NCI/ADR cells as well. The toxicity of the drugs was compared for 2D (24 well plates) and 3D (alginate beads) culture (Figure 5.22). It was observed that, cisplatin concentrations of 0.5µg/mL and 1µg/mL are results in almost 20% higher inhibition in NCI/ADR the growth of cells in 2D cell culture as compared to 3D culture. The toxicity of the drugs difference is smaller at concentration of 0.05µg/mL, 5% lower inhibition in 3D culture.
Each point represents the mean of the results from three experimental readings. The error bars denote SD (Standard Deviation for n=3).
Compared to cells cultured in 2D culture, cells growth in 3D culture present lower drug responds (% Inhibition) for both drug and both cell lines. Higher drug concentrations were required in 3D culture to match the same therapeutic effect. And this difference is significant due to p value is smaller than 0.05. This is because the 2D culture is too simple that cells in culture are hardly mimic the heterogeneous characters and the most important reason is the lack of 3D structures. As there is a truth that the drug dose reserved from 2D drug tests is always insufficient to clinical treatments. These results are supporting the fact that 3D culture is a better model for cytotoxic evaluation of anti-cancer drugs in vitro.
Drug tests on spheroids and MTs
The spheroid formed on the agar surface is one of the most popular 3D culture models. In the previous part, the difference of characters between spheroids and MTs have been studied which lead us to wonder whether this difference will affect the drug responds. In this case, the MTs formed in alginate beads were compared their drug responses to spheroids in this part of study. Both spheroids and MTs were cultured 6 days before sample collection. After size selection that spheroids and MTs were choose in the range from 70µm to 100µm, spheroids and MTs were transferred into culture plate and exposed to different concentrations of paclitaxel and cisplatin. The drug responses to both anti-cancer drugs were show in the following figures.
Drug responds to paclitaxel on spheroids and MTs
Paclitaxel was employed to both spheroids and MTs for three days treatments at two concentrations and the toxicity of the drugs responds was compared (Figure 5.23). It was observed that, there are almost 5% more DLD1 cells were inhibited for spheroids as compared to MTs when treated with paclitaxel at two concentrations. And this difference is significant at both drug concentrations. For spheroids and MTs formed with NCI/ADR cells, the difference is slightly less than which formed with DLD1 cells. This could because DLD1 cells are more like to assemble and the formations with DLD1 cells have bigger size and denser structure as compared to formations with NCI/ADR cells. In this case, we could assume that the formation of DLD1 cells is relatively closer to 3D structure than formation of NCI/ADR which made DLD1 formations are more sensitive to the structure changes. As we mentioned in the previous part, the spheroids is less dense than MTs and the MTs have the more complex structures. The higher cell viability against agents of MTs may due to the denser tumor-like structure and protection of stroma-like tissues, which are formed during the 3D culture. The drug responds shows here present the MTs are more resistant to paclitaxel which support the previous point.
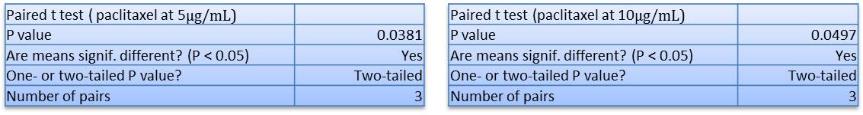
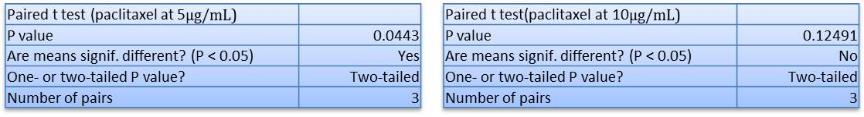
Drug responds to cisplatin on spheroids and MTs
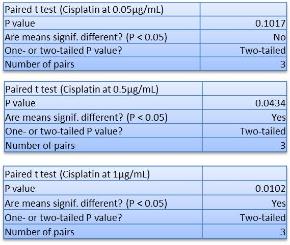
The spheroids and microtomes were collected at day 6. The size of samples is limited from 70µm to 100µm use cell seizer. After tissue selection, spheroids and microtumor are re-seeded in the bioreactor environment and exposed to cisplatin for static drug, tests.Cisplatin was employed at three concentrations and the toxicity of the drugs responds was compared between spheroids and MTs (Figure 5.25). It was observed that, the toxicity of the drugs of cisplatin to spheroids are higher than responds on MTs. In addition, with the increase of drug concentrations, this difference is greater. Cisplatin concentration of 1µg/mL results in 10% higher inhibition in spheroids (82.33%for DLD1,84.75%for NCI/ADR) as compared to MTs(73.43%for DLD1,76.81%for NCI/ADR). From the tables of p-values, for the lowest concentration for both cell lines the differences is non-significant but for the other two higher concentrations are significant.
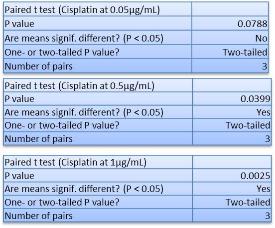
Spheroids and MTs are all 3D structure models and even though, the toxicity of the drugs is different between these two models. Cells are quite sensitive to the environment have been provided and there are many reasons due to the discrepancy of drug responses to the human body. It is important to provide a model for drug tests if we want to shorter the distance between the 3D models to real human body. The drug responses of spheroids are higher than MTs and drug responds of cells in 2D culture are higher than MTs as well. We could assume that the drug responds of spheroids are relatively closer to 2D than MTs model, which is better present the 3D structure and characters of tissue-like formation in vitro.
Drug tests in3D perfusion models
The traditional 3D models lack the functions to help medium diffusion into the inside of tumor-like tissues. The help of perfused culture pumps the medium with more nutrients pumped into the culture devices, which not only provide more fresh culture environment but also promote the growth of cells. Due to these reasons, we assume that there should be a difference between cells in 3D static and perfusion culture when applying agents. Paclitaxel and cisplatin were employed to MTs in static and perfusion culture respectively for three days. The toxicity of the drugs was observed by MTT assay and results were compared between these two culture methods.
Drug response to paclitaxel on MTs in static and perfused culture
The MTs were collected after 6 days culture and MTs in the size range from 70µm to 100µm were selected for drug tests study. Two concentrations of paclitaxel were used for drug treatment and last for three days. The toxicity of the drugs to MTs in static and perfusion 3D culture were observed by MTT assay and compared.
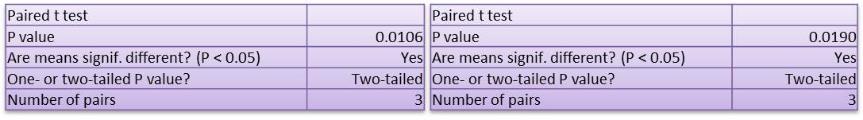
It was observed that for MTs formed with DLD1 cells in static culture, 55.95% cells were inhibited when exposed to 5µg/mL paclitaxel, whereas for perfusion culture, the percentage of cell inhibition is 42.33%. However, paclitaxel concentration of 10µg/mL results in opposite inhibition in DLD1 the growth of cells in static culture (72.15%) as compared to 73.59%in perfusion culture. From the tables of p-values, the difference is significant for both two concentrations. Thus, perfusion cultures do effect on cell activity and the responses to anti-cancer drug. At the lower concentrations, perfusion culture gives cells higher proliferation rate, which made DLD1 cells formed denser structure. The high production and protection of dense formation lead to lower drug responses to paclitaxel. However, the difference of proliferation between static and perfusion is not much that when exposed to high drug concentrations, this advantage is incapacity. The toxicity of the drugs on cells in perfusion culture is greater than cells in static culture at drug concentration of 10µg/mL.
It has been report that cells in 3D culture present large decrease in both oxygen and glucose consumption(Freyer and Sutherland, 1986). And this decrease is results from the increased fraction of quiescent cells and cooperative cellular biochemical interactions that modulate energy metabolism during the growth of cells (Sutherland, 1988).The increase of quiescent cells in due to the in sufficient nutrients and oxygen supply.Thus, MTs in static culture have more non-proliferating cells than MTs in perfusion culture. As the mechanism of paclitaxel is killing cells through inhibiting the mitosis of cells, paclitaxel mainly targets on cells in proliferation phase. In this case, the more cells in proliferation phase, more cells were inhibited by paclitaxel.
Besides this, non-proliferating cells have proved more resistant to paclitaxel than cells grown in phases (Riou et al., 1992, Liebmann et al., 1993). Thus, cells in static culture were more resistant to drugs than cells in perfusion culture. This explained the reason for the higher toxicity of the drugs on DLD1 cells in perfusion culture than static culture.
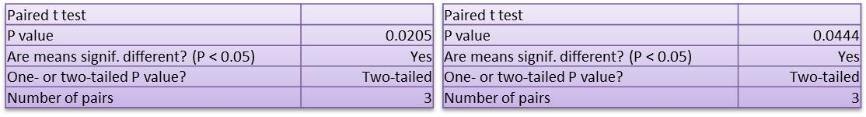
For MTs formed with NCI/ADR cells, drug responses of cells in perfusion culture are higher than cells in static culture at two concentrations. The reason is same with MTs exposed to 10µg/mL paclitaxel. The more cells shift to proliferation phase; more cells were inhibited by paclitaxel during the drug treatments. This results support the point that cells in perfusion culture have higher proliferation rate and perfusion culture do affect the drug tests results.
Drug response to cisplatin on MTs in static and perfused culture
Three concentrations of cisplatin were applied to MTs in the same way with drug treatments with paclitaxel. The toxicity of the drugs to MTs was compared between static and perfusion culture. From the data of toxicity of the drugs tests on MTs formed with DLD1 cells, MTs’ drug response to cisplatin on cells in static is different with cells in perfusion culture. The drug efficiency was 10% significant higher for MTs in static culture as compared to MTs in perfusion culture. Cisplatin concentration at 0.05µg/mL, results in similar toxicity to MTs in static (24.92%) and perfusion (26.73%) culture and the difference is non-significant. The lower toxicity of the drugs on MTs in perfusion culture is due to two reasons. First, Cells in perfusion culture have higher proliferation rate and higher viability due to the sufficient nutrients and oxygen supplement, which provide cells higher energy to resist agent effect. Second, Perfusion culture gets rid of cells dead because of the insufficient nutrients from cells dead from toxicity of the drugs. In this case, perfusion culture dressed the problem that cells in static culture magnified the drug efficiency.
Finally yet importantly, pHe in perfusion culture is higher than static culture which gives cells in static culture more ability to resist to drugs. Thus, the number of dead cells in static culture is less than cells in perfusion culture.
Although the difference between drug efffeciency on MTs formed with NCI/ADR have the similar treand with MTs formed with DLD1, that the toxicity of the drugs on MTS in static culture is higher than in perfusion culture. But for the two higher concentrations ( 0.5µg/mL, 1µg/mL ),the cisplatin resluts in neally 15% higher toxicity on MTs in static culture compared to MTs in perfusion culture.The differenceof growth inhibition between these two culture models on MTs formed with DLD1 cells is just around 10% for two higher concentrations.Thus, the difference of MTs formed with NCI/ADR cells is bigger than difference of MTs from DLD1 cells.As we mentioned before, the perfusion culture promote the cells growth owing to the improvemrnts of nutrient and oxygen diffusion. DLD1 cells are more pretend to aggregate than NCI/ADR cell lines and can form more dense tissue-like aggragations which lead to the less difference effect by perfused culure.
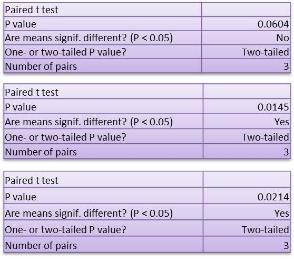
Besides this, when MTs exposed to paclitaxel, MTs in perfusion culture present higher percent ofcell dead than MTs in static culture. But when exposed to Cisplatin, MTs in perfusion culture were observed have lower toxicity of the drugs responses. This difference may due to the different of drug mechanisms of action. Cisplatin kills cells through inducing cells to apoptosis and paclitaxel kill cells by inhibited cell proliferation. Perfusion culture promotes cell proliferation and results in higher percent of cell death by paclitaxel. However, for cisplatin which is not affect the cell proliferation cycle, cells in perfusion culture present higher cell viability due to the higher production of viable cells and higher resist to drugs.
In conclusion, perfusion culture affects the toxicity of the drugs and MTs in static culture present higher the growth of cells inhibition as compared to MTs in perfusion culture. According to the p-value listed in the tables, the difference is significant (p<0.05).The cells are quite sensitive to the environment that even slight change will affect the growth of cells situation. As mentioned previous, the cells growth well and have nice viability in perfusion culture. The perfusion culture provides in vivo-like steady and homogenous environment by keep supplying nutrients and removing the waste medium. After the toxicity of the drugs study, it has been proved that the fresh environment provided by perfused culture are not only affect the growth of cells but also effect the drug response.
Tumour acidity and cytotoxicity of chemotherapeutic agents
The microelectrode assay showed human tumors are acidic (Raghunand et al., 1999c). On the other hand, in tumors, the extracellular pH (pHe) was shown to be acidic while the intracellular pH (pHi) was shown to vary between neutral to alkaline (Raghunand et al., 1999a, Ojugo et al., 1999, Raghunand and Gillies, 2000), implying a pH gradient was between the extracellular environment and the cell cytoplasm (Simon et al., 1994). This is different with normal tissues, in which the alkaline outside pH gradients is exited(Stubbs et al., 1994).The reversed pH gradients of tumors may affect drugs entry into cells(Raghunand and Gillies, 2000, De Milito and Fais, 2005).The effectiveness of extracellular PH on chemotherapy can be discussed in two types.
Tumor acidity and weak acids cytotoxicity
Firstly, for chemotherapeutic drugs, which are weak acid, the low pHe will promote the uptake of weak acid chemotherapeutic agents into relatively neutral space and hence improve the chemotherapy effectiveness. According to Brent P. Mahoney‘s work, the weak acid drugs present consistently low IC50 at low pHe that proved this point. The cisplatin is weak acid chemotherapeutic drug and the uptake of cisplatin has also been proved markedly increased in low pHe (Laurencot and Kennedy, 1995).
In the previous part of this thesis, the cytotoxicity of cisplatin has been compared on cells in static and perfusion culture. The results indicated that the cells in 3D culture dead more in static than perfusion culture for two cell lines. In order to prove the drug sensitivity connections with pHe, the DLD1 and NCI/ADR were cultured in static and perfusion for three days. During the three days culture, the pHe of static and perfusion culture medium were measured and listed in Table 5.3. After three days drug exposure, the cytotoxicity was measured by MTT assay in the same way with previous approach (Figure5.31 and Figure 5.32).
Table 5.3 pHe of culture medium.
From the table 5.3, the pHe of culture medium in perfusion model is higher than static which means static model present more acid tumor environments. And the more acid environment promotes the uptake of cisplatin and trap the drugs in the intracellular compartments due to the relatively impermeability for charged species. And hence results in higher cell inhibition in static culture. Cells in perfusion culture suffered in fewer drugs and have higher proliferation rate themselves made them have a higher cell survival percent as compared with cells in static culture.
Tumor acidity and chemo-resistance
Resistance to anti-cancer agents leads to the failure of chemotherapy (Gottesman and Pastan, 1993, Nielsen and Skovsgaard, 1992). The reasons results in drug resistance are not yet entirely know but can be concluded into two main mechanisms, biochemical and physiological mechanisms(Mahoney et al., 2003). In classical biochemical multidrug resistance mechanism, cells over express resistance associate proteins, belonging to the ATP binding cassette (ABC) transporters family (Scheper et al., 1993)(Cole and Deeley, 1998, Doyle et al., 1998, Cole et al., 1992, Iessi, 2008). The physiological resistance is the resistance that the mechanism is because of the change of the tumor environment. Some researchers have already found the effect of tumor acidity on resistance to chemotherapeutic agents (Raghunand et al., 1999c, Arnold et al., 1958). And according to Brent P. Mahoney’s research, the importance of physiological resistance due to PH changes is comparable to biochemical resistance which is caused by overexpression of drug efflux pumps(Mahoney et al., 2003).
For chemotherapeutic drug, which is weak bases, low pHe can reduce the effectiveness and thus resistance to drugs. These types of chemotherapeutic drugs are intended to concentrate in the intracellular acidic compartments. The low pHe prevent the drugs to reach their intracellular targets and therefore reduce the uptake of weakly basic drugs. In this case, acid tumor environment reduce the effectiveness of chemotherapy (Ohtsubo et al., 2001, Newell et al., 1992).
From our research, paclitaxel did not show any difference because of pH change and this is because it is non-ionizable character. In addition, other researchers observe similar phenomenon as well that the relation between paclitaxel sensitivity and pH is insignificant (Vukovic and Tannock, 1997, Mahoney et al., 2003).
Many chemotherapeutic drugs are ionizable and weak either acid or weak bases. The drug sensitivity of these agents is directly affected by pH. There is already researches show that weak acids had lower IC50 at lower pHe and weak bases had lower IC50 at higher pHe.No matter the weak acids or weak bases, the ionizable chemotherapeutic agents are affected by the pH environment. In addition, the change of tumor environment can reduce the drug effectiveness and became the reason of chemo-resistance. In conclusion, most of the cytotoxicity of chemotherapeutic drugs is affected by pH of tumor environment. In this case, the pH of tumor environment plays an important role in the research about the tumor acidity related chemo resistance. In addition, the perfusion culture can provide different pH by modulate the ratio of the fresh culture medium by changing the diffusion rate.
On the other hand, there is some researchers thought the tumor acidity represent key factors in tumor progression, metastasis(Iessi, 2008). In this case, the pH of tumor environment regulates many tumor functions (Glunde et al., 2003, Lugini et al., 2003). Perfusion culture can regulate the pH during the 3D cell culture or during the drug treatments. The 3D perfusion cancer cell culture model designed in this thesis can provide a flexible tumor environment. That was typically to a better understanding of the relationship between pHe and tumor functions correlation to the effects of the malignancy. In addition to that, it provided a basis to evaluate the effectiveness of chemotherapy against the tumors.
Summary
As in vivo tissues and organs are three-dimension, cells cultured in 2D lose their 3D characters such as morphology, gene expression(Yamada and Cukierman, 2007b). It is also been mentioned that the growth of cells on monolayer may growth faster than itself. Through the 3D culture models, cells can interact with neighbor cells and surrounding biomaterials similar with extracellular matrix (ECM). And these cell-cell, and cell-ECM interactions establish a 3D communication network that maintains the specificity and homeostasis of the tissues(Kim, 2005). It provides the deeper insight into the mechanisms and expression of malignant. From the firstly utilized in biomedical research in the early decades of 20th century, the three dimensional cultures have been well accepted these years that it span the gap between the monolayer and real animal tests(Pampaloni et al., 2007). Thus, three-dimensional cultures have been used in wide range of cell biology studies. This is also applied in drug tests and there is always a different toxicity of the drugs between 3D and 2D culture (Dhiman et al., 2005). This discrepancy may provide wrong information of in vivo responses (Birgersdotter et al., 2005, Zhang, 2008).And the 3D culture model can also be used to evaluate the anti-cancer drug efficacy regard to cancer cell invasion and metastasis. Thus, 3D culture model is a better in vitro model for anti-cancer drug tests study.
In this study, the alginate based 3D culture was developed and the DLD1 and NCI/ADR cells were successfully cultured in alginate-based 3D culture. Alginate is well accepted due to it is simply to use and the hydrogel character which make it a good artificial extracellular matrix material. High porosity of alginate allows high diffusion rate of nutrient, which cells need for growth (Seo et al., 2006). The cell proliferation rate and cell viability presented that alginate is suitable for 3D cell culture. The alginate based 3D model was compared with agar-based model and MTs formed from alginate beads were compared with spheroids as well. MTs formed from alginate beads have better distribution, more dense and complex tumor-like structure. Spheroids were dispersed into single cells or at least reduced to smaller size spheroids after trypsinization, but MTs stays aggregation and didn’t release single cells from MTs. The real solid tumor are not dispersed into single cells after trypsinized which proved that MTs have more tissue-like characters than spheroids. The difference of structure leads to different responds to drugs between spheroids and MTs. The drugs provided higher toxicity responses on spheroids than MTs. The drug toxic response of spheroids is relatively closer to the responses of cells on monolayer. On the other hand, as compared to spheroids, the drug response of MTs is more similar to the tumor tissue. In conclusion, the results are supporting the fact that 3D cancer model with alginate scaffold is a better model for cancer cells culture and cytotoxic evaluation of anti-cancer drugs in vitro.
Many cell lines have been successfully cultured in various three dimensional models in vitro. However, Current 3D culture has the limitation of nutrition and oxygenation perfusion, which cannot be achieved by simple diffusion, same with this alginate based model. 3D dynamic culture model, as a simulation of vascular system, can significantly improve the cell viability in vivo. By the increase of tissue thickness, this limitation will be increasing important(Yamada and Cukierman, 2007b) especially for the drug treatments, because the cell death caused by nutrient restriction will magnify drug efficiency. Certainly, blood vessels involve not only nutrient and oxygen transport, but also signaling and regulatory pathways that are not yet fully elucidated (Levenberg, 2005). That is why many researches are study on the area of formatting engineering blood vessels with stem cells or endothelial cells to fully understand of the process. In order to dress this problem, perfusion culture system was introduced into the alginate-based model and is believed to provide stable and physiological environment by continually supplying culture medium and removing waste medium. In this study, the comparison of static culture and perfusion culture is studied on both 2D and 3D culture.
According to the results, in perfusion culture, cells growth well and have higher viability and metabolic activity than static culture. Micro tumors formed in perfusion 3D culture are slightly smaller than static, but MTs in perfused culture have higher production number and better distribution than static culture. The proliferation and good 3D micro tumors formation of DLD1 cells demonstrated the reliability of the bioreactor based perfusion culture system for culturing cells in 3D. For cytotoxicity assay, cells show significant different toxic responses under perfusion and static culture. Cells cultured in perfusion system were more sensitive to drug dose change and showed significant different growth inhibition, which indicates the importance of providing suitable system to tests cellular responses to drugs.
Human tumours have been believed acidic according to the microelectrode measurement of tumor pH (Wike-Hooley et al., 1984). The tumour environment, which is hypoxia, low blood supply and acidic, is key factors of tumor progression, metastasis and response to therapies (Iessi, 2008). As one of the main features of tumor microenvironments, acidity plays an important role in tumor functions.Perfusion culture present different pHe with static culture and this affect the effectiveness of chemotherapeutic agents. The relation between tumor acidity and cytotoxicity of cisplatin was proved. The tumor acidity plays important role in tumor functions not only on drug response but also the functions correlated in malignancy. Perfusion culture can provide different pHe during the culture by modulate diffusion rate which is helpful on understanding the tumor progression and drug resistance. In conclusion, the alginate based 3D perfusion culture model, which designed in this thesis, can be used to study the relation between tumor acidity and chemoresistance and the other tumor functions.
There are two main limitations to get accurate toxicity of the drugs tests results, the tumor tissues used for tests and microenvironment. The MTs formed from alginate 3D perfusion culture model have the characters and similar drug responds to 3D in vivo tumor tissues. The stable and physiological environment, which due to the perfusion culture, provided a better surround tumor microenvironment for drug tests without distribution of other molecule changes. As pHe is related to tumor progression and drug resistance, 3D perfusion culture, which can modulate pHe during the culture period, is quite meaningful for better understanding the process of tumor formation and chemo-resistance. In conclusion, the alginate 3D perfusion culture provided a better approach for cancer cell culture, micro tumor formation, and tests cytotoxicity effect of anticancer drug.
Drug Tests on Human Tumor Tissue
Introduction
No matter the animal-based in vivo drug toxic assay or in vitro agents tests models based on cancer cell cultures, the discrepancy is always there. Although the drug tests with patient’s own tumor tissue is believed the best way to predict the efficiency of chemotherapy but this approach is unpractical. Not only because of the long time, these tests will take, but also this method could only apply after surgery and is unhelpful for the pre-chemotherapy treatments. Out of question that the drugs can be tested on other patients’ tumor tissues that has similar stage of cancer and the results from this study are valuable. However, it is hard to get enough samples that from the same stage of cancer and the discrepancy of individual person cannot be ignored. This is why the pre-chemotherapy tests is mostly based on 2D cell culture. In some experience hospital, the chemo-sensitivity tests was applied for individualizing patient therapy by tests agents on patients’ own cancer cells. This kind of tests can assist in individualizing cancer therapy by providing information about the likely response of an individual patient’s tumor to proposed therapy in order to select optimal chemotherapy agents.
But back to the problem we mentioned all the time, this cell culture based pretests is helpful on select the right agents but fail on accurate tell the efficiency drug dose on further therapy. This is why this study excited that trying to address this problem by develop an in vitro 3D cancer culture model. The study results present in previous chapters have more or less proved the alginate 3D perfusion cancer culture models is a better model to do tissue-like 3D cell culture and related toxic tests. In order to support and further prove this point, the paclitaxel and cisplatin were introduced to real human solid tumor tissues. As the cell lines employed in this study are DLD1 and NCI/ADR, which are human colon and breast cancer cell lines. The human tumor tissues used in this part of study are human breast cancer and colon cancer tumors in the same stage. In this case, a brief introduction of these two cancers and the standard approach to classify different stages of cancer are given below.
In order to classify the situations of cancer patients, doctors use a staging system to determine how far the cancer has gone. Usually, there are two main stages which are early stage and later or advanced stage. Early stage includes stage 0, stage I, stage II and some stage III, where later or advance stage includes other stage III and stage IV. The most used staging system is TNM system where T stands for size of tumor, N stands for involvement of lymph node and M stands for whether it has metastasis.
For breast cancer, stage o is used to describe the non-invasive breast cancers, stage Idescribe invasive breast cancer (up to 2 centimeters) without lymph nodes involvement. Stage II has two sub-groups. The first group describes invasive breast cancer less than 2 centimeter but has spread to axillary lymph nodes, and second group stands for invasive cancer tumor in the size range from 2 to 5 centimeters and has spread to axillary lymph nodes or tumors larger than 5 centimeters but has not spread to the axillary lymph nodes. Stage III divided into three sub categories that describes either invasive cancer larger than 5 centimeter, has spread to lymph nodes and clumped together or sticking to other structures, or the invasive cancer in any size but has spread to axillary lymph nodes or to lymph nodes near the breastbone. Stage IV describes the metastatic cancer that has spread beyond the breast and nearby lymph nodes. Paclitaxel is used widely on advanced stage breast cancer. In addition, in order to get more tumor tissues from same patients, the tumor tissue used for this study is the tumors in stage III.
For colorectal cancer, similar stage classify was defined that stage 0 describes cancer have not grown beyond the inner of the colon where stage I stands for cancers have grown through several layers of the colon but have not spread outside the colon wall. Stage II describes cancers have extend into nearby tissue but have not yet spread to the lymph nodes. If the cancer has spread to nearby lymph nodes then this cancer is at least in stage III. However, cancer in stage III has not yet spread to other parts of the body. Finally, cancers in stage IV have spread from colon to distant organs, which are the metastases cancer. In order to get enough samples from same patients to reduce the discrepancy of individual patient, the tumors chosen for this drug tests study are in stage III.
After the toxicity of the drugs study with real human solid tumor tissues, the results of drug response were compared with the results from previous work in 2D and 3D models. The data was analyzed with t test to determine the significant difference between these different test models.
Materials and methods
Human solid tumour tissues preparation
The human solid tumor tissues were supplied by Tianjin medical university cancer institute and hospital for the study. Because the cell lines employed in this study are DLD1 and NCI/ADR cell lines, which are human colorectal and breast cancer cell lines. The human colon tumor and breast tumor tissues were used for this part of work.
Human breast tumor tissues preparation
Human breast tissues were removed from patients by surgical treatments and delivered to sampling groups to get the basic information about tumor tissues including the weight, size, and the position to focus on. The Figure 6.1 shows a fresh breast tissue which has just removed from patient. Then the tissue was washed with water firstly to remove blood and cut into slides. From the transverse section view and the touch feeling, the tumor tissues were sought out from fat lobes or other breast tissues. Some patients’ breast tissues have only one tumor and some others have more than one depend on the stage and individual situations. Several small pieces of the tumor tissues were firstly cut off for cancer biopsy, and the rest of tissues were transferred to laboratory for this toxicity of the drugs study. The procedure is same for the colon cancer tumor tissues preparation and all the tissues used in this study are most from patient in stage III.
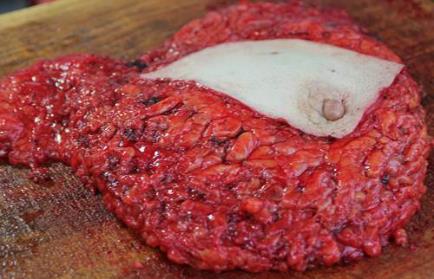
The solid tumor tissues were cut into small pieces, which are nearly same size and normalized by mass weigh that the number of cells was present as cells per mg. Every piece, of which weight is around 0.016g, was weight before introduced into experiments. Samples were washed three times with 0.9% NaCl with 1% Antibiotic for 5min each time and changed for HBSS (hank’s balance salt solution) to prevent water loose before transferred to culture plate and bioreactors. The figure 6.2 shows the tissue samples seeding in the wells of culture plate and bioreactors, one piece for each well, for further static and perfusion culture. Tissues were applied for one day culture with 1mL fresh RPMI1640 with 10% FBS and 1% AB before introducing agents.
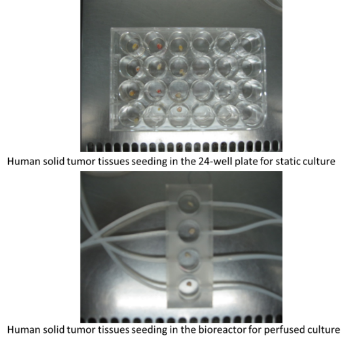
Human colon tumor tissues preparation
Human colon tissues removed from the patients through surgical treatments and the tissues removed from the tumors by the research pathology group members. The tumor tissues were cut into small pieces and normalized by weights that the number of cells is present as cells per mg. Because the tissues from this part have more bacteria, the tissues were washed by 0.9% NaCl with 1% AB five times and lasted for 5mins for each wash. After sterilize, the following preparation work is same with the breast tumor tissues preparation. When samples are ready, the bioreactors were transferred to perfusion culture system (figure 6.3) for culture and drug tests study. In this desk incubator, a temperature sensor and water flume was built in in order to keep the humid environment and proper temperature during the culture period.
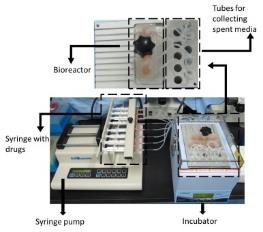
Drug tests on human solid tumour
After a one-day pre-culture, the culture medium was removed and changed with a fresh culture medium by applying three different concentrations of Paclitaxel and Cisplatin. The drug concentrations used in this part of study are exactly same with the previous 3D drug tests research. Drug treatments were lasted for three days for both static and perfusion culture. One day further culture was applied after remove the medium with anti-cancer drugs. Then, the toxicity of the drugs was measured by MTT assay. Because the tumor tissue is very dense, MTT solution cannot meet all the cells in the tissue. In order to get much accurate MTT results, the tumor tissues were collected from each well and digested into single cells with 10% enzyme in HBSS before applied into the MTT solution. The biopsy results show the percentage of tumor cells in the tissue. Combine these data and weight of tissues, the MTT results were normalized and calculated. The Following picture generally summarized the whole drug tests procedure.
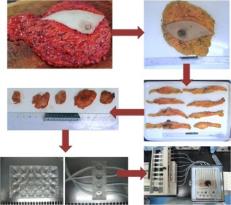
Statistic analysis
All the data is presented as the mean ± and the standard deviation from at least three separate experiments. The data obtained from the studies were analysed with a two-tailed Student’s t-test with p < 0.05 regarded as a significant value.
Results and Discussions
Drug tests in static and perfusion culture
Toxicity of the drugs study on breast cancer tissue
In the above study, breast cancer tissues were cut into small sized pieces and seeded using different culture plates based on bioreactors for the static and perfusion culturing techniques. After a one-day pre culture, paclitaxel and cisplatin were employed to study the toxicity of the drugs. Two concentrations of paclitaxel and three concentrations of cisplatin were exposed to breast tumor tissues for three days. Since there are some cells still alive and inhibited to proliferate, one-day further culture was allowed to give these cells time to terminate their lives. Observations on the toxic effects of the drugs were made based on the MTT assay as mentioned in the technique. The different drug response rates between tumors in static and perfusion culture were compared and analyzed with t tests.
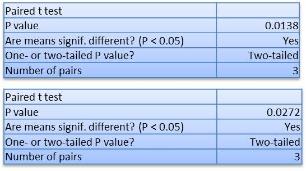
It was observed that in static culture with a 62.11% concentration, cells were inhibited when exposed to 10µg/mL paclitaxel, whereas for perfusion culture, the percentage of cell inhibition was 60.15%. The concentration of Paclitaxel was made 5µg/mL resulting in 39.04% inhibitions for tumors in static culture compared with 32.49% inhibitions for tumor tissues in perfusion culture. A significant 7% difference was observed between tumors in the static and perfusion culture. However, for 3D cell culture, the difference between these two models was more than 10% with 7% for real tumor tissues. This is because a real solid tumor is quite dense when one touches the tissues. In addition to that, the tumor tissue could be easily distinguished by the much harder feeling than the normal tissue when touched with the finger. Thus, the difference due to diffusion is limited and results in less difference between static and perfusion culture.
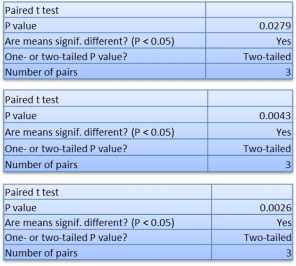
A similar trend observation for the treatment using cisplatin with the efficiency of the drug in static culture in static was larger than tumors in perfusion culture. There was an only 3% difference observation at 0.05µg/mL, even when the concentration was raised to (1µg/mL), the difference was only 10%. Thus reinforcing the same reason mentioned above with the actual human solid tumor giving a hard and dense structure. The differences were observed to increase the drug concentrations from the above tests.
Toxicity of the drugs study on colon cancer tissue
A colon cancer tissue used in the study was cut into small pieces and sterilized before being seeded into culture plates in bioreactors for static and perfusion culture. After a one-day pre culture, paclitaxel and cisplatin were used to study the toxicity of the drugs. Two concentrations of paclitaxel and three concentrations of cisplatin were exposed to breast tumor tissues for three days. Since there were some cells still alive but inhibited to proliferate, a one-day further culture was applied to give these cells times to terminate their lives. The toxicity of the drugs was then observed by MTT assay in the way mentioned in the method. The different effects of the drug responses between tumors in static and perfusion culture were analyzed and compared on a t test.
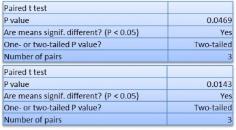
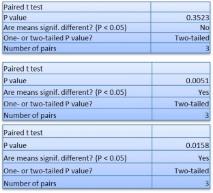
The difference in the toxicity of the drugs between tumors in static and perfusion culture were observed for the two drugs. For paclitaxel, there was nearly 6% difference for both concentrations. For cisplatin, concentrations at 0.05µg/mL resulted in 1.7% drug response difference between tumors in static, perfusion culture, and 11% difference for concentrations at 1µg/mL. However, for human solid tumors, the differences in the toxicity of the drugs for tumors in static and perfusion culture are less than cancer cells in 3D structure. The significance in the difference observed, strongly supported the fact that perfusion culture influences the response of the drug.
Comparison of chemo-cytotoxicity between different culture models
The purpose of this study is to build a physiological 3D cancer model for anti-cancer drug tests and related tumor research. In this study, four culture models were employed to study the toxicity of the drugs, which are monolayer, 3D spheroids, 3D MTs and real human tumor tissues. The four models used for the cancer cell culture and anti-cancer drug tests under static and perfusion conditions were constituted from the above list. In conclusion, the cells showed different drug responses in the study mainly due the effects of a group of four parameters which included the culture model, the culture environment, the agent used in the study, and the cell lines (table 6.1).
Different drug response due to different culture environment
The different toxicity of the drugs caused by different culture environments, prevalent in static and perfusion culture were discussed in the previous chapter. In conclusion, the following table lists different toxicity effect values for given concentrations under static and perfusion culture environments. A comparative study of the differences in the toxicity of the drugs under static and perfusion conditions, led to the following conclusions.
Firstly, there is no significant difference of toxicity of the drugs between cells in static and perfusion culture in 2D culture. This is due to the structure limitation of monolayer culture that the dynamic culture can only affect the cells growth on the surface.
Secondly, the drug responses to paclitaxel and cisplatin in static culture and perfusion culture have significant differences. For cisplatin, the toxicity of the drugs on cells in static culture is greater than cells in perfusion culture. The low toxicity observed on the activity of drugs on MTs in perfusion culture is due to three reasons. These include higher proliferation rates and the higher viability of cells in perfusion culture. On the other hand, the exclusion of dead cells because of insufficient nutrients from dead cells due to the toxicity of the drugs, and the lower chemo-resistance to agents caused by relatively higher pHe microenvironment was comparable to static culture. For paclitaxel, toxicity of the drugs on cells in static culture is less than cells in perfusion culture. As the mechanism of paclitaxel in killing cells by inhibiting the mitosis of cells, paclitaxel mainly targets on cells in proliferation phase and cells in static culture have more cells in proliferation phase. In this case, the more cells in proliferation phase, more cells were inhibited by paclitaxel. In addition, the uptake of paclitaxel is not affect by pHe, thus the different pHe values in static and perfusion culture had effects on the toxicity response of the drugs.
Finally, for the real tumor tissues, the toxicity of the drugs of both agents on cells in static culture is greater than cells in perfusion culture. The reason of this is similar to the toxicity of the drugs response of cells to cisplatin, but the differences of real tumors are smaller than cells in 3D culture. This is because cells in 3D culture have different drug response result due to different drug uptakes with different structural and growth status due to the differences in nutrient diffusion.
However, the real tumors pieces cut from same piece of tumor tissue are almost have similar structures and cell survival rates. It is also proved the perfusion culture impact on the growth of cells and MTs formation process.
From the above conclusions, we could also find that the culture environment results in vary difference of drug response in different culture models. This proved that although the culture environment is important, the culture model is the main and most effective values for cell behaviors and toxicity of the drugs response.
Different drug response due to different culture model
In order to compare the effect of culture models, the drug responses are compared between cells cultured in the four culture models under the same culture conditions except culture model (G2, G3 and G3 are same). The result shows cells in different models present vary growth status and drug responses.
Toxicity of the drugs of paclitaxel
Toxicity of the drugs study in static culture
It was observed that paclitaxel‘s toxicity is highest on cells on monolayer culture and smallest on human tumor tissues. This explained the reason the drug dose applied to clinical according to drug tests results from laboratory is always insufficient. Between these two points, toxicity on MTs is more similar to human solid tumors that significant smaller than data of spheroids, which is relatively closer to results of 2D. However, this is not absolute that the drug response of MTs formed with NCI/ADR cells at 10µg/ML concentrations was slightly smaller than the toxicity of spheroids with no significant differences.
Toxicity of the drugs study in perfusion culture
When compared, the drug responses between the above cells cultured in the four culture models under perfusion cultures show similar trend observations. However, the differences between four culture models are bigger than in static culture. And the difference is more absolute that all drug responses of MTs are smaller than toxicity of spheroids. The data of MTs is closer to data of real human tumor tissue in perfusion culture.The most distinct group is the effect of paclitaxel on DLD1 cells. Take the concentration of 10µg/mL as an example, 85.75% and 81.76% cells were inhibited for cells cultured on monolayer and spheroids, where as 73.59% and 62.14% cells were inhibited for MTs and colon tumors.
Drug response of cisplatin
Toxicity of the drugs study in static culture
Cisplatin presents growth inhibitions on DLD1 and NCI/ADR cells in all these four culture models. Compare the toxicity of the drugs in different culture models; the highest growth rate of cell inhibitions were observed on cells in 2D culture models, and the lowest effect of drugs were observed on cells of actual human tumor tissues. The values of spheroids and MTs are between these two models with relatively higher toxicity of the drugs on spheroids than MTs. From the data listed under the graphs, it is observations show definite differences between each model especially between 2D cell culture and actual human tissues. Taking the toxicity of 1µg/mL cisplatin on DLD1 cells as an example, 93.55% cells are dead in 2D culture while about half-cells (55.47%) die in real tumor tissue. The concentration of 1µg/mL of cisplatin is almost equivalent to IC50 for cells in tumor tissues. However, estimates show that almost all cells are killed cells in the 2D cell culture. Further observations on the differences between spheroids and MTs show the value of MTs to be relatively closer to the data obtained from actual tumors with spheroids being closer to the data from 2D culture models. This toxicity of the drugs comparison results support the point that MTs have more similar characters of 3D tumor tissue structure than spheroids and 3D culture is more reliable than 2D cell culture.
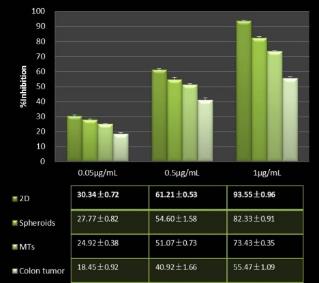
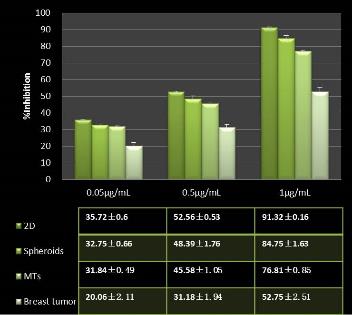
With the increase of the drug dosage, the differences turn out to be bigger between these four culture techniques. Taking the toxicity of the drugs study of cisplatin on NCI/ADR cell lines as an example, at the concentrations of 0.05µg/mL, less than 10% difference is observed between 2D and 3D culture models and 15% difference between 2D and breast tumor tissues. However, for concentrations of 1µg/mL, nearly 40% difference is observed between 2D culture model and the breast tumor tissue. On the other hand, examining the differences between two 3D culture models, spheroids and MTs, shows an approximate difference of 8%. The data used in these comparisons we could lead to the conclusion that the different models discussed elsewhere present different toxicities of the responses of the drugs which proved the importance of the cancer culture model in drug tests research.
Toxicity of the drugs study in perfusion culture
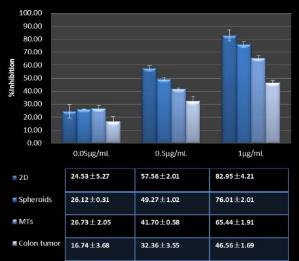
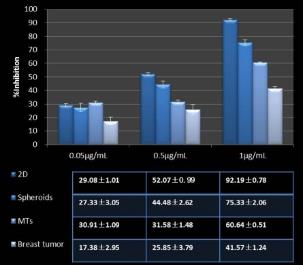
When comparing the drug response between cells cultured in these four culture models under perfusion cultures, with other results, different observations were made. The differences in the response to the drug at 0.05µg/mL have no regular rules. However, for both, the higher concentrations in the 2D cells have the highest toxicity drug response rates with the lowest toxicity of the drugs observed for real tumors. In addition, the differences between the four culture models are observed to be bigger in static culture. The data for MTs is closer to the data obtained in real tumor tissues in perfusion culture compared with data from spheroids, which is relatively closer to the value of cells in 2D.
In conclusion, the toxicity for both drugs showed differences between the four models as observed in both static and perfusion culture. The differences in the toxicity of the drugs were due to two main reasons. First, the cells in different culture models have different cell viability and structures, which will affect the drug response. Secondly, different culture models provide vary culture environment, which modulate the drug uptake and chemo-resistance. Thus, a tissue-like tumor and in vivo-like environment is required for accurate the drug tests results and the 3D alginate perfusion culture is the better model for the study.
Besides this, Observations on the standard deviation in real tumor drug tests was bigger than other culture models. In addition, the standard deviation of cells on monolayer culture was the lowest, a major advantage in 2D drug tests. This toxicity of the drugs tests study is applied after sample selections, which limit samples in the range from 70µm to 100µm. Because of this, the standard deviation of both spheroids and MTs are smaller making this to be the reason for selecting the sample. However, if the samples are introduced into the drug tests without using specific selection criteria, the standard deviation will be larger than the current value. Thus, it is proposed in the future that major works should be to improve the 3D cancer models in order to produced similar sized MTs, reducing the deviation between the samples.
Summary
In this chapter, paclitaxel and cisplatin are applied to colon and breast tumor tissues in static and perfusion culture environments. The toxicity of the drugs for both agents on cells in static culture is greater than the cells in perfusion culture. The low toxicity of the drugs on MTs in perfusion culture is due to three reasons. These include higher proliferation rates and r viability levels of the cells in perfusion culture, exclusion of dead cells because of insufficient nutrients from dead cells due to the toxicity of the drugs, and the lower chemoresistance to agents caused by relatively higher pHe microenvironment compared with static culture. However, the differences with the actual tumors are smaller than the difference due to cells in 3D culture. This is because cells in 3D culture have different drug response result from different drug uptakes and the differences in the structural growth status due to the differences in nutrient diffusion. However, the real tumors pieces cut from same piece of tumor tissue are almost having same structures and cell survival rate. In addition to that, it was proved that the impact due to perfusion culture on the growth of cells and MTs formation process was significant.
In the course of the study, the toxicity of paclitaxel and cisplatin drugs was compared and discussions focused on the four different culture models. Although a number of researches have shown the 3D culture to have more tumor-like structural characteristics compared to monolayer culture, a small number of studies have compared the toxicity of the drugs on cells in different culture models and actual tumor tissues. According to the results of cell viability studies, MTs characteristics, and the similar toxicity of the drugs with real tumor tissues were established. The alginate based 3D culture model, developed in this thesis, has similarities with the drug response model with real tumor tissues, which indicate the reliable value of this cancer model.
Concluding Remarks
Summary and Conclusion
In the study of anti-cancer drug development and preclinical toxicity tests techniques, major limitation encountered included liability of in vitro tumor models. These could assist agent selections from different chemicals to test the efficiency of drugs on cancer cells or tumor tissues. From the first animal-based in vivo models to the most current 2D cells that are line based in vitro models, researchers had taken nearly 100 years to develop a reliable model to test the efficiency of cancer drug. However, due to the discrepancy of animal and human body mainly due to structural limitation of the growth of cells on monolayers, these models are not ideal for tests drugs in the study. Therefore, this thesis examined the toxicity of drugs on cancer cells based on different cancer models developed in vitro perfused three-dimensional cancer models for 3D cancer cell culture and related drug tests studies.
The study took a systematic approach, first, by comparing the growth status of cancer cells and the efficiency of anti-cancer drugs on the cells. These observations between 2D and different 3D culture models, under both static, and perfusion culture environments. Secondly, studies on static and perfusion culture assaying for 2D, 3D culture models, and real tumors models were done to establish their differences.
In the first part of the study, two cancer cell lines were cultured as monolayer, spheroids and MTs in both static and perfusion culture environments. For static and perfusion culture, the rate of cell proliferations, cell viabilities, and 3D aggregates restructuring with two commercial anti-cancer drugs’ toxicities were compared between these three cancer models. The results showed that cells in 2D culture have different morphological characteristics and higher drug responses than 3D culture cells. The results of the environment for the growth of cells showed that 3D aggregates structures and drug tests suggested that MTs have more tissue-like characteristics than spheroids and thus the toxicity of the drugs on these two cancer models are significant different. In conclusion, the results of this part of study proved that the alginate based 3D cancer model is a better cancer model for 3D cancer culturing and toxicity of the drugs study when compared with 2D and spheroids model.
In the second part of the study, the comparison of static and perfusion culture were assayed on 2D, spheroids, and MTs. The cells in perfusion culture presented higher proliferation rates with significantly higher cell viability after 6 days culture especially for the cells in 3D culture. This was due to the stable and physiological environment provided by keep supplying nutrient and remove waste medium. By comparing the different toxicity levels of the drugs under static and perfusion, there are three main conclusions. Firstly, there is no significant difference in the toxicity of the drugs between cells in static and perfusion culture in 2D culture. This is due to the structural limitations of the monolayer culture since the dynamic culture can only affect the growth of cells on the surface. Secondly, the drug response to paclitaxel and cisplatin in static culture and perfusion culture registered significant differences. Studies for cisplatin toxicity of the drugs show that cells in static culture are larger than cells in perfusion culture. Typically, the lower toxicity of the drugs on MTs in perfusion culture is due to three reasons. These include a higher proliferation higher viability rate of the cells in perfusion culture, the exclusion of cells dead because of the insufficient nutrients from cells dead from toxicity of the drugs , and the lower chemoresistance to agents caused by relatively higher pHe microenvironment as compared to static culture.
For paclitaxel, toxicity of the drugs on cells in static culture is less than cells in perfusion culture. As the mechanism of paclitaxel is killing cells through inhibiting the mitosis of cells, paclitaxel mainly targets on cells in proliferation phase and cells in static culture have more cells in proliferation phase. In this case, the more cells in proliferation phase, more cells were inhibited by paclitaxel. In addition, the uptake of paclitaxel is not affect by pHe, thus the different pHe in static and perfusion culture made nearly no effort on toxicity of the drugs response. Finally, for the real tumor tissues, the toxicity of the drugs of both agents on cells in static culture is greater than cells in perfusion culture. The reason of the similarity of the toxicity of the drugs response in the cisplatin cells show different in the tumors being smaller than cells in 3D culture. This is because cells in 3D culture have different drug response result from the different drug uptake and the different structure and growth status due to the different nutrient diffusion.But the real tumors pieces cut from same piece of tumor tissue are almost have same structures and cell survival rate. It is also proved the perfusion culture impact on the growth of cells and MTs formation process.In conclusion, the perfused culture is not only more suitable for 3D cancer cell culture, but also can provide more trustable toxicity of the drugs tests results for clinical treatments.
Human tumors have been believed acidic according to the microelectrode measurement of tumor pH (Wike-Hooley et al., 1984). The tumor environment, which is hypoxia, low blood supply and acidic, is key factors of tumor progression, metastasis and response to therapies(Iessi, 2008). As one of the main features of tumor microenvironments, acidity plays an important role in tumor functions.Perfusion culture present different pHe with static culture and this affect the effectiveness of chemotherapeutic agents. The relation between tumor acidity and cytotoxicity of cisplatin was proved. The tumor acidity plays important role in tumor functions not only on drug response but also on the functions correlated in malignancy. Perfusion culture can provide different pHe during the culture by modulate diffusion rate which is helpful on understanding the tumor progression and drug resistance. In conclusion, the alginate based 3D perfusion culture model, which designed in this thesis, can be used to study the relation between tumor acidity and chemoresistance and the other tumor functions.
Besides, in order to further support the advantages of the developed 3D perfused cancer model, the toxicity of the drugs study was employed on actual human breast and colon cancer tumor tissues as well. Observations in the different toxicities of the drugs for tumors in static and perfusion culture environments were made for both drugs. Although for human solid tumors, the differences in the toxicity of the drugs on the tumors in static and perfusion culture was less than cancer cells in 3D structure were due to the denser structures of real solid tumor. Observations on significant difference from the results supported the fact that perfusion culture significantly affects the response of the drugs.
Finally, the drug responds of cells in these four culture models were compared under both static and perfusion culture environments. Toxicity of the drugs is biggest on cells on monolayer culture and smallest on human tumor tissues. This explained the reason the drug dose applied to clinical according to drug tests results from laboratory is always insufficient. Between these two points, toxicity on MTs is more similar to human solid tumors that smaller than data of spheroids which is relatively closer to results of 2D.
Eventually, combining the results from the two parts of the study and the support study of real tumor tissues, the in vitro perfused 3D cancer model, developed in this thesis proved valuable for cancer cell culture and related anti-cancer drug tests. This cancer culture model promotes the complexity of the tumor model by improving the 3D microtumor’s character and optimizing the surround culture environment. Combining the tissue-like 3D structure of MTs in vivo-like steady and homogenous culture conditions has shown that the 3D alginate perfusion cancer cell culture models are better for the study of tumor biology and related toxicity studies of the drugs in the research. This study has made valuable contributions to the 3D cancer model and anti-cancer drug studies, which could further lead to higher efficiency of chemotherapy.
Future work
From the above study, each cancer model developed presented specific advantages on cell culture and anti-cancer drug tests techniques. One of the techniques identified and proposed as having strong contributions to understanding cancer developments in the target victim was the metabolic technique based on specified metabolic parameters. The metabolic parameters used in the study included glucose and lactate which critically contributed to the understanding of the differences between different culture models compared with other previous models. With new and better understanding of the complexity of culture models, further study recommendations into the field are proposed. The 3D co-culture has taken the researchers inquiry through the yesteryears, which have made significant contributions on angiogenesis into the modern knowledge on cancer treatments. Typically, the alginate can easily capsule cells and perfuse the cultures provided in a more physiology environment and better nutrient supplements. The 3D perfused cancer model was assumed suitable for 3D co-culture with endothelia cells and infiltrating leukocytes, which exist in actual tumors. In this way, the MTs will be more complex and closer to in vivo real tumor tissue.