Overview
The company to be analyzed is Amazon.com, Inc. (Amazon), a listed company located in the United States that operates in the technology industry and the consumer cyclical market. The company has online and physical stores and provides a third-party marketplace to buyers and sellers. In terms of retail, Amazon offers products and services such as electronic equipment, online streaming, cloud computing, and books. The company enjoys the largest market share—37%—in the U.S. online retail market (Statista, 2018b).
Amazon operates in U.S. and international markets. The company’s customers are Internet users who access its website, mobile app, Alexa, Kindle, Fire TV, Amazon Prime, and other products in different market segments. Amazon’s main competitors are Taobao, eBay, Alibaba, Netflix, Google, and Apple. Customers prefer Amazon because the company offers a wide variety of products and services at competitive prices. Moreover, Amazon’s customers appreciate the company’s capable delivery system. Amazon’s strategy is customer-centric, focusing on innovative invention, customer satisfaction, operational excellence, and creative thinking (“Amazon.com, Inc. Form 10-K Report,” 2018). This strategy is helping the company to retain its customer base as well as attract new customers every year.
Amazon’s key resources are its 566,000 full-time and part-time employees working in the United States and various development hubs such as India (“Amazon.com, Inc. Form 10-K Report,” 2018). In addition, powerful leadership is responsible for the company’s impressive success and innovative ways of doing business. Copyrights, patents, and trademarks protect the company’s intellectual property. Although many other companies are following a similar business model, Amazon has a unique position in the e-commerce sector that makes it difficult for other companies to compete.
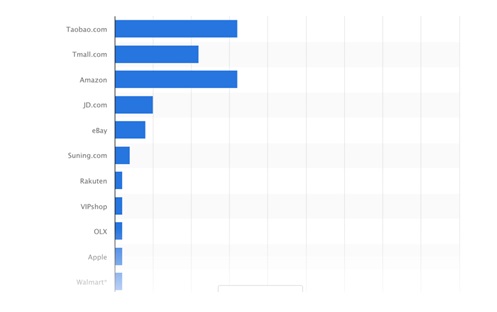
Key market trends indicate that competition in the web market is intensifying and many international companies are emerging, presenting a challenging situation for existing companies. Figure 1 shows that Amazon mainly competes with Taobao.com and Tmall.com in global markets with non-U.S. companies.
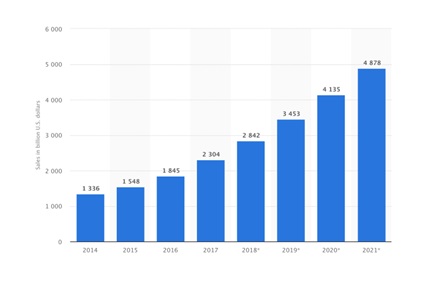
Global e-commerce sales are expected to almost double in the next five years as shown in Figure 2, creating a highly attractive and lucrative market for companies like Amazon. However, major concerns that could affect millions of customers worldwide include customer privacy, cybersecurity, and identity theft.
Financial History
The analysis of Amazon’s financial history indicates that the company’s revenues increased by 27.1% and 30.8% in 2016 and 2017, respectively. Moreover, net income increased by 297.8% in 2016 and 27.9% in 2017. The company’s stock price has almost doubled in the last three years, and it is still trading at a high P/E multiple of 190.09. On the other hand, net cash flow declined by 65.5% in 2017 after reported growth of 158.4% in 2016. The company had a high value of free cash flow in 2017, which could be used to acquire other businesses as a part of its strategy. Furthermore, analysis of the company’s balance sheet indicates that its total assets and total liabilities have increased by approximately 85% (“Amazon.com Inc. (NMS: AMZN),” 2018). The management has remained focused on increasing the company’s retained earnings over the last three years to avoid liquidity or solvency issues. This is also confirmed by the value of the current ratio, which has remained one over the last two years.
The market performance of Amazon’s shares over the last three years has shown that shareholders have been optimistic about the company’s growth potential (“Amazon.com, Inc. (AMZN),” 2018). However, the company’s high debt ratio value is a significant concern for shareholders as debt payments must be settled before Amazon distributes earnings. Although the return on equity has improved significantly in the last three years, the company did not pay any dividends, meaning that shareholders could only benefit from a capital gain when selling their shareholdings. Analysis shows that shareholders earned a capital gain of 276.9% over the last three years as the share price increased from $310.30 on December 31, 2014 to $1,169.47 on December 31, 2017 (“Amazon.com, Inc. (AMZN),” 2018).
The earnings per share of the company were $6.15 in 2017, compared to $4.90 in 2016 and $1.25 in 2015 (“Amazon.com Inc. (NMS: AMZN),” 2018). The high value of assets implies that Amazon has generated a small return on assets over the last three years. However, examination of the firm’s assets indicates that it has held a strong cash position in the previous three years. Furthermore, Amazon has had substantial non-current assets that could be used to protect shareholders’ interests in case the company defaults. However, the company must improve profitability by controlling operating expenses. Furthermore, Amazon should focus on new and emerging markets to achieve a profit in the company’s international operations.
References
Amazon.com Inc. (NMS: AMZN). (2018).
Amazon.com, Inc. (AMZN). (2018).
Amazon.com, Inc. form 10-K report. (2018). Web.
Statista. (2018a). E-commerce market share of leading e-retailers worldwide in 2016, based on GMV.
Statista. (2018b). Projected retail e-commerce GMV share of Amazon in the United States from 2016 to 2021.
Statista. (2018c). Retail e-commerce sales worldwide from 2014 to 2021 (in billion U.S. dollars).