Introduction
BSG Exotic Footwear is a renowned maker of fashionable and creative footwear. The firm is dedicated to producing trendy, high-quality items everyone can enjoy. The corporation is also concerned with social responsibility and sustainability and works hard to limit its environmental effects.
This study will look at BSG Exotic Footwear’s financial health by looking at standard financial indicators such as sales, income, expenses, and debt, as well as ratio analysis to offer a more complete picture of the company’s financial health. Graphical representations of data trends and patterns will also be included in the investigation. This research aims to understand better the company’s financial status and how it compares to other firms in the industry.
Non-Ratio Measures
Operating Income
Operational income is a company’s profit from its regular business activities. Operating income includes no gains or losses from the firm’s investments. To determine it, start by taking the total sales and deducting the operational expenditures, including the cost of items sold, labor, rent, taxes, and depreciation.
The pattern above demonstrates that BSG’s and the industry’s operational income have dramatically improved between 2021 and 2022. This shows that BSG has done better financially than its rivals by taking advantage of market tendencies and gaining market share. BSG’s efforts in these areas have helped the firm capitalize on market shifts and expand its customer base. Therefore, these factors are likely to blame. BSG has probably increased efficiency and lowered expenses, which has led to greater earnings.
Total Assets
Total assets are all the company’s resources, including cash, accounts receivable, inventory, investments, buildings, and equipment. It is the sum of a company’s current assets and long-term investments.
BSG Corporation excels in the footwear industry when total company assets are compared to all company assets. As compared to its industry average ($38,190,000), BSG’s total assets in 2022 were significantly higher at $40,321,000. Likewise, BSG’s total assets in 2021, at $37,740,000, were more than the median industry total of $37,319,000.
From 2020 to 2021, BSG’s overall assets grew by 9.7 %, while the footwear industry grew by 3.46 %. This demonstrates that BSG is streets ahead of the competition regarding asset growth. As compared to the footwear industry as a whole, BSG does better financially. Given this, it seems likely that BSG will be able to take advantage of opportunities as the business grows.
Total Liabilities
Accounts payable, loans, bonds, and any other forms of debt are all components that go into calculating a company’s total liabilities, which include all of its monetary commitments. It is the total amount that a corporation owes, including both short-term and long-term obligations.
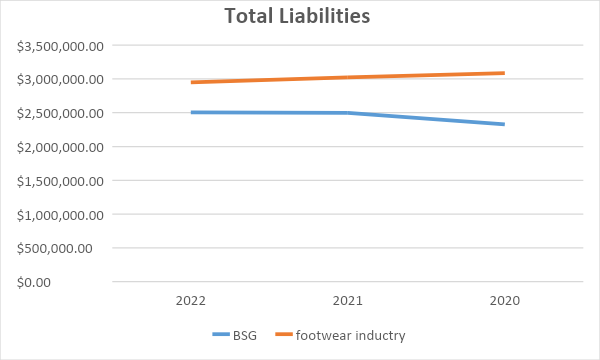
BSG’s total liabilities decreased from 2020 to 2021 and then again from 2021 to 2022, according to the pattern above. This shows that the firm has actively managed its obligations and has been able to lower its overall liabilities over the last three years. This is a good sign for the organization since it is becoming more financially solid. Conversely, the footwear industry’s total liabilities rose from 2020 to 2021 and then again from 2021 to 2022. This demonstrates that the sector as a whole is growing more indebted and borrowing more money to fund operations.
Cash Flow
The amount of money that enters and exits a business is called cash flow. It is the discrepancy between the firm’s cash receipts and cash payments. Cash flow might be positive or negative depending on the company’s financial situation.
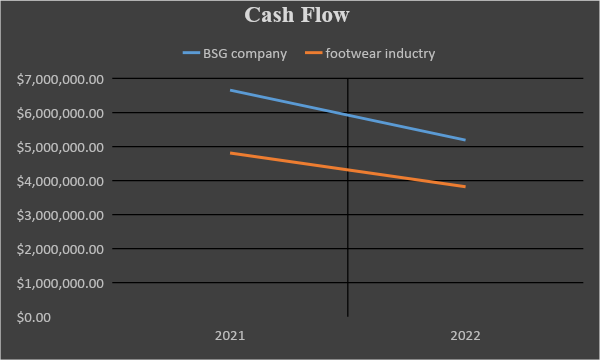
As indicated by the trend shown above in Figure 4, BSG’s cash flow dropped annually from 2021 to 2022, coinciding with a decline in the cash flow of the footwear industry as a whole. Notwithstanding this, BSG’s cash flow in those years was still much higher than the industry average. Given that BSG is producing more cash flow than the industry as a whole, while the latter is decreasing, this suggests that BSG is in a stronger financial situation than the latter. This suggests that BSG is a more successful business and can generate more cash flow than the average footwear maker. This can result from enhanced operational procedures, strategic investments, or a mix of these and other factors.
Net Profit
The amount of money that remains after deducting all of a firm’s expenditures from its total revenues is known as the net profit for that company. It is also sometimes referred to as net earnings or net income.
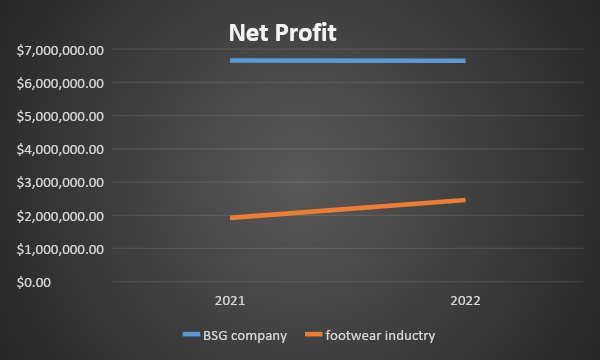
The figure above shows that BSG is now outperforming the footwear industry in terms of net profit. BSG’s net profit in 2022 was $6,651,000, well above the $2,460,000 average for the sector. Similarly, BSG’s net profit in 2021 was $6,661,000.00, far more than the $1,921,000.00 industry average. This reveals that BSG is more profitable than the industry average, providing it an advantage over its rivals in profitability. This might be attributed to various factors, including their excellent brand recognition, forward-thinking product offerings, and strong marketing activities. By the trend, it is also anticipated that BSG will maintain its position as the sector’s undisputed leader in terms of profitability in the coming years.
Ratio Measures
Return on Equity (ROE)
This is a measure of a firm’s profitability computed by dividing the company’s net income by the total shareholder equity in the company. Comparing businesses operating in the same sector often involves using this metric, which is reported as a percentage of total revenue.
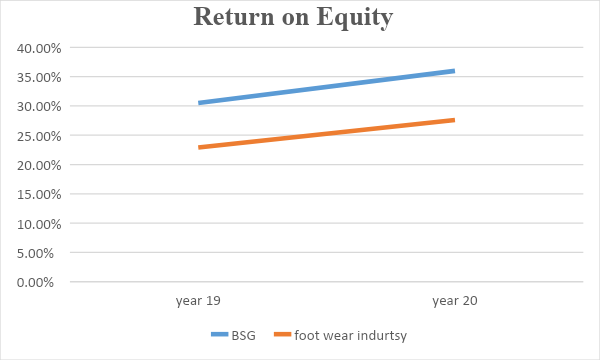
Comparing BSG’s return on equity (ROE) to the industry average, the accompanying table demonstrates that it is on a positive trend. BSG’s ROE grew from 30.50% to 35.98% in the previous two years, while the industry average climbed from 22.9% to 27.6%. This demonstrates that BSG has a better return on equity (ROE), which measures how well a company can utilize its equity to create profits than its competitors in the industry. As a result, BSG is utilizing its capital more effectively than the industry standard, which is positive news for the company. As a consequence of BSG managing its equity more profitably and effectively, as seen by the greater ROE, future profits should increase.
Debt to Equity Ratio (D/E)
A debt-to-equity ratio is a financial ratio that compares a firm’s total debt to its total equity. To determine it, divide the total amount of debt by the total amount of equity.
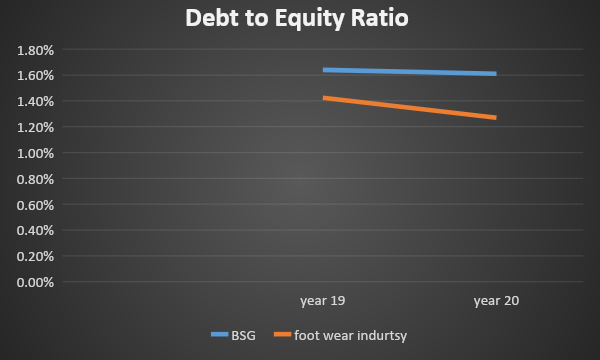
The pattern that came before it indicates BSG’s relative financial strength compared to the footwear industry. BSG has a higher debt-to-equity ratio than the average for the industry, which indicates that the company has a higher risk profile. This suggests that BSG has a higher debt-to-equity ratio and, thus, a higher leverage ratio.
Current Ratio
This is a financial ratio that measures a company’s ability to pay its short-term obligations. It is calculated by dividing a company’s current assets by its current liabilities.
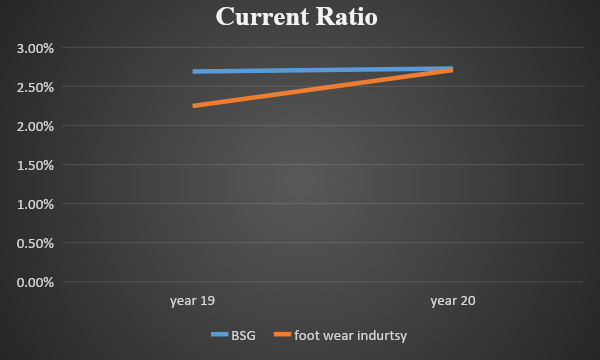
According to the pattern above, BSG Company’s current ratio has increased from 2.69% in 2013 to 2.73% in 2014, while the average for the industry has risen from 2.25% to 2.73% during the same period. The current ratio is an essential indicator of a company’s financial health. It reveals how well a business can meet its short-term commitments with the money it has on hand right now. A corporation with a high current ratio can easily meet its short-term debts. As a result, this trend indicates that BSG Company can better pay its immediate responsibilities.
Operating Profit Margin
This is a profitability metric that is determined by dividing a company’s operational income by its total sales. It is a critical indication of a company’s financial health and is stated as a percentage.
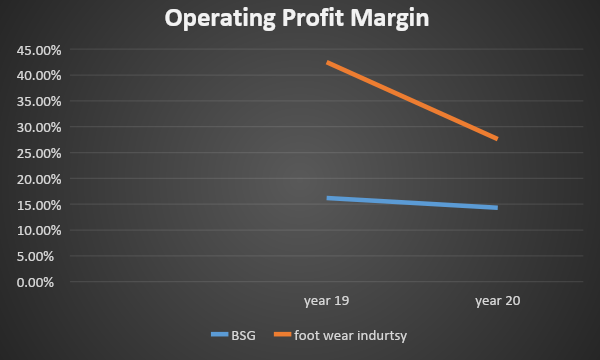
The above trend suggests that BSG Corporation’s operating profit margin has dropped significantly during the last two years. The operating profit margin for the previous year, Year 13, was 16.20%, but for the current year, Year 14, it has plummeted to 14.30%. On the other hand, the operating profit margin for the whole industry went from 42.5% in Year 13 to 27.6% in Year 14; this is a significant decline. With this information, it is reasonable to conclude that BSG Company’s performance is well below the average for the industry.
Earnings Ratio
A price-to-earnings ratio is a kind of financial statistic that compares the price of a stock to the company’s profits. It is determined by dividing the stock price of a firm by the earnings per share of that company.
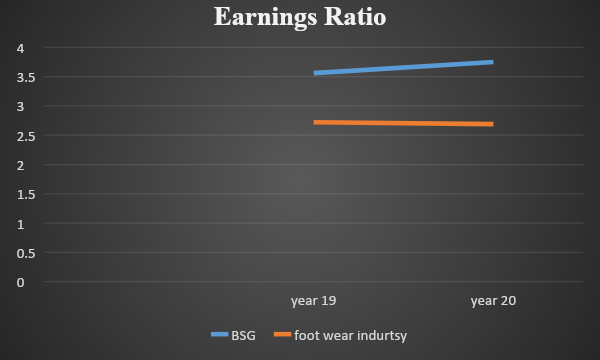
The BSG Corporation’s earnings per share (EPS) increased from $3.56 in the prior year to $3.75 in the current year. This proves that the company’s profitability has grown throughout the course of the year. However, the footwear sector’s earnings per share decreased by -0.03 from the previous year’s 2.72 to the current year’s 2.69. This would indicate that the industry as a whole had a decline in profitability over the course of the preceding year.
The BSG Corporation’s earnings per share (EPS) is above average, and it compares well to the EPS of similar companies. This seems to suggest that BSG Corporation is more profitable than the average company in the footwear industry. Maybe the enhanced management and advertising strategies of the corporation are to blame. It might also be attributed to the company’s stellar reputation for quality products and service.
Discussion
Several distinguishing features of BSG Company stand out when compared to the Footwear Industry. Compared to its competitors, BSG initially had better results in terms of operating income, total assets, net profit, and return on equity (ROE). This may indicate that BSG is more successful at maximizing returns on invested capital than its competitors. In addition, BSG has an EPS higher than the industry standard. This suggests that the company has a higher rate of profitability than the industry as a whole.
Reflection and Conclusion
The BSG Financial Analysis simulation was an excellent tool for better understanding a company’s financial standing. Return on Equity (ROE) and Debt to Equity Ratio (D/E) were familiar concepts, and I knew how to use them alongside non-ratio variables like operational income and total assets. By running the simulation and comparing BSG’s results to those of the footwear industry, I could grasp the relevance of cash flow, net profit, and the current ratio in gauging a company’s financial health. I also analyzed the firm and found its pros and cons.
The simulation was better than I had hoped, giving me a deep understanding of the company’s financial situation. There were no surprises since the simulation made the monetary indications clear and easy to understand. Because of this exercise, I now realize how crucial it is to consider financial implications while making decisions at the corporate level. I can now competently review financial paperwork and use that knowledge to assess a company’s financial health.
References
Market Research. (2023). Footwear Market Research Reports & Industry Analysis. Market Research. Web.
Footwear Market Size & Share Analysis. (2023). Footwear market size & share analysis – industry research report – growth trends. Footwear Market Size & Share Analysis – Industry Research Report – Growth Trends. Web.