Introduction
The database displays the US film industry net benefits from 1988 to 1999. Six major distributors have constantly dominated the market over the decade. The most profitable studios produce the most profitable films. Paramount is the market share leader with a 14.74% share. A CPI index higher than 100% from the base year is considered to have inflation. The base year under consideration is 1982.
A) The tables below show the adjusted real values of the various US film distributors. Each specific year is adjusted to the base year (1982) as recorded by the federal government. The CPI indicates the rates of change of consumer prices as well as the level of inflation. The CPI used are end of year CPI averages. A CPI index of 118.3, such as that of 1988, would indicate an inflation rate of 18.3% from 1982. The formula used to calculate the adjusted values is the value*100/CPI. This gives the value of the distributor without inflationary effects.
Table 1: The top nine US distributors.
Table 2: top nine US distributors adjusted totals the real value.
Concentration ratios
The concentration ratio of the four leading companies is approximately 0.53 (or 53%). The film industry operates under oligopolistic competition. The oligopolistic competition involves the top four market leaders having a 40% market share or more. A 53% market share indicates there is less competition between US film distributors. In oligopolistic competition, companies react to business strategies applied by competitors. Market leaders are likely to collude to avoid lower profit margins. New entrants have to spend more on advertising to capture a market share. The companies with smaller market shares find it necessary to lower prices to remain in the market. The prices of market leaders are more likely to remain stable.
Six distributors hold a 76% market share (CR6 = 0.760421017), and eight of the leading distributors hold an 89% market share (CR8 = 0.892786944). Competition may only be effective among the eight leading companies. According to the market share percentages, the six market leaders are Paramount, Buena Vista, Warner Bros, MGM/UA, Universal, and Twentieth Century.
Stability of concentration
The concentration of the film industry is stable as an oligopolistic market. The total income for the top four distributors in 1990 is 1,902,552,082, and the overall income from the industry is 3,758,221,473 giving a CR4 of 0.50623735. This has declined slightly from the one in 1988 which is 0.526745023. The total value of earnings for the largest six by market share is 3,133,512,700, and the overall earnings for the industry is 3913034800 giving a CR6 of 0.80078835. This compared to the 1998 CR6 shows an increase from 76% to 80%. The total for the leading six firms is 3,697,836,822, and overall of 4,816,987,259 in 1999. This gives a CR6 of 0.76766589. Lower than the one in 1995 but almost similar to the one in 1988. This indicates that the concentration ratios are constant on the initial concentration ratios.
Herfindahl-Hirschman Index (HHI) is calculated by adding the squares of the market leaders’ shares. A high percentage at the top makes the market to be considered as a tight oligopoly. The HHI for the film industry is 1072.98 which is considered to be a moderate concentration.
Stability of the oligopoly
The distribution industry is a very stable oligopoly with income being highest among the top four distributors. Income leadership varies every year but the leader in most cases remains among the first four companies. For example, in 1988 Paramount was the market leader. Warner Bros was first in 1989. Twentieth Century Fox was first in 1990. After 1994, the market leadership alternates between Buena Vista and Warner Bros. The top six firms dominate the industry. The seventh is less than half the income received by the sixth firm in 1999. The dominant players remain to be market leaders.
A stable oligopoly poses marketing challenges to new entrants. The most successful new entrant in the market is Sony Pictures in 1994. It was fourth in earnings that year but holds an overall 10th position. Dreamworks is the second-best new entrant at 17th position. The majority of new entrants are below the 17th position. This confirms that the market operates under stable oligopolistic competition.
Prices are fairly constant in oligopolistic competition. The top distributors are more likely to charge the same price to customers. The database indicates total net earnings making it difficult to find out what individual customers were charged at the entrance to the cinema.
The Gini Coefficient indicates the degree of income disparity among individuals. A Gini coefficient that approaches zero indicates incomes that are normally distributed. A Gini coefficient closer to 1 represents more inequality in the industry. The Gini coefficient presented in the database is the one for various film titles which are 0.610226. This shows that income distribution among various movie titles has a moderate unequal income distribution. This can be confirmed by comparing “Rain Man” the title with the highest income 15,870,1042.2 USD with “Little Nikita” (No. 159, in the middle) which earned 1,645,840.5 USD, and “State Park” which earned 398.3 USD as the last (No. 318). There is a wide range between income differences of these three titles.
Relationship between market dominance and profitability
The market leaders benefit from economies of scale. This can be found in the advertising and production of films. The leading companies operate many screens compared to the others. For example in the Box Office Weekly 1998, Paramount was operating 2,746 theatres while MGM/UA had 2,807 theatres (1st & 2nd week of Jan). This leads to high-profit margins because advertising is shared despite the large number of screens operated by the distributors. This makes the marketing cost a small fraction of sales. It can be confirmed that in these two weeks the two companies had among the highest net earnings. Other economies of scale are generated by obtaining film rights, and production of tickets.
Market leaders can influence prices. They have market power with the ability to influence even the suppliers. Market leaders can push the price of movie rights higher to reduce the small-sized distributor’s ability to obtain them. This eventually makes the dominant distributors obtain rights to most of the blockbusters. They get the highest quality movies which results in a large sales volume. This increases their profitability.
Market experience gives the dominant companies the ability to use more efficient procedures. This reduces costs making them more profitable. Less dominant companies may be unwilling to spend more on research to develop efficient methods. Dominant companies can hire quality management.
Market leaders can cooperate among themselves to set prices that are fit for themselves leaving the less dominant companies out of consideration. They may charge higher prices because of their good reputation, and higher quality films. This is a disadvantage to smaller-sized companies who have to use low prices for market penetration. Dominant companies in such a case have a high volume of sales at a higher profit margin. There is a low purchase-to-sales ratio.
There are variations in annual net earnings but the most profitable firms remain among the initial top six companies. Profitability has varied within the considered period. The first two studios, Buena Vista and Warner Bros emerged as consistent profitability leaders towards the end of the period under consideration.
Firms’ profitability and firms’ profitability
Films’ profitability comes from leading brands. According to the concentration ratios, Paramount holds the largest market share. Its film releases have the highest weekly averages and accumulated earnings in the industry.
The firm’s profitability is related to the film profitability through the purchase-to-sales ratio. According to the Box Office Weekly 1998 database, Paramount made one major film release with very high-profit margins compared to Miramax which had three minor releases in the first two weeks (2-4 & 9-11 Jan). Warner Bros had two releases. Paramount is the 3rd market leader while Miramax is in the 11th position by net earnings. Sony (6th), Miramax (11th), Dreamworks (13th), and Fox (20th) have the highest number of film releases at a go. With relevance to Warner Bros and Paramount, it can be noted that the dominant companies make one or two film releases at a time. The medium-sized firms, such as Sony, make three or four releases at a time. Their profit relies on the high number of films they release. The dominant firms rely on higher sales on the single film released. More profitable firms are releasing few films but with high sales volume and high-profit margins.
The most profitable release for Dreamworks SKG in the period (24 Jul 1998) was “Saving Private” with a real USD net earnings of 147,056,681. Most of the releases have a net earning of over 35 million real USD. It has about 17 film releases between 1997 and 1999. On the other hand, Warner Bros has “Lion King” with the highest net earnings of 234,524,408 real USD released 15 Jun 1994. It has about 260 films released between the years 1988 and 1999 with many films having net earnings of over 100 million USD. This confirms that the most profitable firms release the most profitable films.
Conclusion
The film industry operates under stable oligopolistic competition where prices are determined by a few dominant firms. Market power gives the dominant firms the ability to hire high-quality services. This enables them to release high-quality films. This makes them charge standard ticket prices and still have a high sales volume. The low purchase-to-sales ratio makes the dominant firms have high net earnings compared to smaller market shareholders. New entrants into the market are unlikely to capture the top ten market share positions. Sony Pictures is the most successful new entrant in the period.
Comparison of weekly market shares against annual market shares
1998 overall CR8 = 0.788011209
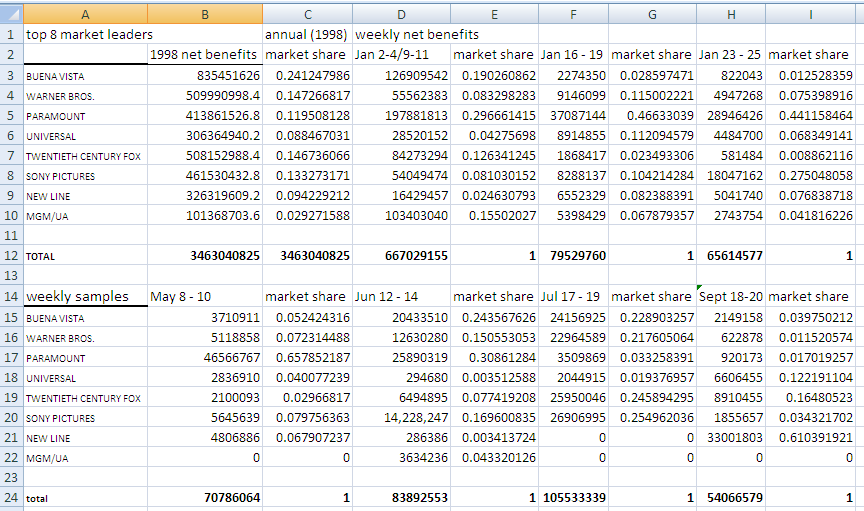
The list shows the market shares which are fractions of what the top 8 firms hold. To obtain the overall market share, one will need to multiply CR8 (0.788) by the market shares that are listed. For example, an overall estimate of Paramount’s market share in the first week is 0.094172 (= 0.788*0.119508128). In the case where a company has three or four releases, the sum of the three releases is the one indicated.
The market leader in weeks 1 & 2 in Buena Vista by releasing separate movies. Paramount is the leader in week 3, relying on one major successful movie. Between May 8 – 10, Paramount is the leader with 65% of CR8. Buena Vista is the leader between Jun 12 – 14 with 24% of CR8. New Line is the leader between Sept 18 – 20 with 61% of CR8. The top three firms are frequent weekly market leaders. The overall market leader in 1998 is Buena Vista with 24% of CR8, followed by Warner Bros 14.7%, and 20th Century Fox 14.6% of CR8.
Competitiveness
The distributor’s strategy is almost similar. When a studio releases a more successful film, then it holds back other movie releases. This ensures that the net benefits are highest for that particular release. Releasing more movies when you have a successful release in the market is considered to be distracting customers’ interest from the successful release. This is evident from the first week of January when Paramount had only one major release “Titanic”. It can also be seen when Sony had only two releases (the Mask of Zorro & Madeline) in the third week of July. Sony usually made three or four releases at the same time. During the same week, Warner Bros and Buena Vista had three or more releases when they usually had one or two. The companies with less successful releases use the business strategy of launching several products to capture the market share. This has been used by Sony, Miramax among others before but it has also been applied by the topmost players when they have less successful releases. MGM/UA is the only firm that has stuck to one movie release at a time.
Using Porter’s Five Forces
Supplier’s power is strong because the film industry relies on celebrities. There are a few celebrities, and their services are expensive. The best actors are highly demanded. They choose the highest bidder. Movie-script writers also choose the highest bidder once their work is highly rated. There are producers and directors with a special touch which increases their demand. Production costs are high because the services are expensive. Suppliers have strong bargaining power.
The power of buyers is limited by the ability of the market leaders to choose standard prices under which all their products are charged. The success of a movie release thereafter depends on the number of viewers and not on a high pricing strategy. Buyers have less bargaining power.
Competitive rivalry in the film industry is considered strong. This is because all the top 8 distributors can release high-quality products. This is evident in the weekly reviews where leadership circulates among all the top players. Most of them use similar strategies such as operating large numbers of theatres, and multiple releases.
The threat of substitution is limited once a company has a successful movie release. This is the case that makes “Titanic” to be very successful. A movie is a unique product that must not be copied in any form. The customers have no choice but to buy tickets for the movie or never see it anywhere else. The situation is different when a release is less popular. Viewers may substitute movies with similar rankings.
New entrants find it difficult to penetrate the market. This is because of the required expertise in the industry that is obtained through learning and cumulative experience. During the period, only Sony can be considered as a successful new entrant. There are no threats of new entrants.