This paper reports the results of modeling of weather and climate data obtained from the Australian’s Bureau of Meteorology. The goal is to predict whether it will rain tomorrow using a decision tree model and the meteorological variables for the last fourteen months. The data modeling is performed by the Rattle and R software package after it is organized using excel. The prediction of weather, and specifically whether it will rain tomorrow, is a significant aspect because it helps in planning in advance. The results of the models highlights that there is a high probability that it would rain tomorrow.
Introduction
Data mining basically involves building data models. These data models can help us predict the future behavior of certain things (Williams, 2011). Building data models or rather data modeling turns data into a structured form that mirrors the data in a valuable way. This paper reports on the results of modeling of some weather and climate data obtained from the Australian Government’s Bureau of Meteorology website.
Goal and objectives of experiment
The goal of this experiment is to predict whether it will rain tomorrow using some meteorological variables and the respective data recorded for the last fourteen months.
The specific objectives of the experiment are as follows:
- To determine whether the rainfall for the following day exceeds 1 milliliter.
- To determine whether the rainfall for the following day is, or is below 1 milliliter.
Hypothesis of experiment
The null hypothesis of this experiment is that it will not rain tomorrow. The alternative hypothesis is that it will rain tomorrow.
Methodology
This experiment involved first obtaining weather and climate data from the Bureau of Meteorology website. The data for the Canberra, NWS meteorological station (Station number 070351) was selected. This station is located within 35.300S, 149.130E.
Data for the last fourteen months was obtained and used in developing the model and prediction. The data was categorized into the following variables:
- Date,
- Minimum temperature (°C),
- Maximum temperature (°C),
- Rainfall (mm),
- Evaporation (mm),
- Sunshine (hours,
- Direction of maximum wind gust,
- Speed of maximum wind gust (km/h),
- Time of maximum wind gust,
- 9am Temperature (°C),
- 9am relative humidity (%),
- 9am cloud amount (oktas),
- 9am wind direction 9am wind speed (km/h),
- 9am MSL pressure (hPa),
- 3pm Temperature (°C),
- 3pm relative humidity (%),
- 3pm cloud amount (oktas),
- 3pm wind direction,
- 3pm wind speed (km/h),
- 3pm MSL pressure (hPa),
Since this weather and climate data was available in several spreadsheets, the Microsoft Excel spreadsheet was used to organize it into a single spreadsheet. In addition, using Excel, three other derived variables were added to the existing variables to facilitate the data modeling using the Rattle software. These variables included the Rain Tomorrow, whose dataset was treated as the prediction problem. The other two variables were the Rain Today and Risk MM.
In the Rattle software data panel, the Date variable was set as an identifier, the Rain Tomorrow variable as the target, and the Risk MM as the risk variable. Other variables were set as the input variables. However, all the variables were a mixture of categoric and numeric data type, except the Date variable that was an identifier type.
The Rattle software package, which is highly dependent on the R platform, was used to manipulate and model the weather and climate data. The data was loaded and necessary variables selected after which it was explored, tested, transformed, and then modeled. The output diagram (decision tree) was copied
Results
A summary of the decision tree model for classification was output by the Rattle software (built using ‘rpart’) as shown below.
n= 294
node), split, n, loss, yval, (yprob)
* denotes terminal node
- root 294 66 no (0.7755102 0.2244898)
- Time.of.maximum.wind.gust=0:08,0:13,0:17,0:38,0:39,0:53,1:04,1:07,1:29,1:42,1:50,10:06,10:13,10:14,10:33,10:35,10:55,10:56,10:57,11:05,11:06,11:11,11:14,11:18,11:20,11:23,11:25,11:27,11:35,11:43,11:53,11:56,11:57,12:00,12:02,12:08,12:11,12:12,12:21,12:23,12:28,12:30,12:32,12:33,12:34,12:41,12:43,12:44,12:45,12:46,12:47,12:49,12:50,12:51,12:55,12:56,13:01,13:03,13:04,13:07,13:08,13:09,13:12,13:13,13:20,13:22,13:23,13:24,13:26,13:27,13:29,13:32,13:33,13:34,13:35,13:39,13:40,13:42,13:43,13:44,13:47,13:51,13:52,13:54,13:55,13:57,13:58,14:00,14:02,14:10,14:13,14:22,14:23,14:28,14:29,14:42,14:48,14:52,14:53,14:58,15:01,15:02,15:05,15:06,15:07,15:08,15:09,15:11,15:15,15:16,15:18,15:23,15:26,15:28,15:29,15:30,15:31,15:32,15:34,15:37,15:38,15:45,15:53,15:54,16:08,16:13,16:16,16:24,16:36,16:43,16:44,17:04,17:15,17:20,17:21,17:28,17:30,17:32,17:41,18:12,18:18,18:20,18:28,18:33,18:46,18:51,19:29,19:32,19:43,19:52,2:04,2:07,2:13,2:37,20:10,20:15,20:19,20:51,22:13,22:47,23:11,23:13,3:11,3:20,3:48,4:19,5:29,5:35,6:20,7:20,9:44,9:52,9:53,9:57 201 0 no (1.0000000 0.0000000)
- Time.of.maximum.wind.gust=0:42,0:43,1:05,10:11,10:31,10:32,10:38,10:49,11:00,11:28,11:33,12:17,12:25,12:37,12:48,12:54,12:59,13:06,13:11,13:18,13:21,13:31,14:12,14:20,14:27,14:33,14:35,14:36,14:39,14:43,14:55,14:56,14:57,15:00,15:20,15:24,15:33,15:39,15:49,15:50,16:06,16:11,16:19,16:26,16:48,17:17,17:34,17:52,18:07,18:27,18:52,19:26,20:01,20:42,20:49,21:15,22:03,22:36,5:03,6:57,7:28 83 20 yes (0.2409639 0.7590361)
- Time.of.maximum.wind.gust=0:43,12:48,13:21,14:27,14:33,14:39,14:55,14:56,15:20,15:24,15:50,16:06,16:11,17:17,17:34,21:15 36 16 no (0.5555556 0.4444444)
- X9am.wind.speed..km.h.=11,13,22,33,4 9 0 no (1.0000000 0.0000000) *
- X9am.wind.speed..km.h.=15,19,2,31,6,7,9,Calm 27 11 yes (0.4074074 0.5925926)
- X3pm.relative.humidity….< 48.5 16 5 no (0.6875000 0.3125000) * 27) X3pm.relative.humidity….>=48.5 10 0 yes (0.0000000 1.0000000) *
- Time.of.maximum.wind.gust=0:42,1:05,10:11,10:31,10:32,10:38,10:49,11:00,11:28,11:33,12:17,12:25,12:37,12:54,12:59,13:06,13:11,13:18,13:31,14:12,14:20,14:35,14:36,14:43,14:57,15:00,15:33,15:39,15:49,16:19,16:26,16:48,17:52,18:07,18:27,18:52,19:26,20:01,20:42,20:49,22:03,22:36,5:03,6:57,7:28 47 0 yes (0.0000000 1.0000000) *
Classification tree:
rpart(formula = RainTomorrow ~., data = crs$dataset[crs$train,
c(crs$input, crs$target)], method = “class”, parms = list(split = “information”),
control = rpart.control(usesurrogate = 0, maxsurrogate = 0))
Variables actually used in tree construction:
[1] Time.of.maximum.wind.gust X3pm.relative.humidity….
[3] X9am.wind.speed..km.h.
Root node error: 66/294 = 0.22449
n= 294
CP nsplit rel error xerror xstd
1 0.696970 0 1.000000 1.0000 0.10840
2 0.075758 1 0.303030 1.9848 0.12913
3 0.010000 4 0.075758 1.9394 0.12881
Time taken: 0.60 secs
Rattle timestamp: 2011-07-26 10:15:10
======================================================================
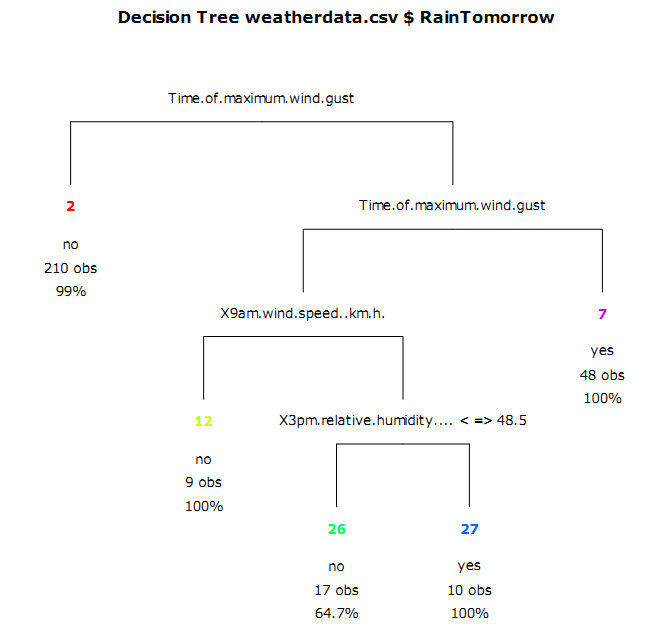
The visual presentation of this output is shown below.
Rules
The rules for this modeling were output as follows:
Tree as rules
Rule number: 7 [RainTomorrow=yes cover=47 (16%) prob=1.00]
Time.of.maximum.wind.gust=0:42,0:43,1:05,10:11,10:31,10:32,10:38,10:49,11:00,11:28,11:33,12:17,12:25,12:37,12:48,12:54,12:59,13:06,13:11,13:18,13:21,13:31,14:12,14:20,14:27,14:33,14:35,14:36,14:39,14:43,14:55,14:56,14:57,15:00,15:20,15:24,15:33,15:39,15:49,15:50,16:06,16:11,16:19,16:26,16:48,17:17,17:34,17:52,18:07,18:27,18:52,19:26,20:01,20:42,20:49,21:15,22:03,22:36,5:03,6:57,7:28
Time.of.maximum.wind.gust=0:42,1:05,10:11,10:31,10:32,10:38,10:49,11:00,11:28,11:33,12:17,12:25,12:37,12:54,12:59,13:06,13:11,13:18,13:31,14:12,14:20,14:35,14:36,14:43,14:57,15:00,15:33,15:39,15:49,16:19,16:26,16:48,17:52,18:07,18:27,18:52,19:26,20:01,20:42,20:49,22:03,22:36,5:03,6:57,7:28
Rule number: 27 [RainTomorrow=yes cover=10 (3%) prob=1.00]
Time.of.maximum.wind.gust=0:42,0:43,1:05,10:11,10:31,10:32,10:38,10:49,11:00,11:28,11:33,12:17,12:25,12:37,12:48,12:54,12:59,13:06,13:11,13:18,13:21,13:31,14:12,14:20,14:27,14:33,14:35,14:36,14:39,14:43,14:55,14:56,14:57,15:00,15:20,15:24,15:33,15:39,15:49,15:50,16:06,16:11,16:19,16:26,16:48,17:17,17:34,17:52,18:07,18:27,18:52,19:26,20:01,20:42,20:49,21:15,22:03,22:36,5:03,6:57,7:28
Time.of.maximum.wind.gust=0:43,12:48,13:21,14:27,14:33,14:39,14:55,14:56,15:20,15:24,15:50,16:06,16:11,17:17,17:34,21:15
X9am.wind.speed..km.h.=15,19,2,31,6,7,9,Calm
X3pm.relative.humidity….>=48.5
Rule number: 26 [RainTomorrow=no cover=16 (5%) prob=0.31]
Time.of.maximum.wind.gust=0:42,0:43,1:05,10:11,10:31,10:32,10:38,10:49,11:00,11:28,11:33,12:17,12:25,12:37,12:48,12:54,12:59,13:06,13:11,13:18,13:21,13:31,14:12,14:20,14:27,14:33,14:35,14:36,14:39,14:43,14:55,14:56,14:57,15:00,15:20,15:24,15:33,15:39,15:49,15:50,16:06,16:11,16:19,16:26,16:48,17:17,17:34,17:52,18:07,18:27,18:52,19:26,20:01,20:42,20:49,21:15,22:03,22:36,5:03,6:57,7:28
Time.of.maximum.wind.gust=0:43,12:48,13:21,14:27,14:33,14:39,14:55,14:56,15:20,15:24,15:50,16:06,16:11,17:17,17:34,21:15
X9am.wind.speed..km.h.=15,19,2,31,6,7,9,Calm
X3pm.relative.humidity….< 48.5
Rule number: 12 [RainTomorrow=no cover=9 (3%) prob=0.00]
Time.of.maximum.wind.gust=0:42,0:43,1:05,10:11,10:31,10:32,10:38,10:49,11:00,11:28,11:33,12:17,12:25,12:37,12:48,12:54,12:59,13:06,13:11,13:18,13:21,13:31,14:12,14:20,14:27,14:33,14:35,14:36,14:39,14:43,14:55,14:56,14:57,15:00,15:20,15:24,15:33,15:39,15:49,15:50,16:06,16:11,16:19,16:26,16:48,17:17,17:34,17:52,18:07,18:27,18:52,19:26,20:01,20:42,20:49,21:15,22:03,22:36,5:03,6:57,7:28
Time.of.maximum.wind.gust=0:43,12:48,13:21,14:27,14:33,14:39,14:55,14:56,15:20,15:24,15:50,16:06,16:11,17:17,17:34,21:15
X9am.wind.speed..km.h.=11,13,22,33,4
Rule number: 2 [RainTomorrow = no cover=201 (68%) prob=0.00]
Time.of.maximum.wind.gust=0:08,0:13,0:17,0:38,0:39,0:53,1:04,1:07,1:29,1:42,1:50,10:06,10:13,10:14,10:33,10:35,10:55,10:56,10:57,11:05,11:06,11:11,11:14,11:18,11:20,11:23,11:25,11:27,11:35,11:43,11:53,11:56,11:57,12:00,12:02,12:08,12:11,12:12,12:21,12:23,12:28,12:30,12:32,12:33,12:34,12:41,12:43,12:44,12:45,12:46,12:47,12:49,12:50,12:51,12:55,12:56,13:01,13:03,13:04,13:07,13:08,13:09,13:12,13:13,13:20,13:22,13:23,13:24,13:26,13:27,13:29,13:32,13:33,13:34,13:35,13:39,13:40,13:42,13:43,13:44,13:47,13:51,13:52,13:54,13:55,13:57,13:58,14:00,14:02,14:10,14:13,14:22,14:23,14:28,14:29,14:42,14:48,14:52,14:53,14:58,15:01,15:02,15:05,15:06,15:07,15:08,15:09,15:11,15:15,15:16,15:18,15:23,15:26,15:28,15:29,15:30,15:31,15:32,15:34,15:37,15:38,15:45,15:53,15:54,16:08,16:13,16:16,16:24,16:36,16:43,16:44,17:04,17:15,17:20,17:21,17:28,17:30,17:32,17:41,18:12,18:18,18:20,18:28,18:33,18:46,18:51,19:29,19:32,19:43,19:52,2:04,2:07,2:13,2:37,20:10,20:15,20:19,20:51,22:13,22:47,23:11,23:13,3:11,3:20,3:48,4:19,5:29,5:35,6:20,7:20,9:44,9:52,9:53,9:57
[1] 9 8 3 6 4 7 1 5 2
Data analysis and conclusion
The rule number twenty seven (27), which corresponds to the node number twenty seven and number twenty seven in figure 1 above is the strongest or the best rule predicting rain. It has the highest probability. The rule read that if the wind speed at 9am is any of the 5, 19, 2, 31, 6, 7, 9 kilometer per hour speed or the wind is calm, and the relative humidity at 3 pm is greater than of equal to 48.5 then there is a very likelihood that it will rain tomorrow.
On the contrary, rule number 26 reads that if the wind speed at 9am is any of the 5, 19, 2, 31, 6, 7, 9 kilometer per hour speed or the wind is calm, and the relative humidity at 3 pm is less than 48.5 then there is a 64.7% chance that it will not rain tomorrow.
Rules number two, number seven, and number twelve are not used to predict whether it will rain tomorrow because they are based on few variables.
The conclusion based on the rule twenty seven is that it would rain tomorrow given the previous weather parameters. The probability that it will rain tomorrow is 100%.
Reference list
Williams, G., 2011. Data mining with Rattle and R: the art of excavating data for knowledge discovery. New Mexico, United States: Springer.