Introduction
Statistical principles are key in any organization as they help when making decisions. Businesses are able to compute, analyze and interpret data numerically relating to their performance. It is through data analysis that an organization can identify trends in their business performance hence making a rational decision on how to modify their operations. Furthermore, through data analysis, business people can identify the existing gaps in the market, which can be utilized as opportunities for the growth of the company (Arani et al., 2022). The correct combination of variables in a data set will be influential in the management of an organization since one can easily relate the correlation between data with their daily functions at work.
Therefore, the regional call Centre in Washington DC has must expertise in the statistical tools to analyze their data to determine the current business performances of their customers. In this report, a comprehensive statistical analysis has been conducted based on the ‘regional call center’ data file. The variables found in the data file are useful when conducting statistical analysis. In this case, some of the variables that will b used in to generate the output visual comprise the past amount dues, accounts and the current amount dues.
Bar Charts
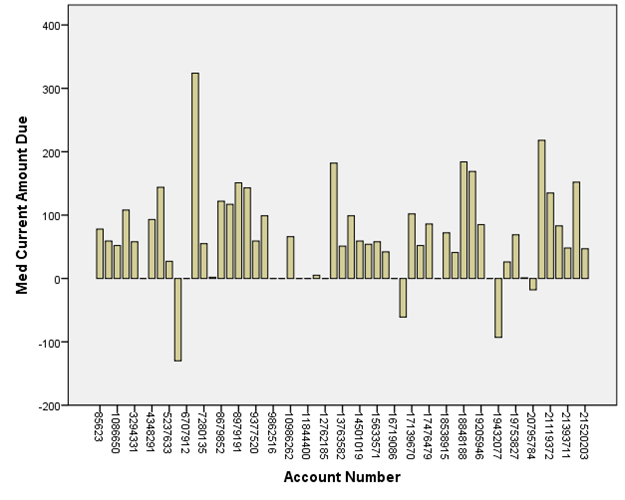
A bar graph is used as a statistical tool to show the relationship that exists between specific variables. It shows the level of the variables, which is represented by the height of the bar. A comparison of metrics is demonstrated by the bar graph whereby an individual is in a position to compare the variables. Figure 1 shows the bar graph for the mean current amount due against the account number.

The regional call center can make use of the above bar graph to determine the average current account balances for their clients. From the graph above, the highest mean for the account balance is 300, represented by account number 7280135. Arguably, account number 67077912 shows the lowest mean on the bar grave with an average of 100 negative. However, the majority of the account numbers are represented with a mean of 100. Therefore, it is concluded that most companies have current account balances with an average of 100. Information from the bar graph above can be used in decision-making when establishing ways how to recover the current due balances.
Bar Graph for Current Amount Due
The median represents the central value of the current account balance due, which is sorted in ascending order. From the bar graph above, one can easily identify the middle value of balances. The regional call cent can use the median bar graph when providing the economists with the current performances of the different companies. The average median number for different account numbers has a balance between 100 and 200.
A Scatter Charts
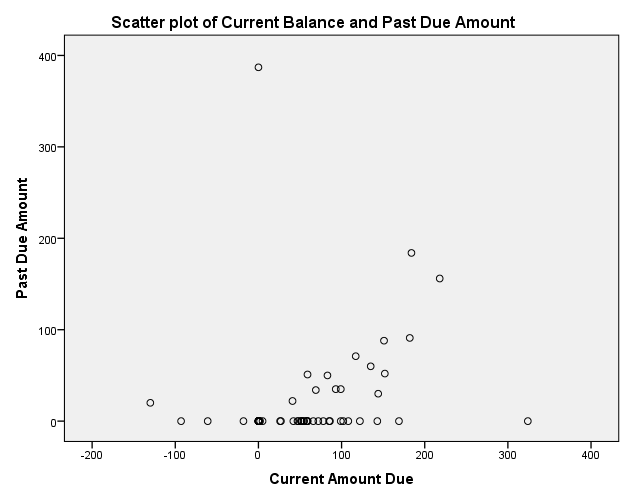
A scatter bar chart s an essential statistical output when analyzing data. The chart helps in identifying the relationship between different variables from a given data set. The relationship between two different variables is presented in the graph where there is a higher concentration of points. Figure 3 represents a scatter graph between the past due amount and the current amount due. The relationship between the two variables is presented with different points marked in the graph using the small circles. From figure 3 above, one can tell that there is a low concentration from (-200, 0) to 0, 100). However, there is a high concentration of the circle between (0,0) and (200,100). The scatter chart above shows that accounts for different companies have a balance ranging between 0 and 200 for both current and past dues. It should be noted that the area which is highly concentrated presents a strong relationship between the variables. There are few scatters after point (200, 200) from the above graph, meaning that few companies have balances with an amount more than 200.
Descriptive Statistics for Current and Past Due Amount
Table 1:Descriptive for Past and Current Dues
Table 2:Descriptive for Past and Current Dues
The descriptive statistical analysis for the past due amount and the current due amount is presented using the range, minimum, maximum, sum, mean, standard deviation, skewness, and kurtosis. From table 1 above, N represents the number of responses which is 57. From the responses, the past amount dues have a range of 387, while the current amount due has a range of 454. The descriptive also shows that the minimum balance dues for the past amount is zero 0, and the current amount due is at -130. However, the two variables have the maximum balances of 387 and 324. The average/ mean of the variable presents a standard error of 8.170 for the past due amount and 10.0130 for the current amount dues. The descriptive from table 1 provides an overview of the performance of the companies based on the past and current amount dues. Therefore, when making calls in the future, the regional call center can advise clients on how to recover the amount dues.
The descriptive presented in table 2 is crucial when analyzing the two variables. The standard deviation and variance help evaluate the probability and efficiency of the variable in the data set. The standard deviation shows how data is spread out from the mean. A lower std deviation indicates that the data points of the variables are close to the mean; hence the past amount dues 61.686 is closely spread to the mean of the data set. Arguably, the current amount dues of 75.596 show that the data points are spread over a wider range of values.
Descriptive Statistics for the Past Due Balances
Descriptive statics can also be conducted for a specific variable to determine its relationship with the objective of the study. The descriptive analysis of the past amount of dues presents historical information on the accounts of the specific companies; from tables 3 and 4 below, the description of the amount balance help in making decisions to manage the account balances. The mean of the past balance dues, as presented in Table 3, is 23.96, and this shows the average account balances for different companies in the region.
Table 3: Descriptive for Past Due Amount
Table 4:Descriptive for Past Due Amount
Coefficient of Variation for the Current Account Balances
Coefficient of variation (CV) is the significant statistical output that shows a statistical measure of the relative dispersion of data in a given data set. In this case, the coefficient of variation will help in determining the current account balances needed by the companies in order to operate effectively. The data series used in analyzing the coefficient of variation revolves around the mean of the variable hence making the user effectively determine the state of their business performance.
The coefficient of variation for the current account is analyzed using ratio statistics as presented in tables 5 and 6 below. From the output presented by the data, it is evident that the analysis relied on the use of non-negative values in the numerator variable and positive values in the denominator. The total number used in the analysis of the coefficient was 57 responses, out of which four were excluded, as presented in table 5. The current account balance has a coefficient dispersion of 0.825 and a coefficient of variation for median catered of 115.5%. The CV for the current account balances is too high, and this is not advisable for a company. Therefore, there is a need to have reviews at the regional level on how to manage the current dues at the regional level.
Conclusion
Statistical analysis presented in this report helps in developing critical decisions on how to manage business transactions in the region. The statistical data output presented in this report is essential in decision-making. The bar graphs presented in the report helps in analyzing the relationship between the account balances and the respective accounts of the clients. Descriptivism also provides the numerical analysis of data using mathematical tools such as mean median, standard deviation, variance, and kurtosis. Therefore, it is required of the region to have good data analytical personnel that will help in interpreting data.
Table 5: Coefficient of variation Count
Table 6:Coefficient of Variation
References
Arani, N., Karrabi, M., & Mohammadzadeh Moghaddam, A. (2022). Observational and statistical evaluation of factors affecting traffic noise: A case of tourist, pilgrimage and business area. Applied Acoustics, 193, 108750. Web.