Introduction
The accessibility of goods and services is among the key determinants of how effective the economy of a certain state currently is. Specifically, it shows what amount of a particular product is available to the population and what those can afford. These parameters are directly dependent on supply, which, in turn, is the result of so-called production decisions that the manufacturers and providers make under specific circumstances. The latter may include changes regarding the resources that a firm can utilize for production as well as the competition in the sphere in which it performs.
The paper seeks to examine two basic mechanisms that regulate the supply of goods and services. Notably, Part 1 defines the concepts of inputs and costs, describes the existing types of those, and explores their influence on production decisions. Part 2 introduces the notion of perfect competition and investigates the impact that it can have on the supply. For better representation, the paper involves visual materials and refers to a range of phenomena in the economy of the United Kingdom as examples.
Part 1
Such notions as inputs and costs stand for the resources that a manufacturer or provider is able to invest in the production of a certain good or service. The umbrella term of inputs encompasses non-financial assets, while costs are the necessary monetary investments; simply stated, the latter are the expenditures on the former. Inputs are possible to group into four basic categories, notably, labour, capital, land, and materials (Young, 2021a). The relationship between the quantity of those and of the output is referred to as production function (Krugman and Wells, 2020). Output, that is, the result of the performance of a firm, depends directly on how appropriately it uses the available resources.
Influence of Variable Inputs on Production Decisions
Both the inputs that do not change within a short term and the costs that a firm has to pay for them are possible to characterize as fixed. A good example of those is capital, such as the machinery, equipment, or buildings that the firm owns or rents (Young, 2021a). The expenditures on the assets of this kind do not correlate with the quantity of the final product. Meanwhile, other costs, such as personnel wages, can vary in short periods, sometimes considerably. The sum of fixed and variable makes so-called total cost, which means the expenditures on producing a given quantity of the output and grows linearly together with it, which is apparent from the below diagram.
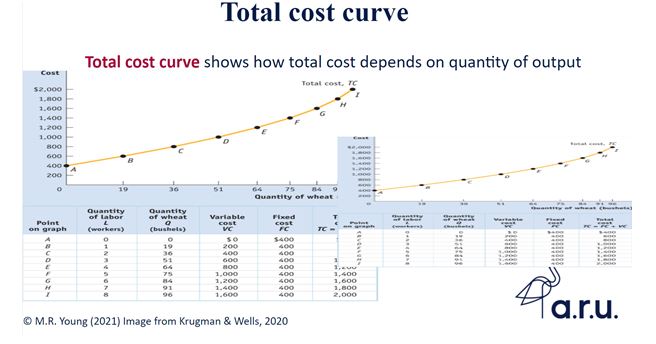
The given graph illustrates that the amount of labour force, which is another variable input, has to increase as well in case of the need for adding to the output. Human resources are an essential contributor to the firm’s productivity, as labour actually is the engine of production process. Therefore, a scarcity of sufficiently competent employees can make manufacturers and providers reconsider their production policies.
The most frequent solutions are to hire less-skilled workers and/or to reduce the planned outputs, focusing solely on the most critical tasks. For instance, construction sphere in the UK was experiencing a severe shortage of competent engineers in 2014. Specifically, the amount of people that had left the industry since 2008 equaled 400,000, which led to an approximately 20% scarcity (Wall, 2014, para. 15, 17). Firms consequently were bound to abandon their building targets, being physically unable to provide the population with sufficient quantities of affordable dwellings.
A surplus of workforce, to the contrary, is neither desirable, as it leads to a loss of efficiency. Notably, as also apparent from Figure 1, the increase in the output becomes less substantial with every new worker. The term to describe that increase is marginal product (Young, 2021a). While it shortens, the costs grow because more employees require more spending on wages. To avoid losing profit, firms decide to limit the amount of staff, which results in unemployment and redundancies, especially of semi-skilled people. Thus, in 2011, the rate of the British between 16 and 24 years of age who had no job reached 20% (The stories and faces, 2011, para. 3). Normally, the situations of this kind alternate with the appearance of new workplaces because new firms develop, but in a crisis, mass unemployment may last long.
Influence of Variable Costs on Production Decisions
An example of variable costs is the prices for the raw materials that the manufacturer or provider utilizes in production process. It is worth noting that an output of one firm frequently is an input for the other, for instance, aluminum for a smelter and for an aircraft assembly plant, respectively. Therefore, supplies of variable inputs frequently are dependent on decisions that their producers make.
As said above, variable costs are a component of the total cost; the latter therefore fluctuates together with them. Meanwhile, the profit, which any firm seeks to maximize by definition, is inversely proportional to the total cost, or, more specifically, the result of subtracting it from the total revenue (Krugman and Wells, 2020). In accordance with the given algorithm, an increase in variable costs reduces the profit, which as another essential driver of production decisions. Those normally lie in rising the prices, as the total revenue, on which profit is directly dependent, results from price per unit of the output.
One of the most common instances presumably is petrol price fluctuations, whose consequences are rising or falling prices in other spheres. Specifically, firms have to pay more for delivery of inputs from their suppliers and/or their final products to their customers, which makes it necessary to compensate for the unwanted expenditures. Thus, retailers that purchase certain items and resell them to the population normally raise their prices accordingly to those for petrol. Among such cases is the growth in fuel prices in the UK in 2010-2011 that apparently is one of the reasons for the rising costs of alcohol, furtinure, and restraurant food (UK inflation rate, 2011). Furthermore, petrol itself can be a good to sell, for instance, for garages, the most expensive of which charged up to 130.9p for a litre in April 2010 (Insley and Smithers, 2010, para. 11). The root of those phenomena presumably was the worldwide increase in the price for crude oil.
Short-run and Long-run Inputs and Costs
It is worth noting that classifying inputs and costs as fixed or variable is valid solely within a relatively short period, as all of them theoretically are able to change with the time. For instance, rental fee normally does not fluctuate from month to month but may be raised by the decision of the owner. The graphic presentation of long-run (LR) average total cost therefore looks different from its short-run (SR) equivalent, as apparent from the following diagram.
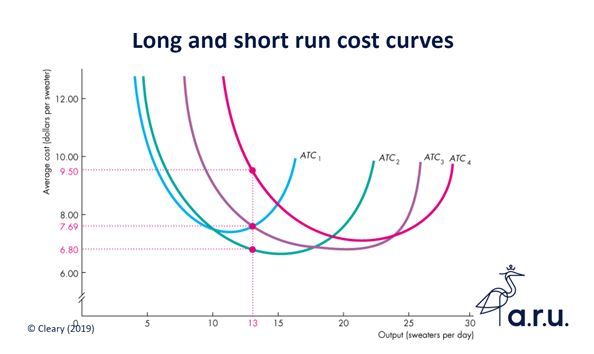
The graph shows that LR curves are flatter in comparison with SR and fall below them, which happens for the following reasons. The fixed cost decreases with the growth of the output since it is inversely dependent on its quantity. Simply stated, the sum, which is the dividend, remains unchanged while the amount of units produced, the divider, grows (Young, 2021a). Visually, this looks as a downward trend that is more apparent over the longer term. Later, however, the costs begin to vary, for instance, equipment needs maintaining or replacing, personnel wages, rental fees, or taxes grow because of inflation, and other, which causes an upstream tendency.
Marginal Cost
Marginal cost means that of producing an additional unit of the output. It is calculated as the change in the total cost divided by that in the amount (Young, 2021a). In the short run, this measure decreases since the divider changes while the dividend does not. The subsequent increase in the average total cost, to the contrary, makes it skyrocket; in other words, producing more output becomes expensive. At this stage, firms usually decide to limit expansion and focus on quality rather than quantity to avoid a situation where the costs exceed the revenue, hence bankruptcy.
Part 2
Influence of Perfect Competition on Production Decisions
The notion of perfect competition describes a hypothetical ideal model of the latter. Within it, firms can enter as well as leave the industry without limitations, but cannot influence the market price for their outputs, in other words, are price-takers (Krugman & Wells, 2020). An industry, in which a situation of such a kind occurs, subsequently is possible to classify as perfectly competitive, similar to a market where both producers and consumers are price-takers.
Under such circumstances, market price becomes a reference point for production decisions, as firms have to consider it primarily when calculating the potential profit and searching for ways to maximize it. Selling goods or services below the market price causes an immediate reduction of profitability. In case the price exceeds the market average, consumers begin to opt for competitors, which eventually leads to losing profit as well. Subsequently, firms are to coordinate their price policies with the market average, hence are aware in advance of the revenue per unit of the output.
In a situation of such a kind, the only way to maximize the profit is to control the costs that the firm invests in production. As it has already been mentioned, the definition of the profit is the difference between total revenue and total cost (Krugman & Wells, 2020). Being unable to change the former, firms are bound to focus on the latter, which actually determines the production decisions that are most typical in highly competitive industries and/or markets. Thus, in case the minimum average variable cost exceeds the market price, the firm soon begins to run at a loss and eventually ceases its operation. It is worth noting, however, that decision-making should not consider the non-recoverable previous expenditures, or the so-called sunk cost.
If production continues, it is critical to adjust the quantity of the output to avoid losing profit. In such a scenario, the above notion of marginal cost is considerable as well; specifically, it has to be equal to marginal benefit, which stands for that of an additional unit of the output (Krugman and Wells, 2020). In the diagram below, the optimal point is where the curve of marginal cost runs that of market price, which is horizontal because the participants of the market cannot influence it.
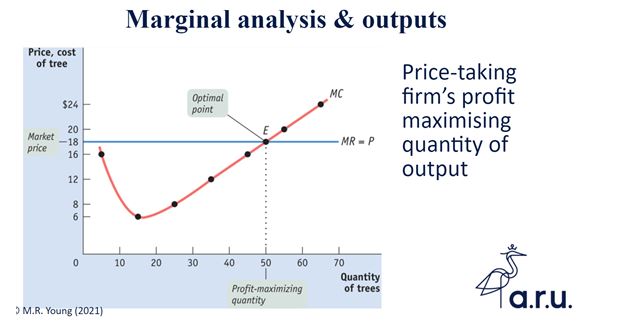
In accordance with the graph, in case a firm continues to expand its production beyond the optimal, the marginal cost rises accordingly. Considering that the market price remains unchanged, this bears a serious threat for profitability and consequently puts the existence of the producer or provider at risk. The most reasonable decision under such circumstances is to shift the focus from adding to the quantity of output.
Short-run and Long-run Supply
As said above, a short run is a period during which at least one category of costs remains fixed. This definition, however, is applicable to a particular firm, while at the industry level, the parameter that does not change in a short run is the amount of producers (Young, 2021b). At the initial stage, each of those expands its production to adjust it to the market price as described in the previous paragraphs. Due to this, the supply of a certain good or service grows stably. The name of the point where it corresponds to the demand is short-run market equilibrium.
A bright example is the growth of the output of the mining and quarrying industry in the United Kingdom, which occurred in 2015. According to Al-Hamad (2015), it rose by 8.6% as compared to same period of the previous year, which made the sphere “the largest contributor” to the total production output of the state (para. 3). The Department for Business, Energy & Industrial Strategy (2019) mentions that the UK added to its both import and export of minerals at that time. This allows assuming the increase in the demand for such goods at the global market, whose predictable consequence was the rising price. To maximize their profits, mining and quarrying firms decided to adjust their outputs to the changes.
To the contrary, long operation in a highly competitive industry makes firms stop increasing the quantity of their output before the marginal cost grows higher than the marginal benefit. On condition that all of the producers have had sufficient chances to enter or leave the market, and none of them currently has an intention to do that, the increase in supply falls. In the graph below, the LR supply curve subsequently is noticeably flatter than the SR. It actually can be completely horizontal, which quite frequently occurs.
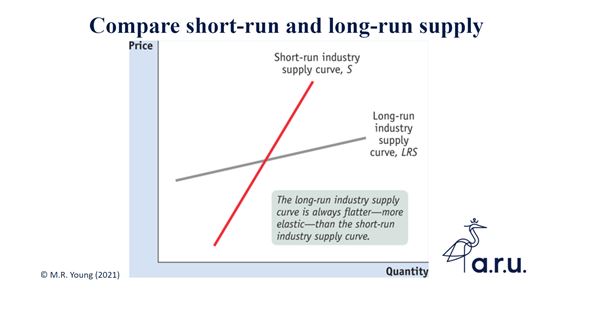
The above increase in the output of mining and quarrying in the UK was short-term as well. Thus, by October 2019, the industry had shown a 2.6% fall after at least three months of downward movement (Stephens, 2019, para. 2). In both cases, the sphere was not the only to be experiencing fluctuations; similar processes were taking place in machinery and equipment, chemicals, pharmaceutical products, and other. This illustrates that any area in which producers or providers have been operating for relatively long time cannot expand as intensively as it did at the initial stages of its development. A graphic presentation of the supply between 2014 and 2019 therefore would be substantially more elastic than its equivalent between 2014 and 2015.
Implicit and Explicit Costs
It also would be relevant to mention the dissimilarity of the approaches that economists and accountants apply to calculating the profit. It is based on the concepts of explicit cost, which presupposes investments, and implicit that does not involve an outlay of money but has monetary value, specifically, that of the foregone benefits (Young, 2021b). Simply stated, the former includes the factors that the firm does not own, such as labour or raw materials, while the latter means the use of financial capital, opportunity costs, and other. The so-called economic profit is the result of subtracting both from the total revenue; accountants, to the contrary, consider solely explicit costs. Therefore, the views of the point at which a firm begins to lose its efficiency differ as well due to the unequal amount of variables to take into consideration.
Conclusion
Production decisions depend directly and strongly on the situation in the market. One of the key factors in the availability of inputs, that is, the resources that a certain firm needs for its operation. In case any of those become less affordable, the producer has to raise the prices for its output to avoid losing profit. Along with this, an excessive amount of labour force compromises efficiency as well because the productivity of every new worker, the so-called marginal product, is lower. Another driver of decisions is the degree of competition in the industry. If it is sufficiently high, firms can enter and leave the market easily but cannot change the market price on their own. Under such circumstances, an increase in the latter enables expansion, while its decrease causes that of the output. Therefore, the intensity of production falls inevitably with the time.
Reference List
Al-Hamad, A. Index of production, UK: September 2015. Web.
Department for Business, Energy & Industrial Strategy (2019) Research and analysis: Mining and quarrying in the UK. Web.
Insley, J., and Smithers, R. (2010) ‘Petrol prices hit record high and could increase even more’, The Guardian, Web.
Krugman, P. and Wells, R. (2020) Essentials of economics. New York: Worth Publishers.
Stephens, M. Index of production, UK: October 2019. Web.
The stories and faces of young unemployment (2011) Web.
Young, M. (2021) Lecture 6: Supply curve, inputs, and costs. MOD3327 Economics for business. Anglia Ruskin University of London.
Young, M. (2021) Lecture 7: Perfect competition and market efficiency. MOD3327
Economics for business. Anglia Ruskin University of London.
UK inflation rate rises to 4% in January (2011) Web.
Wall, M. (2014) Skills shortages holding back the UK’s economic recovery. Web.