Introduction
QSAR analysis for nitroaromatic compounds is the process through which; these nitrogenous compounds are exposed in to various conditions under which they undergo different mutagenic reactions resulting in to reduced compounds referred to as hydrolamines. On this context therefore, throughout the process of reaction, the nitroaromatic compounds correlate with their mutagenic activity resulting into yielding of molecular energy. More specifically, during such reactions, the determination of the energies of the respective LUMO and HOMO molecular orbital is necessary which would thereafter provide a basis a comparison between the two reactions (Benfenati, 2007).
QSAR 1 analysis using log TA 100 and log P
Generally, in any reaction involving nitroaromatic compounds; QSAR are established using regression analysis of the variables involved. On this basis therefore, QSAR 1 results can be used to deduce that; log TA 100 is likely to correlate well with just log P because any change in log TA 100 results in to a corresponding change in the log P. However, this correlation between the log TA 100 and log P is negative as any increase in the log TA 100 leads to a decline in the log P which even to negative values (Devillers, 2009).
More so, from the QSAR’s 1-3 the multiple R undergoes an activity which is satisfactorily with various individual properties. As it has been observed, correlation coefficient 0.6 is the best as it gives the lowest negative value among the other correlations indicating that; the reaction will have yielded the best results possible. Further, the multiple R has strong correlation with log P, LUMO and EUMO reactions which results in to the ultimate correlation of the three variables (Benfenati, 2007).
The correlation of EEUMO and ELUMO
Perhaps from QSAR’s 1 and 4 the quadratic function of P is not better than a linear function because, as it the outcome depicts; the representation of the results using the quadratic function of log P and linear function would give similar interpretation. More precisely, the use of the quadratic function of log P and the use of linear equation would have no difference in giving the inference over the reaction involved (Devillers, 2009).
In addition, for QSAR’s 4 and 5 a correlation with EEUMO is better than E HOMO because from the observations made in the experiment, the reactants involved have the lowest negative correlation coefficient which definitely indicates a better correlation in EEUMO than as it is in E HOMO. Meanwhile, the F stat is affected in various ways in which the significance of the correlation is largely determined by the size of F. For instance, the F stat in the reaction involved is affected by the amount of reactants involved and the conditions under which the reaction is taking place like the pressure and the temperature levels (Benfenati, 2007).
Ring structures with more than two fused rings
As it could be observed, some particles were poorly predicted because they can be seen to lie far from the line prediction. For example, the particles of 1-chloro-2, 4-dinitrobenzene and 2-nitro-9, 10-dihydrophenanthrene can be observed to have a significant difference in the predicted and the observed values of correlation. It was also found that various ring structures had more than two fused rings of various kinds in which they shared edges (Devillers, 2009).
On assigning a value of I=1 for each of these and I=0 for the other systems, majority of the molecules with I=1 predicted were more active than found experimentally. On the other hand majority of those molecules with I=0 predicted to be less active than found experimentally. Perhaps, the incorporation of the indicator value helps to improve the correlation to a greater extent whereby, the variables involved would exhibit a better and a more eligible degree of reactivity. For example, when NH-OH is exposed to sulfotransterase it gets oxidized to NAc-OSO3H which gives a higher value of correlation coefficient than without the indicator (Benfenati, 2007).
Further, the findings discussed above can also be explained in terms of the type of Salmonella typhimurium strain used in the experiment. As it was observed the strain contains nitroreductose which activates in to groups at various rates in different conditions. From the experiment, the strain was observed was induced to intercalate with DNA by various substances (Devillers, 2009).
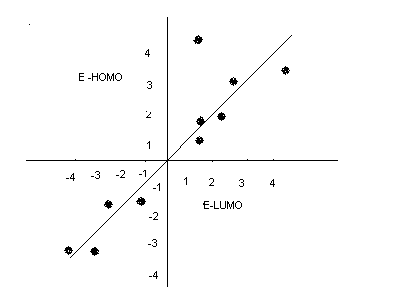
Comparison of EEUMO and ELUMO reactions
From QSAR 7 the inclusion of E HOMO improves the quality of the fit as it can be seen that, the correlation becomes better with the inclusion of the E HOMO. Generally, the E HOMO inclusion in the reaction helped to improve the quality of the reaction which further enhanced the achievement of better results which were easy to interpret. The graph below shows the comparison between the ELUMO and E HOMO (Benfenati, 2007).
Conclusion
From the graph it can be seen that, EEUMO and EHOMO are inversely related in the sense that; an increase in the E HOMO leads to a consequent decrease in the ELUMO and vise versa. Generally, the results obtained can be used to predict the results of another related activity by studying closely the effect of each input on various variables and the output obtained. On this basis therefore, the results obtained can thus be used to predict the outcome of any other related reaction.
Reference list
Benfenati, E, Quantitative Structure-Activity Relationships (QSAR) for Pesticide Regulatory Purposes, Elsevier Science Publisher, London, 2007.
Devillers, J, Endocrine Disruption Modeling (QSAR in Environmental and Health Sciences), CRC Press, New York, 2009.