Recent economic analysis of real wages in the United States over the past four decades shows that there has not been a meaningful growth in income despite the yearly adjustments of salaries and wages (Tyler, 2018). The annual increase in wages of American workers does not demonstrate an actual improvement in the purchasing power. Inflation and other socio-economic factors that affect the price of products have a direct impact on workers purchasing power. The topic of this research focuses on analyzing trends in real wages over time in the United States. The rationale for this topic is that many employers in the country find it difficult to make a meaningful adjustment to the salaries and wages of their employees to reflect the cost of living at a given time. Many of these employers offer an annual increase in salaries because they are ethically and sometimes legally (based on the national minimum wage) bound to do so. Wolff (2016) explains that very few employers in the country factor in the cost of living when adjusting their pay.
The yearly inflation erodes the little pay rise that local employers offer. It means that the purchasing power of American workers is not changing over the years despite the perceived increase in living standards. It is important to address this issue to make American employers understand that they have a responsibility to their workers. As their profits continue to increase, workers paycheck should reflect changes in the cost of living. They should be rewarded based on the work they are doing and their capacity to meet the economic needs. Kirsch and Braun (2016) note that for some people, the real wage has been going down over the years. With the increasing cost of living, they have no option but to take two or three jobs a day to make ends meet.
The paper is organized into various sections. The first part, which is the introduction, provides a background to the topic and the rationale for conducting the study. The second part is a detailed review of the literature. The next section focuses on a review of relevant theories that can help in understanding the topic. The next part is a detailed empirical analysis. In this section, the researcher provides a detailed statistics of the issue under investigation by looking at the numbers and what they mean. The last section is the conclusion, which reiterates the findings made in the report. The paper also has an abstract which summarizes the content of the report.
Literature Review
In this section, the focus is to review the existing literature relevant to the research topic. According to Bolt and Luiten van Zanden (2014), the issue of trends in real wages in the United States has attracted the attention of many scholars for the past several years. High earners continue to earn higher salaries whereas the low-income earners continue to struggle to meet the basic needs. The gap between the richest and the poorest continue to widen (Piketty, 2015). It was necessary to review what others have discussed on this issue to understand the primary factors that define the trends in real wages.
America’s Illusionary Income Growth over Time
According to Case and Deaton (2017), the United States has the largest gross domestic product in the world, and the trend has remained relatively the same over the last six decades. The average purchasing power of its citizens is also relatively high. The government has been keen on adjusting the minimum wage American companies can pay to its employees. The federal minimum wage in the United States was $ 7.25 per hour in 2015 (Case & Deaton, 2017). However, each state has its minimum wage based on its legislation. Washington has the highest minimum wage set at $ 11.50 whereas states such as Georgia and Wyoming are still struggling to meet the minimum standards set by the federal government (Case & Deaton, 2017). According to Bolt and Luiten van Zanden (2014), employers in the country have shown commitment towards maintaining the pay of their employees at levels set by the government. It means that when the average income of Americans today is compared with that of 1960, there is a significant difference. In fact, over the last six decades, the minimum wage for Americans has doubled (Elsby, Shin, & Solon, 2016). It is an indication of the progress the country is making towards improving the living standards.
Stiglitz (2016) explains that when statistics on an average income of Americans is reviewed without factoring in the impact of inflation on the cost of living, one can make a wrong conclusion that there is a positive trend. Wolff (2016) argues that there is a consistent increase in salaries in the country every year. However, that does not reflect the purchasing power of Americans. Inflation erodes the additional pay that local workers get after the rise in salaries. According to Elsby et al. (2016), tax increase, the high cost of fuel, the demand to adjust salaries upwards on a yearly basis, and many other factors that affect the cost of production forces companies to adjust the price of their products upwards.
The average cost of a house in 1960 was just $ 12,700. The same now costs over $ 230,000. The cost of a new car was $ 2,600 in 1960. A car that offers the same value today is over $ 32,000. The average price of bread in 1960 was $ 0.22, but now it costs almost $ 2.00 (Case & Deaton, 2017). The trend shows that there is a consistent increase in the cost of living in the United States. The value of the dollar is decreasing, and residents are struggling to ensure that their families have the basic needs. The argument that the average real wage for American residents is increasing is an illusion. For every increase in pay per year, there is an equal upward trend in the cost of all basic and luxury products. As Bolt and Luiten van Zanden (2014) explain, life continues to be more challenging for the American population.
Income Gap and the Growing Irrelevance of Trade Unions in Negotiating Wages
The income gap in the United States has been consistently on the rise over the past six decades. According to a report by Elsby et al. (2016), the mean real annual household income in the United States for the least earners (the last 10%) was about $ 12,000 whereas that for the highest earning households (the first 5%) was about $ 36,000 (Case & Deaton, 2017) in 1965. It meant that those at the top earn about three times as much as those in the bottom of the pyramid every year. The trend has changed significantly. A report by Stiglitz (2016) shows that in 2016, the average earning for the bottom 10% is about $ 12,500 whereas the top 5% of households earn $ 375,000 (Case & Deaton, 2017). It means that within the last five decades, the difference between earnings of the top and the bottom of the pyramid has increased from $ 24,000 to over $ 360,000. It is unfortunate that the status of the weak continues to deteriorate whereas the powerful continue to earn more. Piketty (2015) explains that the trend is not expected to change any time soon even with various strategies that the government is trying to implement such as progressive taxation system.
Stiglitz (2016) believes that the collapse of employees’ unions is caused by the huge pay gap between the rich and the poor. In the past, wages were negotiated based on employee’s salary scales. Unions were powerful and could negotiate better pay for their members. The least-earning workers had to rely on trade unions to fight for salary increase. They had a strong influence on those who won election to be leaders of labor unions. In those years, there was a deliberate attempt to ensure that there was a standardized approach to increasing salaries of employees (Elsby et al., 2016). The trend has been changing rapidly over the last two decades as companies struggle to recruit and retain highly talented employees. According to Wolff (2016), competition in the market is getting increasingly stiff, and firms are under pressure to embrace different approaches to production that are efficient. Creativity and innovation are critical tools that define the level of success of firms in the modern business environment.
Companies such as Facebook, Google Inc, General Electric, Microsoft Corporation, and Apple Inc have remained successful both locally and internationally because of the creative ideas that they have embraced. These firms have proven that they are capable of monitoring market trends, predict the emerging tastes and preferences, and develop products that meet or exceed expectations of their customers. A firm such as Apple Inc knows when to launch a new iPhone and how to get the most out of such initiatives (Case & Deaton, 2017). To achieve such a high level of efficiency, a firm needs a team of highly talented, creative, knowledgeable, experienced, and committed employees. Finding workers with such qualities in the job market may not be easy (Piketty, 2015). As such, employers are willing to spend a lot on their top talents to avoid cases of talent poaching by the rival companies.
According to Elsby et al. (2016), the changing dynamics have redefined the approach that these firms use to define wages of their employees. Education and unique skills have empowered the top earners. They no longer need to join the membership of unions to get salaries they want. In fact, Stiglitz (2016) explains that unions are now irrelevant in negotiating for their pay. Talented workers believe that their unique skills and capabilities can define how much they earn. Companies have come to appreciate the importance of paying their workers based on the value they add. The worst affected groups under the new system are the semi-skilled and unskilled workers in the job market. When a company offers to pay an employee an annual salary of $ 450,000 because of his or her unique value, other workers considered less strategic may get a reduced or stagnated pay. The ease with which these employees can be replaced makes the employers comfortable as long as they meet the legal minimum pay set by the state (Case & Deaton, 2017). In the past, labor unions would fight for their right. However, that is no longer the case. When a company pays its employees the minimum wage set by state, labor unions would lack a legal ground to challenge the pay. They will have no solid grounds to organize industrial actions to force employers to increase the pay. Stiglitz (2016) explains that in such cases, labor unions are left with little or no options.
Most of the low-earning workers no longer find labor unions relevant in championing for their right. When they are members, they have to pay the subscription fee and any other legal deductions to the unions. However, the unions have become too weak and almost irrelevant in fighting for the interests. Many do not find it illogical to subject their minimal pay to further deductions without having the benefits they desire. Elsby et al. (2016) argue that labor unions that were once powerful in the 1950s, 1960s, and 1970s are slowly losing their relevance among the top and bottom earners in the United States. Some middle-income earners are members of the unions because of the fear of arbitrary dismissal from their jobs. That function is also shifting from the unions to the country’s legal system. The courts are capable of addressing such injustices, further reducing the need to have a membership in such organizations. Their disappearance means that every American worker has to fight his or her battles in the race to increase the real annual wage. In such a race, the highly educated professional white men tend to be winners, whereas the unskilled semi-illiterate Hispanic or African American woman is the most disadvantaged (Case & Deaton, 2017). Poor households are expected to suffer more in the future if the current trends continue.
Theoretical Analysis
According to Beeghley (2016), trends in real wages in the United States cannot be explained using a single theory. When focusing on the theoretical concept to explain the phenomenon, it is necessary to use multiple theories to address the existing shortcomings of each other. According to Beeghley (2016), “the U.S. economy has experienced long-term real wage stagnation and a persistent lack of economic progress for many workers” (p. 78). A small fraction of highly skilled and talented individuals have been enjoying a massive increase in the real wage over time. However, that of the majority (the median income) is not significantly changing when inflation is taken into consideration. The following are some of the theories that can help in explaining the phenomenon.
Free Markets Theory
According to Wolff (2016), this concept is used in economics to define factors that determine product prices in the market. It holds that in a free market, products prices are determined by forces of demand and supply. When the demand for a product is high, the price will subsequently increase. On the other hand, when the demand drops, the price will decrease. The same trend has been witnessed in the United States job market. Stiglitz (2016) explains that as long as semi-skilled immigrants, especially those from South and Central America, continue to come to the country, the average pay for the lowest cadre of employees will stagnate. Many firms will have no reason to hire American-born workers who demand high pay when immigrants are willing to accept lower pay for the same job. Logically, companies will try to lower their production cost by hiring less costly workers. On the other hand, the demand for highly talented and skilled workers continues to increase. As the market in various industries becomes stiffer than before, companies are under pressure to hire the best workers, even if it means increasing their pay beyond what other rivals offer in the market. The more companies fight to recruit and retain the best workers, the more real wages for such employees are likes to rise in the coming years.
Marginal Product Theory
According to Belman and Wolfson (2014), the marginal revenue productivity theory of wages can help in understanding the stagnation in the real wages among the average American workers. The theory holds that firms often pay wages at a rate that is equal to the marginal revenue product of labor (Beeghley, 2016). Companies are often keen on increasing their revenues by reducing the cost of production as much as possible. The theory can help in understanding two concepts in the labor market. First, it explains why firms are focused on maintaining a lean workforce. They only hire workers when it is necessary to do so and are assured of the marginal revenue that would be generated from the additional cost of labor. As firms continue to have a lean workforce, more people find themselves out of employment. Using the demand and supply concept, there will be a greater supply of labor than is demanded in the market.
When the supply exceeds demand, prices tend to drop (Belman & Wolfson, 2014). In this case, as more workers find themselves jobless in the country, they become willing to accept the minimum wage that can be offered to them. The theory also explains why most companies, and a number of states, are reluctant to increase the minimum wage beyond what has been set by the federal government. In the spirit of maximizing profits, firms will tend to offer the least acceptable wage to their workers. Whereas those who mean so much to the company are offered higher pay to keep them motivated and convince them to stay, others who can be easily replaced are offered the least possible pay because they are less likely to leave the company if other firms are offering the same pay. In case they leave. Their replacements will be found within a relatively short time.
Empirical Analysis
Trends in Real Wages
In this section, the focus will be to compare how independent variables (academic qualifications, gender, and race) affect the dependent variable (wages). According to Case and Deaton (2017), the United States is one of the countries with relatively high wage rates around the world. However, when the cost of living is factored in, Wolff (2016) explains that it becomes evident that the country is not performing better than other developed economies such as Denmark, Norway, Luxembourg, and Switzerland. When adjusting salaries and wages of employees, Stiglitz (2016) advises that the guiding principle should be to focus on the purchasing power. The primary goal of such adjustment should be to increase the purchasing power of the employees over the years. However, that is not always the case, as Beeghley (2016) observes. Most of the adjustments made by employers across the country are meant to meet the minimum legal requirement and to create an impression that the firm is keen on promoting the living standards of its employees. According to a report by Wolff (2016), although paychecks have been increasing consistently in this country since 1964, the real wage has not changed meaningfully over the same period.
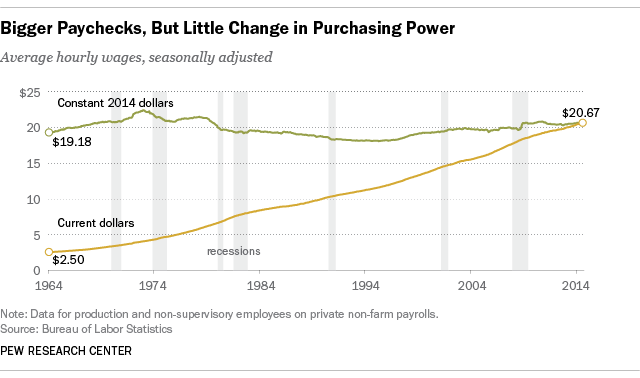
As shown in the figure above, employers have remained committed to increasing the minimum pay for their workers as required by law. In 1964, the average hourly wages in the country was $ 2.5. In 1974, it increased to $ 4. The graph shows a consistent increase in hourly earnings of Americans since then to 2014. The figure above shows that in 2014, the average hourly wages was 20.67. It is evident that from 1964 to 2014, the average hourly earnings for Americans have increased almost 10 times, from a paltry $ 2.5 per hour to $ 20.67 per hour. When the information are analyzed without critically understanding the change in the purchasing power, then one can make a wrong conclusion that the country is registering impressive performance in increasing the living standards of its people. However, when the $ 20.67 that workers earned in 2014 is compared with the $ 2.5 earned in 1964 in terms of what can be purchased, it is evident that there has been no meaningful change.
When the value of the dollar is adjusted based on inflation, the data in figure 1 reveal that the average earnings of American workers in 1964 was about 19.18. It peaked in 1972 when it was about $ 22 (based on the value of the dollar as of 2014). Since then, there was a consistent decline from 1973 to 1995 to below $ 20. It means that wages of an American worker were worth more in 1972 than it was in 1995. From 1996 to 2014, there was a sluggish growth of the real wage. In 2014, it was 20.67. It is necessary to note, from the statistics above, that the real average hourly wages in 2014 ($ 20.67) is less than what it was in 1972 ($ 22). As employers struggle to adjust the salaries of their employees upward, little change is experienced in the actual buying capacity of the American workers.
According to Belman and Wolfson (2014), it is necessary to evaluate the household income for Americans over time to define their purchasing power. Some families have both partners in gainful employment whereas in other families only one partner is responsible. Case and Deaton (2017) explain that families that have both partners working have relatively higher household income than those where only one partner is in gainful employment. Figure 2 below shows the mean household income of Americans by quintile and top five percent.
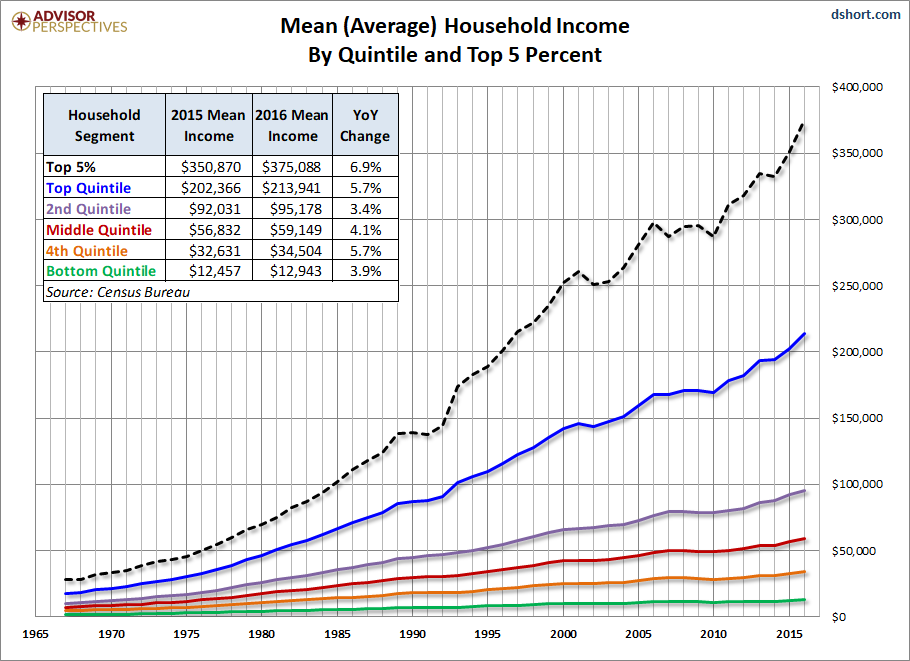
Figure 2 below shows that the mean household income for Americans varies based on four quintiles identified above. The first quintile of the top 5% earners received a 6.9% increase in the household earnings from 2015 to 2016. Their income increased from $ 350,870 in 2015 to 375,088 in 2016. The statistics also show from 1965, the earning gap between the top five percent households and the rest of the households has been increasing consistently. It means that the highest paid Americans are getting even higher salaries whereas those in the bottom rank have their earnings stagnating. The earnings of the first 25% of households increased from $ 202,366 in 2015 to $ 213,941 in 2016, which represents a 5.7% increase. The graph also shows that the gap between their earnings and that of lower quintiles is also increasing. The earnings of the second quintile increased from $ 92,031 to $ 95,178, a 3.4% increase.
The earning for the bottom five percent increased from $ 12,457 in 2015 to $ 12,943 in 2016, which represented a 3.9% increase. It is important to note that with a yearly income of $ 12, 943, these families can hardly meet their basic needs (Belman & Wolfson, 2014). Most of these families are headed by single mothers, as Case and Deaton (2017) observe, and a good number are immigrants who recently came to the United States and are struggling to find proper employment. The statistics show a worrying trend. In 1965, the gap between the highest average household income between the first 5% and the last 5% was less than $ 25,000. By 2016, the gap has increased to over $ 385,000. The percentage increase in the household earning of the bottom quintile has been the least from 1965 to 2016 whereas that of the top quintile has been the highest. Figure 3 below shows inflation-adjusted (real) average household income in the United States from 1965 to 2016.
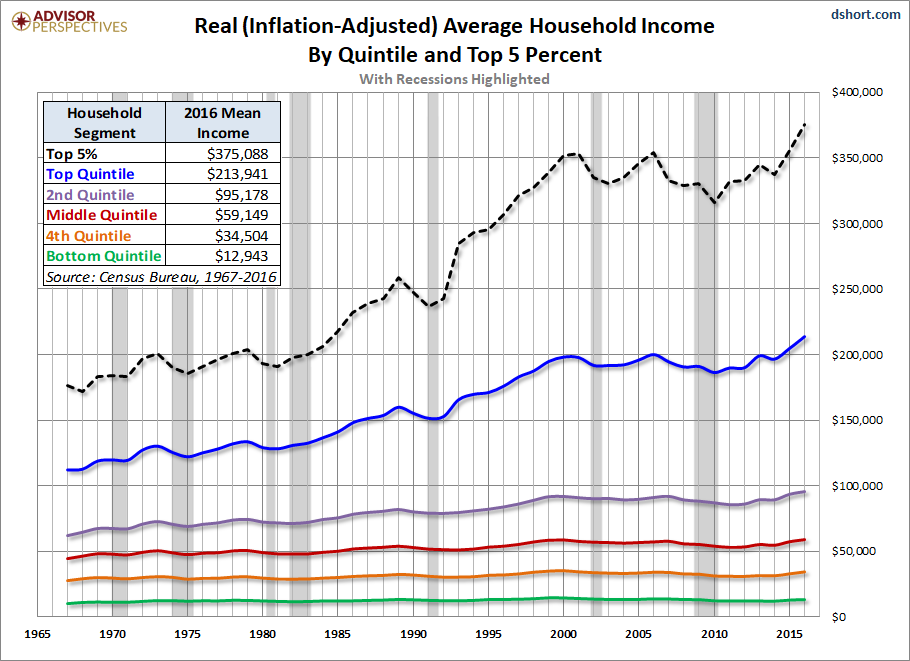
The real average household income of American families shown in the figure above confirms the trend identified in figure 2 above. The top 5% of American households have recorded impressive growth in their real income over the years. In 1965, their inflation adjusted income was $ 180,000. The earning has increased consistently over the years, and in 2016, it reached $ 375,088. It means that in 2016, the purchasing power of the top 5% is almost double what it was in 1965. The same trend is witnessed among the top quintile. However, the rest of the group has stagnated. As shown in the figure above, the inflation-adjusted income for the bottom quintile households was about $ 12,800 in 1965. It increased slightly to $ 12,943 in 2016. It means that the purchasing power of the bottom quintile has not changed significantly over the last 15 years. As the rich enjoy increased purchasing power, the American poorest households are struggling to meet the basic needs. Table 1 below shows a summary of the real household income following declines from peak year.
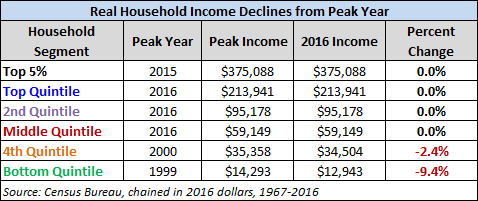
The earning for the top 5% of households peaked in 2015. A year later in 2016, there was no change in the earnings, which represented a 0.0%. The first quintile, the second quintile, and the middle also registered a 0.0% decline. It means that the rich are protected from income declines from peak years. Households in the lower quintiles do not enjoy the same protection. Those in the 4th quintile had a 2.4% decline in their real household income in 2016 when compared to that of 2000. The bottom quintile was the worst hit, as per the recent statistics. Their real household income in 2016 is a 9.4% drop in what it was when it peaked in 1999.
As Case and Deaton (2017) explain, the least earning workers lack proper means of bargaining for better pay other than the minimum wage offered by the government. They can easily be replaced because they are non-skilled workers. When they transfer from one job to another, they are neither guaranteed a better pay or job security (Anker & Anker, 2017). As such, most prefer to stay with their underpaying employers because of limited opportunities. On the other hand, the top talents know that their skills are needed by different employers. They can easily move from one company to the other. Companies are willing to pay such workers high wages as a way of avoiding losing them to other companies. It explains the growing gap between the highest paid households and the least paid households in the United States.
Demographical Pay Gap
When analyzing the real wage trend in the United States, Stiglitz (2016) observes that it is critical to take into account the differences created by demographical factors. The United States is one of the most diverse countries in the world. Years of immigration led to the development of an American society where almost every race on earth is represented. Whites, African Americans, Hispanics, Asians, and the aboriginals are the main races in the country. Although the society has made steps to promote diversity in the workplace, race still plays a major role in defining various employment-related factors. According to Case and Deaton (2017), the change in real wages for men has been different from that of women over time. Stiglitz (2016) explains that it took longer for women to gain acceptance in the corporate world. For a long time, the American society embraced the perception that it was the responsibility of men to provide for their families whereas women were expected to take care of their families. It is necessary to look at how the real wages for both men and women have changed over time. Figure 4 below shows the real average wage trend for women in the United States from 1979 to 2005.
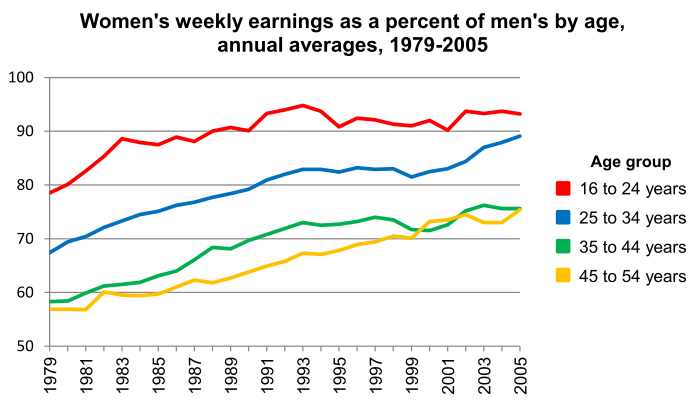
According to the statistics shown in figure 4 above, female American workers earn less than their colleagues. The trend has been sustained over the last several decades despite the massive effort that has been put by various stakeholders to regularize the pay gap. It is evident that female workers aged over 45 years have the biggest gap between their salaries and that of men of the same age. On average, these women were earning almost half what their male colleagues got in 1979. Changes in the environment have made it possible for their earning to improve to about 75% of men’s earning in 2005. Female workers aged 35 to 44 years earn about 60% of the wages of their male colleagues in 1979, whereas that of women aged 25 to 34 years is about 69%. The earning of the two groups improved to 76% and 89% respectively in 2005. Female workers aged 16-24 years have made an impressive performance. In 1979, their earnings were about 79% that of men. It improved significantly to 94% that of their male counterparts in 2005. It is evident, from the statistics that the earning gap based on gender is consistently being narrowed down over the years. The society realizes the need to offer their workers the right salary based on their value to the organization and the cost of living in the society. Workers’ race is another major factor that defines pay gap in the United States. Figure 5 below shows the varying real wage for Americans of different races and gender.
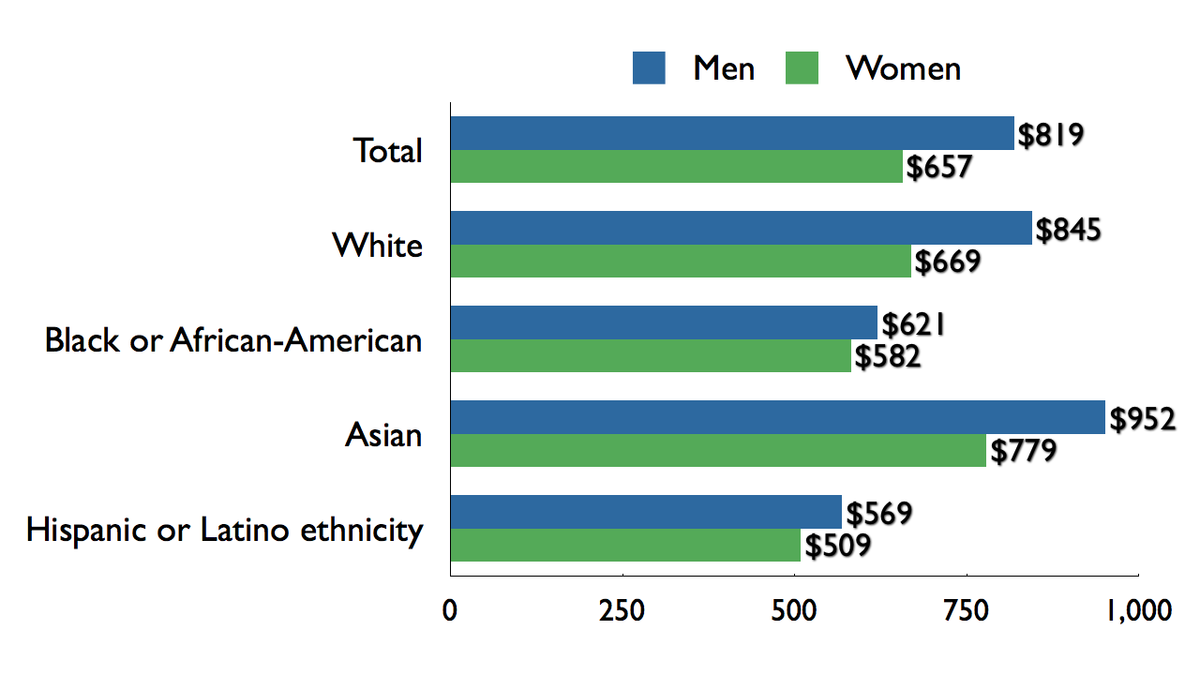
As shown in the figure above, American men were enjoying a higher pay than women. The weekly pay for women in 2009 was $ 657 whereas that for men was $ 819. According to Wolff (2016), there is a shift in the approach to defining wages of workers in the United States. Instead of using a universal approach of defining how much an employee would earn, many companies are now basing their pay on the value of the employee to the company. It means that a newly recruited employee who is 25 years old can earn a higher salary than a 54-year-old colleague in the dame department (Anker & Anker, 2017). The concept of hiring and retaining highly talented individuals is often reflected in the pay. The only way of retaining a talented worker is to offer them improved remuneration. When they are handsomely paid, they are more likely to stay with the company than when they are offered a lower salary. The salary of an employee defines the value that the firm attaches to him or her (Tyler, 2018). It means that most American employers value male over female employees. The perception that men are more committed and capable of delivering better results than women is still common in this society, and it is reflected in the pay gap.
According to Case and Deaton (2017), gender has become a greater defining factor of wages given to workers than gender. The more the country struggles to fight racism in the workplace and its elements, the more it is still reflected in the ease with which Americans can get hired and the amount of money they earn based on their race. American white men earned a weekly wage of $ 845 whereas African American men earned $ 621. The Latino men earned the least, at $ 569 per week. It is important to note from the statistics above that Asian men and women ranked highest compared with any other race. The average weekly pay for an Asian man was $ 952 whereas that of a white American was $ 819. The average pay for an Asian woman was $ 779 whereas that of a white woman was $ 657. It is evident that an Asian woman earns better than an African American man. The statistics may provide a wrong impression that Asians are the best paid in the country. However, that is not the truth, as Stiglitz (2016) observes. The impressive performance of Asians on average pay is attributed to their number and academic qualification. The Asians in the country are fewer than whites, and a significant number of them are working in technology and other blue chip companies as engineers, technicians, and other highly valued employees. The best-paid Americans are whites.
The statistics also demonstrate that the Hispanic or Latino ethnicity is the least paid in the country. That is partly true. However, the real reason why their average weekly-pay in the country is the poorest is partly because of the problem of illegal immigration. Whereas most Asians coming to the United States are highly educated individuals coming to work for blue-chip companies, the majority of Latinos coming to the country are unskilled and semi-skilled people interested in taking blue-collar jobs because of the limited opportunities in their countries (Anker & Anker, 2017). A statistical comparison of the two races shows that whereas numerous Hispanics are earning below average salaries in the country, most Asians earn slightly higher than the country’s average. The African Americans are still burdened by discrimination in the workplace, which makes it impossible for them to get equal pay as their weekly colleagues. Education is another critical factor that defines real wages for the American residents, as shown in figure 6 below.
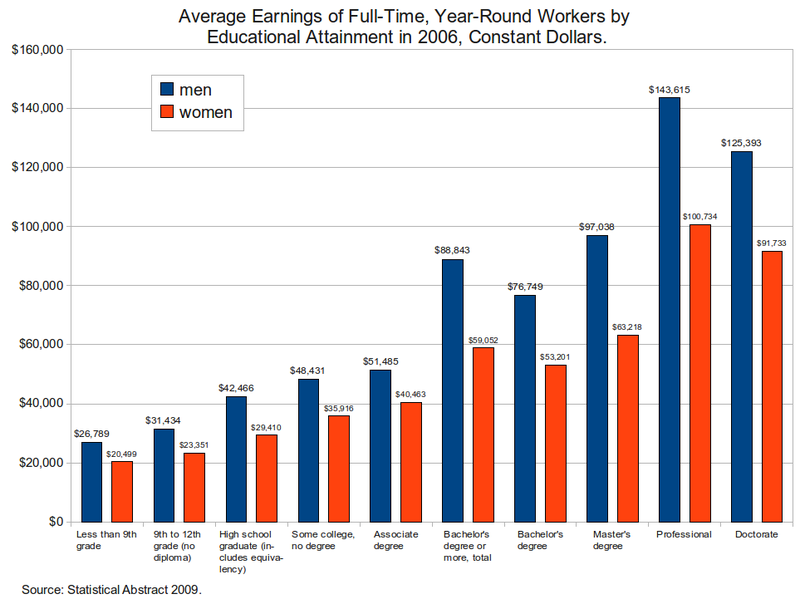
The trend about the gender gap that has been witnessed in the statistics provided above is also demonstrated when analyzing average earnings based on the educational attainment. American residents with less than 9th-grade certificate earn the least yearly income. Men earn an average of $ 26,789 whereas women earn an average of $ 20,499. There is a consistent increase in the earnings of American residents based on their educational attainment. Men with doctoral degrees earned $ 125,393 whereas women with the same qualifications earned $ 91,733 in 2016. The highest-earning Americans, based on academic qualifications, are professionals. They are people who have high academic qualifications and work in the fields of their specialization. They include lawyers, engineers, doctors, architects, and economists among others. Male professionals earned $ 143,615 whereas female professionals earned $ 100,733 in the year 2016. A male professional earns more than six times what a female employee with less than 9th-grade qualifications earns.
Conclusion
The United States is one of the leading economies in the world. An analysis of trends in real wage over the past five decades shows that the country has experienced a consistent increase in the average wage from 1965 to 2016. However, the average pay increase may be misleading if the impact of inflation is not taken into consideration. Real wage analysis makes it possible to understand how earnings of American workers have changed based on the purchasing power. It looks at the possible increase in the buying capacity of workers in the country based on their wages. It is evident that although the average earnings have been increasing over the years, real wages have not improved significantly, especially for the lower cadre employees. The buying capacity of workers who have no college diploma has remained the same over the years. On the other hand, the highly educated and skilled workers have enjoyed a significant increase in their real wages.
Firms are currently keen on rewarding workers with unique skills. The semi-skilled and unskilled workers in the United States can now rely on minimum wage laws in each state to define their pay. As shown in the literature review and empirical analysis, the lower cadre workers have not enjoyed any meaningful increase in the real wage over the past several decades. In the past, labor unions fought for better pay amongst the lowest earners in the country. However, the increasing irrelevance of the unions means that a new approach may be needed to protect the average American worker. One of the best areas of further research is how the country can readjust minimum wage more often based on the impact of inflation. Further studies should also focus on how to empower the lower cadre and average employees in the United States so that they can also negotiate better pay. It will also be necessary to investigate the impact of immigration on the country’s real income over time.
References
Anker, R., & Anker, M. (2017). Living wages around the world. Northampton, MA: Edward Elgar Publishing.
Beeghley, L. (2016). The structure of social stratification in the United States (5th ed.). New York, NY: Routledge.
Belman, D., & Wolfson, P. J. (2014). What does the minimum wage do. Kalamazoo, MI: W.E. Upjohn Institute for Employment Research.
Bolt, J., & Luiten van Zanden, J. (2014). The Madison project: Collaborative research on historical national accounts. The Economic History Review, 67(3), pp. 627-651.
Case, A., & Deaton, A. (2017). Mortality and morbidity in the 21st century. Brookings Papers on Economic Activity, 4(1), 397–476.
Elsby, M.W., Shin, D., & Solon, G. (2016). Wage adjustment in the great recession and other downturns: Evidence from the United States and Great Britain. Journal of Labor Economics, 34(1), 249-291.
Kirsch, I., & Braun, H. (Eds.). (2016). The dynamics of opportunity in America: Evidence and perspectives. Cham, Switzerland: Springer International Publishing.
Piketty, T. (2015). About capital in the twenty-first century. American Economic Review, 105(5), 48-53.
Stiglitz, J.E. (2016). How to restore equitable and sustainable economic growth in the United States. American Economic Review, 106(5), 43-47.
Tyler, G. R. (2018). Billionaire democracy: The hijacking of the American political system. Dallas, TX: BenBella Books.
Wolff, E.N. (2016). Household wealth trends in the United States, 1962 to 2013: What happened over the Great Recession? The Russell Sage Foundation Journal of the Social Sciences, 2(6), 24–43.