
Introduction
Statistics may be regarded as a powerful tool applied when evidence-based decisions require the management of relevant data. Used across multiple spheres of human activity, it presupposes the collection and analysis of information, guided by articulated research questions and hypotheses, to draw meaningful conclusions using simple techniques and either inferential or descriptive approaches.
However, when solving complex problems involving multivariate relationships among variables, the principles and methods of basic statistics may be inapplicable. Therefore, these issues are addressed using advanced statistical techniques, including ANOVA and ANCOVA, cluster, time series, and factor analyses, Bayesian inference, non-linear models, and others. Regression analysis is a method of advanced statistics, and this paper describes its application in advanced research across various spheres.
Discussion
In general, regression analysis is a common set of statistical methods for evaluating interrelationships among factors and predicting their future interactions. It appeared in the early 19th century, due to Carl Friedrich Gauss and Adrien-Marie Legendre, who separately used similar algorithms to calculate the orbits of celestial bodies (Pisică et al., 2022). In the present day, according to Pisică et al. (2022), regression analysis”quantifies the relationships between one or more independent (predictor, explanatory) variables (IVs) and a dependent (response, outcome) variable (DV)” (p. 230). Their correlation is determined mathematically by a statistical model whose parameters are aligned with the observed data. In addition, the use of statistical software helps explain the advanced nature of regression analysis.
To ensure a comprehensive, multidimensional immersion in the examination of the regression concept, it is essential to assess its elements. Thus, a variable may be regarded as a particular object, idea, factor, event, time period, feeling, or any other category type that should be measured and evaluated. In turn, IV is a factor that other variables cannot impact. In turn, regression analysis demonstrates how the IV causes changes in them. Consequently, DV is a variable whose condition depends on multiple other factors. As a result, relationships between IVs and DVs imply the potential of IVs to initiate change in DVs.
In day-to-day human activity, regression is used to address a wide range of research questions. They traditionally refer to “identification of new predictors, estimation of confounder-adjusted causal effects, and prediction of future outcomes” (Pisică et al., 2022, p. 230). While regression’s ability to establish cause-and-effect relationships between variables is questionable, it nevertheless assesses their interaction by examining the significance of the impact.
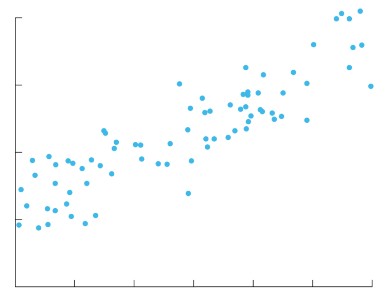
In other words, regression helps assess the statistically significant influence of some variables on others and models their potential future change. Picture 1 presents a simple example of a regression model and illustrates the regression analysis. In it, the x-axis and y-axis consistently represent the IV and DV, respectively, while blue dots indicate their relationship (Pandey, 2020). Finally, the red regression line provides a broader picture of the interconnections between variables and may predict them in the longer term.
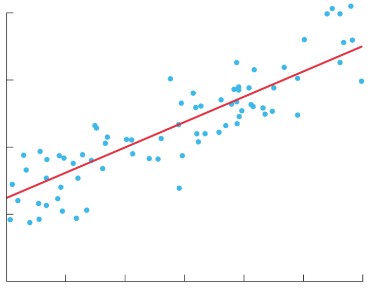
While the model may demonstrate an excellent correlation between two variables, it is essential to recognize that regression analysis does not imply causation. In particular, one or even several IVs cannot be regarded as perfect predictors for a DV, as there may be other factors that impact the latter and were not chosen for the analysis. Therefore, while a link between variables may be viewed as obvious, the assessment of an identified IV’s direct impact on an identified DV requires several analyses to exclude the existence of other sources of influence.
Regression analysis traditionally includes several variations depending on the complexity of data sets. Thus, linear and multiple linear regression are the most commonly used models for detecting and analyzing interconnections among variables. At the same time, nonlinear regression is applied when IVs and DVs demonstrate more complicated nonlinear relationships. In addition, logistic regression is frequently applied when a DV is binary, having two possible outcomes. Finally, polynomial regression indicates that the relationships between IVs and DVs follow a polynomial curve.
As the most commonly applied types of regression analysis, linear and multiple linear regression analysis will be thoroughly explained in the current research. According to Bzovsky et al. (2022), “linear regression is used to quantify a linear relationship or association between a continuous response/outcome variable or dependent variable with at least one independent or explanatory variable by fitting a linear equation to observed data” (p. 1715). In other words, this method is applied when there is one IV and one DV, and the statistical significance of their relationship should be evaluated. Linear regression is calculated with the use of the following formula:
Y=a+bX+u
where:
- Y is the DV that should be measured, explained, or predicted,
- X is the IV used for the association with the DV,
- a is the y-intercept, a constant that represents the value of y if x is 0,
- b is the beta coefficient, or the line gradient that reflects “the change in y, for every 1 unit change in x“, and
- u is the regression residual, which determines the certainty of trust in the formula’s reliability and usefulness in establishing statistical significance.
Multiple linear regression is similar to linear regression and follows similar conditions, aiming to determine statistically significant interrelations among variables. Its major difference is in the analysis of several IVs and their potential impact on a DV. Simultaneously, one should consider the non-collinearity of IVs, as it is a mandatory requirement of the model. It means that these variables should be minimally correlated to establish their actual influence. In turn, if IVs are highly correlated, assessing their relationships with a DV will be challenging for a researcher, and the results will be regarded as unreliable. Multiple linear regression is determined using the following formula:
Y=a+b1X1 +b2X2 +b3X3 +…+btXt+u
where:
- Y is the DV that should be defined,
- X is IVs applied for the association with the DV, and their number refers to the number of variables chosen for the analysis,
- a is the y-intercept, a constant that demonstrates the y value if x equals 0,
- b is the beta coefficient, or a slope that represents “the change in y, for every 1 unit change in x“, and
- u is the regression residual, or error term.
As previously mentioned, regression analysis plays a crucial role in optimizing organizational processes across multiple areas. First of all, it is widely used in business and finance, and forecasting future threats and opportunities is regarded as the method’s most widespread application. In general, this advanced statistical method enables the organization to ensure more stable growth and development by making evidence-based decisions.
For instance, using regression analysis, retailers and manufacturers may predict customer demand, the number of items to be sold, or optimal advertising prices by considering people’s interactions, purchase habits, and other external factors. Insurance companies also use regression analysis to forecast the number of claims over a given period, taking into account various conditions and policyholders’ creditworthiness.
Statistical software for developing regression models is currently used in the financial sector. For example, the Capital Asset Pricing Model (CAPM), which assesses the correlation between market risk and assets’ projected returns, and the evaluation of the interconnectedness between operational performance and corporate returns are applied by financial analysts within the framework of financial analysis.
Moreover, regression analysis assists in strategic planning, risk minimization, and the generation of competitive advantages by evaluating companies’ potential interconnections, as reflected in correlations among their stock prices. Finally, analyzing interactions among internal and external factors helps companies identify existing problems and implement appropriate, responsive measures.
Today, regression analysis is widely used in medicine as part of advanced data analysis. As Bzovsky et al. (2022) state, “when researchers are conducting clinical studies to investigate factors associated with, or treatments for disease and conditions to improve patient care and clinical practice, statistical evaluation of the data is often necessary” (p. 1715). Regression analysis allows the prediction of the influence of specific factors on disease outcomes and the forecasting of the development of illnesses affected by treatment options.
For instance, according to Ghorashi et al. (2023), regression models are used to predict the risk of cardiovascular diseases and to prevent their development by analyzing age, cholesterol, blood pressure, and other factors as IVs. At the same time, it is essential to consider specific conditions and requirements to minimize the risk of improper data collection and interpretation, as invalid results may lead to serious consequences for patients and the health care system.
Meanwhile, it is essential to consider certain limitations of regression analysis, primarily its inability to establish causation. While the impact of IVs on DVs may seem obvious, without additional analyses, the outcomes may be attributable to chance. In addition, the misinterpretation of results may be caused by multicollinearity among variables – in this case, the exact impact of each variable is undetectable. Moreover, regression models may be overly simplistic or overly complex, increasing the risk of invalid results. Finally, regression analysis is often criticized for the inapplicability of its results to real-life situations due to extreme points, constant variance, and independence.
Conclusion
To conclude, in the present day, statistics play a crucial role across almost all spheres of human activity, contributing to informed decision-making based on data analysis. At the same time, simple descriptive and inferential approaches may be inefficient in solving complex problems. In this case, advanced statistical techniques, including regression analysis, are applied. It may be described as the process of evaluating relationships among ideas, concepts, and factors. And items, known as variables. There are changing variables that may be affected by others, and the development of regression models allows for the assessment of their interconnectedness.
The number of variables and the linearity of their relationships determine which regression model is appropriate, including linear, multiple linear, and nonlinear regression. The first two approaches are considered the most common, as they help establish a statistically significant link between factors. However, it is important to take into account the correlational character of regression analysis as it does not establish causation. While factors may be highly correlated, some may be affected by other, unconsidered factors.
Regression analysis is commonly applied across various spheres, including business, finance, insurance, and medicine. It provides multiple benefits for researchers, practitioners, and companies, in accordance with their respective scopes of responsibility. For business and financial organizations, regression analysis helps identify existing problems and develop strategies to address them, generate competitive advantages, assess existing processes and their impact on future growth and development, and forecast consumer behavior and demand.
In turn, within the health care system, data collection and regression analysis help minimize illness occurrence by assessing the impact of social, economic, cultural, and demographic factors on the spread of infections and diseases. Moreover, it is vital to admit the limitations of regression analysis, particularly its inability to establish causation, to avoid misinterpreting the results.
References
Bzovsky, S., Phillips, M. R., Guymer, R. H., Wykoff, C. C., Thabane, L., Bhandari, M., Chaudhary, V., & RETINA study group. (2022). The clinician’s guide to interpreting a regression analysis. Eye, 36(9), 1715-1717.
Ghorashi, S., Rehman, K., Riaz, A., Alkahtani, H. K., Samak, A. H., Cherrez-Ojeda, I., & Parveen, A. (2023). Leveraging regression analysis to predict overlapping symptoms of cardiovascular diseases. IEEE Access, 11, 60254-60266.
Pandey, S. (2020). Principles of correlation and regression analysis. Journal of the Practice of Cardiovascular Sciences, 6(1), 7-11.
Pisică, D., Dammers, R., Boersma, E., & Volovici, V. (2022). Tenets of good practice in regression analysis. A brief tutorial. World Neurosurgery, 161, 230-239.
What is regression analysis? (n.d.). Spotfire.