Abstract
The present report aimed to evaluate the success of a project of drilling ten solar-powered freshwater wells for Qatar Petroleum. The project was completed by Drillserv, a drilling company located in Doha, Qatar. The project had high profitability of 202,940 QR in net income before tax. It was completed within 42 days, which was three days before the customer’s deadline. The report focuses on the analysis of the scope, time, risks, finances, human resources, communications, and stakeholder management. The results of the evaluation demonstrated that even though the project was successful, several critical problems were found in the stakeholder management and risk mitigation practices. The report is concluded with recommendations for future projects of similar scope.
Project Background
Purpose of the Report
The present report aims at evaluating the success of the project implemented by Drillserv in September 2021. The report discusses all the aspects of the project, including its scope, scheduling, budgeting, quality management, human resources, stakeholder management, communications, and risk management. The primary purpose of the report is to understand if the project management decisions and practices were optimal and provide a list of suggestions for improving the effectiveness and efficiency of similar projects in the future.
Project Background
The purpose of the project was to drill ten freshwater wells for Qatar Petroleum as part of the North Field East (NFE) Project. In 2020, state-owned Qatar Petroleum announced that it would dig 80 wells for the NFE project, which aimed at significantly expanding the company’s liquefied natural gas (LNG) output in the coming years (Cocklin, 2020). After drilling the first 40 wells between April 2020 and August 2021, Qatar Petroleum decided to partner with Drillserv, a drilling company located in Doha, Qatar. The aim of Qatar Petroleum was to supply the new production of LNG with fresh water from autonomous water sources. Drillserv offered to drill ten boreholes so that the company’s production would have a sustainable source of fresh water.
Qatar Petroleum, a company with a 50-year old history of success, is responsible for phases of oil and gas industry production and distribution. The company is famous for its high profitability (more than 80 billion QR in net profit in 2018) and strive for environmental sustainability (Qatar Petroleum, 2019). The company has a well-established sustainability strategy that aims at decreasing the emissions of greenhouse gases by using sustainable fuel sources (Qatar Petroleum, 2019). Thus, drilling solar-power boreholes was aligned with the company’s goal to decrease greenhouse gas emissions. Moreover, the wells will be used to supply the production of LNG, which is a more sustainable source of energy in comparison with petrol or diesel.
Drillserv is a relatively small private drilling company that provides all types of drilling services, including freshwater borehole drilling, deep recharge wells drilling, and top-hole drilling (Drillserv, 2021). The company works with both private and public companies and received numerous positive feedbacks from its customers. The company aims at diversifying its revenue streams by partnering with different types of organisations to increase the stability of income. Partnering with Qatar Petrol was in line with the company’s goals and strategy. The project for Qatar Petrol was a very ambitious project for Drillserv; however, it managed to satisfy the client with the provided services.
Project Overview
The start of the project was planned for Monday, August 2 in 2021, and it was expected to last for two months. It was agreed that Qatar Petroleum would pay 500,000 QR for the implementation of the project. The internal cost of the project was 251,160 QR without transportation. Transportation costs were expected to be 1,500 QR during the implementation stage and 600 QR per day during other stages of the project. Thus, the total internal cost of the project was 297,060 QR, which implied that the total profit before tax was 202,940 QR.
The project team included a project manager, a communications manager, a financial manager, and two foremen that supervised the work of installation and drilling teams. The project also used the services of two drilling teams and two equipment installation teams that had five workers in each team. The cost of the equipment was 150,000 QR, and all the other costs were attributed to HR costs and transportations.
The customer’s deadline was 45 working days, and it was initially planned to finish all the operations in 39 days. However, some delays during the installation phase were detected due to the inability to start installing the equipment before finishing the drilling process. The total time spent on the project was 42 working days, which was very close to the customer’s deadline. The project’s timeline is provided in Figure 1 below.
Detailed Project Evaluation
Scope Analysis
The project scope was very well defined in the initial project plan and no drastic changes were made. The project’s actual work breakdown structure (WBS) is given below. According to Burghate (2018), WBS is a detailed breakdown of all the tasks and subtasks that need to be completed before the project end. WBS is crucial for project management as it helps to understand the detailed flow of the project and control the completion of different parts of the project (Burghate, 2018).
Work Breakdown Structure
- Project Plan Development:
- Stakeholder meeting.
- Requirements specification.
- Team Assembling.
- Scheduling tasks.
- Obtaining licenses and permissions.
- Communication system establishment.
- Writing the project plan.
- Project Implementation:
- Exploring.
- Drilling.
- Installation of the pumping equipment.
- Installation of solar panels equipment.
- Dismantling of the equipment.
- Issuing technical report.
- Quality Assurance:
- Equipment’s quality check.
- Constriction quality check.
- Water Quality check.
- Preparing quality report.
- Project Closure:
- Handing over the wells.
- Writing end project report.
The WBS provided above demonstrates that there were four basic deliverables apart from the wells that were the main product of the project. The deliverables included the project plan, technical report, quality report, and end project report. While only 18 tasks were planned initially, it was decided to add an additional element to the WBS (1.4 Scheduling tasks), because the project manager had to synchronise the preferred schedule with the schedule of the drilling and installation teams of Drillserv. However, adding an element to the WBS did not affect the time of delivery of the project, as the project manager was free at the time and could complete the task while the financial manager was obtaining all the needed licenses and permissions to work on the territory of Qatar Petroleum. Thus, it may be concluded that the initial scope identification of the project was adequate and significant changes were made.
Time Management
Time management and planning of the project was marginally adequate as there was very little time left in the original plan in case of any emergencies. It was very concerning that the company had only six days (13.3%) of slack time between the customer’s deadline and the planned project end date. The central problem was that it was allocated only three days to quality assurance. This time was enough only for a thorough inspection. If any problems were to be found, there was no time allocated to fix these problems.
There were two central reasons why Drillserv should have either tried to communicate with the customer for a prolonged deadline or tried to complete all the tasks faster. The first reason for that is the size of the project. The company had no precedents of projects of such size, which may have negatively affected the planning process. According to Dago (2018), one of the most common reasons for the failure of the project is inadequate time planning due to a lack of experience of the project team. Another reason for the concern is the scope of the project. While Drillserv had significant experience in drilling different types of boreholes and wells, the company has never worked with solar-powered stations before. Even though significant research on the matter was done, a lack of experience in the matter could have led to delays or additional costs. These threats are discussed in greater detail in Section 2.8 of the present report.
The project was completed two days before the customer’s deadline, which should be considered as a success of time planning and scheduling. The central reason for the project team’s ability to complete several tasks simultaneously. The project’s schedule was planned using a Gantt chart in Microsoft Project Software. The actual Gantt chart of the project is provided in Figure 2 below.
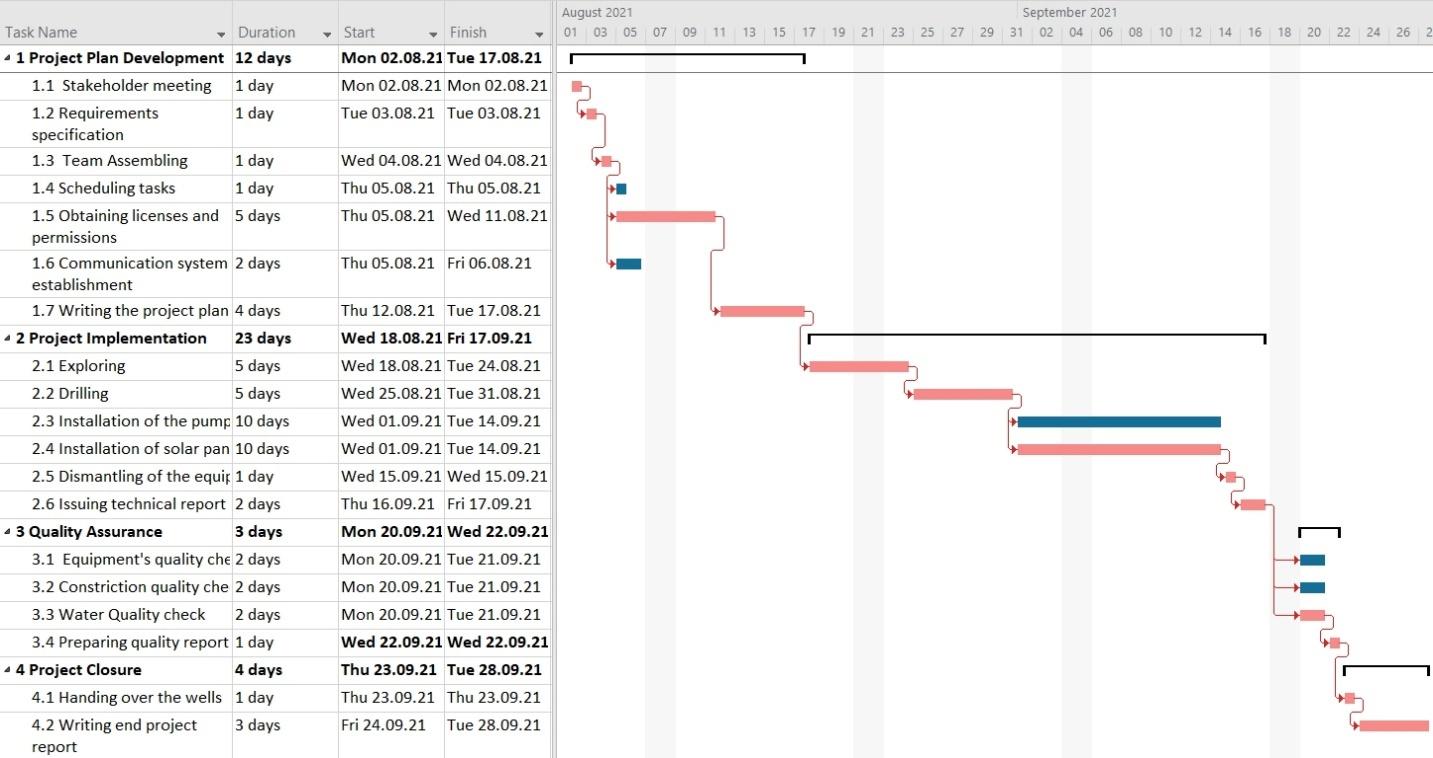
The Gannt chart demonstrates that the success of the project in terms of timeliness is attributed to the project team’s ability to install both the pumping equipment and the solar power equipment at the same time, which required effective coordination and top-class commination. Additionally, the project team managed to complete the quality assurance procedures in three days instead of seven.
The only delay that occurred during the project implementation was the start of the installation process. It was initially planned to start the installation process two days after the start of drilling so that three tasks could be completed simultaneously. However, this would mean that two installation teams and two drilling teams would have to work simultaneously, which would require hiring two additional foremen. Thus, it was decided to start the installations after the drilling was complete.
Financial Management
The project was a financial success, as the total profit was 202,940 QR, which implies that the profit margin was as high as 40.6%. Moreover, the actual budget of the project did not deviate significantly from the planned budget. The differences in budgets are demonstrated in Table 1 below.
Table 1. Project budget
The analysis shows that the project’s budget increased from 292,540 QR to 297,060 QR, which is around 1% deviation. As a result, the project’s cost to benefit ratio was 1.68. According to Usmani (2021), the cost-to-benefit ratio is a vital metric for assessing the profitability of projects. It can be found by dividing the present value of all benefits (revenues) to the present value of all costs (Usmani, 2021). Since the project only lasted for two months, no discounts were applied to the revenues or costs and the ratio was calculated by dividing 500,000 QR by 297,060 QR. Since the cost-to-benefit ratio was above 1.0, the project was expected to be profitable.
While the project was a financial success, the analysis revealed that the costs could be decreased. One of the most unreasonable expenses were transportation costs. In particular, the transportation costs during project plan development and project closure could be reduced significantly. Additionally, the costs could be reduced by finding other suppliers of solar panel equipment. Drillserv had little time to explore the solar panel market and contracted with the first company that was ready to have the solar panels shipped in a week’s time. Further research in the sphere could decrease the cost of materials significantly.
Human Resources
Human resource (HR) management was one of the central concerns of the project. The success of the project depended upon the best selection and coordination of the project staff. According to Adeola and Ganiyu (2020), inadequate human resource management may lead to problems in all other spheres of project management, including scheduling, finance distribution, quality control, and risk management. Since the project for Qatar Petroleum was one of the most ambitious and profitable projects for Drillserv, it was in the company’s best interest to assign the best employees to the project. The analysis revealed that HR management was one of the project’s central strengths, as all the aspects of the project were completed on time and within budget.
The project team included a project manager, a communications manager, a financial manager, a communications manager, two foremen, two drilling teams (5 employees each) and two installation teams (5 employees each). One of the employees specialised in pumping equipment, while the other team specialised in solar power equipment. The majority of employees were sourced from Drillserv except for one of the installation teams, which were hired from one of the company’s partners. The functional structure of the project team is provided in Section 2.5 of the present report.
The quality of the HR practices was the central contributor to the success of the project. The total HR expenses were 101,160 QR, which were given as salaries to all the employees engaged in the project. Without talented managers, qualified and reliable staff, and adequate distribution of the workforce, the success of the project would be impossible. Therefore, the practices utilised in the present project can be used for future projects of this kind.
Functional Organisation Structure
Functional organisation structure is a form of organisation based on the temporary teams designed to perform particular tasks or projects (San Cristóbal, Fernández, and Diaz, 2018). It is a general rule that the complexity of functional organisational structure grows more complicated depending on the scale of the project. The larger the project, the more complicated the functional organisational structure with narrower specialisations of the teams. Previous projects of Drillserv had a fairly simple functional structure that included a project manager, a foreman, and five employees. It was the first time Drillserv implemented a project of such size, which required significant changes in the functional structure. This structure is visualised in Figure 3 below.
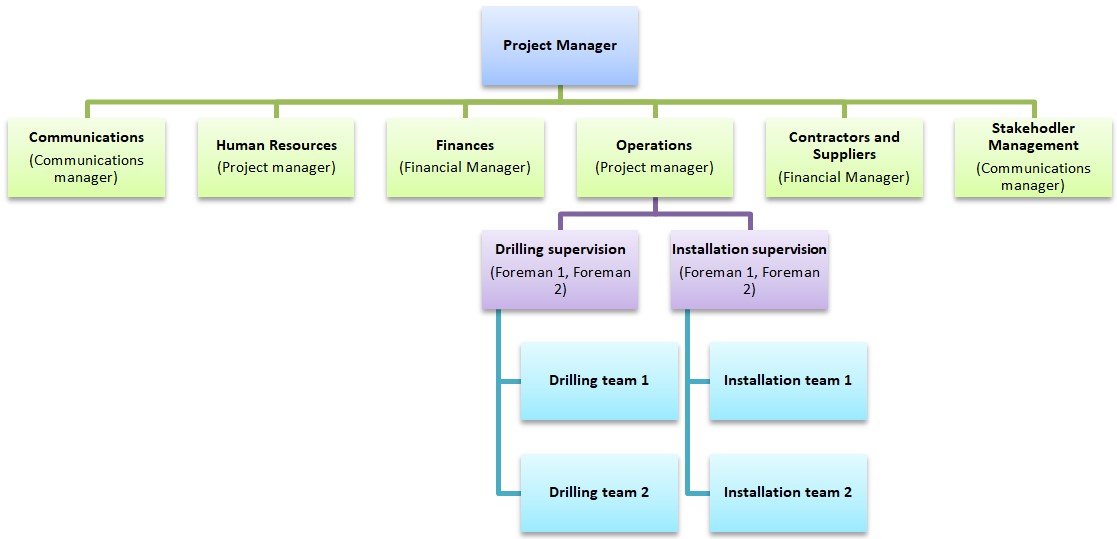
The functional organisational structure demonstrates that some of the key personnel had to carry joined functions. No significant problems emerged due to carrying these functions; however, it was still a matter of concern. The central problem was that both foremen had to be able to supervise both drilling and installation processes. Since Drillserv’s employees had no experience supervising the installation of solar panels, it was a significant risk that was not acknowledged before project implementation. Lack of experience in the sphere may have led to significant deviations in time management, costs, and quality. However, due to the selection of the best employees and close involvement of the key personnel in the supervision of the installation, all the problems were averted. It is recommended that Drillserv hires a designated foreman for the solar panel installation team to avoid risks.
Stakeholder Management
The project team used Mendelow’s Matrix as the central approach to stakeholder management. Mendelow’s Matrix divides the stakeholders into four categories depending on their level of power and interest in the project (Meredith and Mantel, 2011). All the stakeholders and their classifications are visualised in Table 2 below.
Table 2. Project’s Mendelow’s Matrix
Stakeholder management was one of the weakest points in managing the present project. The central problem was an inadequate acknowledgement of the stakeholders. The narration below discusses management stakeholders by group in Mendelow’s Matrix.
High Power – High Interest
This group was managed closely, which is recommended by Meredith and Mantel (2011). The communications manager and the project manager were always available for managers from Qatar Petrol and from Drillserv when the updates were needed. The needs of both companies, as well as the key personnel (communications manager and financial manager), were closely monitored by the project manager to ensure satisfaction with the flow of events. No significant issues were associated with the management of this group of stakeholders.
Low Power – High Interest
The suggested strategy for managing this group of stakeholders is to keep them informed about the flow of the project, as suggested by the stakeholder matrix (Meredith and Mantel, 2011). This was an adequate approach, and no significant issues emerged while managing this group of stakeholders. The only matter that could have been altered is the selection of suppliers for solar panels to lower the price, as was mentioned in Section 2.2.
Low Interest – Low Power
The stakeholders in this group were monitored, as was suggested by Mendelow’s Matrix (Meredith and Mantel, 2011). While the approach to stakeholder management was selected adequately, one of the stakeholders was not considered before the implementation of the project. In particular, the citizens living in nearby cities were not believed to have any impact or interest in the project. The issue that emerged during the implementation of the project was that local citizens started to demonstrate concern about drilling in the area due to environmental reasons. According to Obeidat, Al Bakri, and Elbanna (2020), the environmental concern among citizens of Qatar is growing fast. As a result, local citizens contacted environmental authorities and non-government organisations (NGOs) to check if drilling had no significant impact on the quality of the groundwater. As a result, the project and Qatar Petrol had experienced negative attention from the public. It was critical for Qatar Petrol to show corporate responsibility in terms of caring about the environment. Thus, such attention caused significant dissatisfaction from the customer. Even though the matter was quickly mitigated by the communications manager, the customer expressed concern about inadequate stakeholder management.
Low Interest – High Power
The goal of managing this group was to keep the stakeholders satisfied (Meredith and Mantel, 2011). The government and local authorities were satisfied by obtaining all the needed licenses and legal approvals. No problems were detected while managing this group of stakeholders.
Communications Management
The communications plan is provided in Table 3 below. No significant alterations to the initial communication plan were made. Communications management was a success, as it helped to mitigate numerous risks and react to all the emergencies timely.
Table 3. Communications plan
Risk Management
Risk management of the project was poor, as several risks were not acknowledged before the project implementations, which implies that they were not mitigated. The actual risks that the project faced are outlined in Table 4 below.
Table 4. Risk management strategy
The analysis of risk management demonstrates that two of the risks the project faced were unaccounted for, which led to a significant increase in the cost and duration of the project. Fortunately, these risks did not have a crucial impact on the profitability of the project and the requirements of the customer. It should also be mentioned that the risk of delays were not also mitigated properly, as assigning the best employees and conducting research was not enough, as even the best employees did not have the needed experience and the research only helped to gain theoretical knowledge. According to Panchatcharam and Naidu (2021), failure to acknowledge and mitigate such risks may lead to project failure, increased costs, and dissatisfaction of key stakeholders. Thus, it should be stated that risk management was inadequate.
Quality Management
The project team performed quality assurance by checking the quality of construction, equipment, and water from the well. The ongoing assessment of the project’s process was implemented by evaluating the quality of all the materials and technologies before utilisation. The drilling and building process were monitored for adherence to the technological process developed by experts. The project team announced penalties for low adherence to the standards, which ensured that the personnel understood the importance of the quality of their work. After the installation was finished, a thorough quality check was conducted by the project team, which revealed no significant issues. Thus, it may be concluded that quality management was adequate.
Summary and Recommendations
Even though the analysis of project activities revealed some significant flaws, the project may be considered successful. The three crucial signs of success were that the project had high profitability (the cost-to-benefit ratio was 1.68), the project was completed on time (42 days were spent with the client’s deadline of 45 days), and all the planned activities were completed with high quality. All the key stakeholders were satisfied with the project results despite some minor problems. The project team managed scope, time, finances, human resources, communications, and quality adequately. However, there were some problems detected with stakeholders and risk management. Several recommendations can be made to improve the project in the future.
- Negotiate with the customer about the timeframe. The analysis demonstrated that having only 45 days to drill ten wells was inadequate, as more time is required to account for possible risks and delays. This matter can be addressed by effective communication with the customer about the time allocated for the project.
- Hire more staff. Another way to decrease the risks of delays was to hire more installation teams and/or drilling teams. The project’s profit margin was above 40%, which is a very high profitability index. The project manager could have spent additional resources to mitigate the possible risks of delays.
- Hire specialised staff. The fact that the two hired foremen had to supervise the installation of both solar panels and pumping equipment may have led to significant deviations in quality or time frame. Since the budgetary constraint was not very tight, the project manager is recommended to hire supervisors specialising in different matters.
- Allow more time for quality assurance. The project team allocated only three days to quality assurance. Even though the team was forced to do so due to tight time constraints, it was still inadequate. The team is recommended to allow at least two days for possible changes that need to be made to address the possible quality issues. The project’s success was not affected by inadequate time allocation for quality assurance only because there were no problems found. This may not happen in the implementation of future projects.
- Mitigate the risk of dissatisfaction among locals. Even though the risk of locals being concerned with the drilling of new wells is minor, it should still be acknowledged the reactions of the locals are to be monitored. This is vital due to growing environmental concerns and the increased influence of environmental NGOs. In the project, failure to mitigate the risk led to minor dissatisfaction.
- Search for better suppliers. The cost of solar panels may be reduced if the project team finds better suppliers of such equipment. Thus, it is recommended that thorough market research is conducted for future projects of this kind.
- Consider outsourcing. It may be adequate to consider outsourcing the installation of solar panels, as it is not a specialisation of Drillserv. Contractors may provide a higher quality of services, as it is their specialisation (Aamer, 2018).
- Communicate closely. The primary reason for the project success was the best communication practices performed by the communications manager and the project manager. It was the central success factor, as it helped to mitigate the ongoing risks and ensure the satisfaction of all stakeholders. Thus, it is recommended that future projects pay similar attention to communications management.
Reference List
Aamer, A. M. (2018) ‘Outsourcing in non-developed supplier markets: a lean thinking approach’, International Journal of Production Research, 56(18), pp. 6048-6065.
Adeola, O. S. and Ganiyu, A. R. (2020) ‘A Fuzzy System for Evaluating Human Resources in Project Management, International Journal of Technology Diffusion (IJTD), 11(1), pp. 66-95.
Burghate, M. (2018) ‘Work breakdown structure: Simplifying project management, International Journal of Commerce and Management, 3(2), pp. 453-461.
Cocklin, J. (2020) Qatar starts drilling wells to feed planned LNG mega trains.
Dago, T. (2018). Reasons for Success and Failure of Projects [Thesis]. Web.
Drillserv (2021) About Drillserv.
Obeidat, S. M., Al Bakri, A. A., and Elbanna, S. (2020) ‘Leveraging “green” human resource practices to enable environmental and organisational performance: Evidence from the Qatari oil and gas industry’, Journal of Business Ethics, 164(2), pp. 371-388.
Qatar Petroleum (2019) Annual report 2018.
Meredith, J. R. and Mantel S. J. (2011) Project management: a managerial approach, 8th ed, Wiley.
Panchatcharam, M. and Naidu, R. J. (2021) ‘Emphasising the Importance of Project Management in CRO’s to Achieve Better Clinical Study Outcomes’, Saudi J Med Pharm Sci, 7(10), pp. 477-483.
San Cristóbal, J. R., Fernández, V., and Diaz, E. (2018) ‘An analysis of the main project organisational structures: Advantages, disadvantages, and factors affecting their selectionm’, Procedia Computer Science, 138, pp. 791-798.
Usmani, F. (2021) Cost-Benefit Analysis in Project Management.