Introduction
The commercialized natural gas production on the global level has increased from 2.1% to 2,819.4 Bcm (99.5 Tcf) as of the year 2005. Lately, there has been a considerable increase in gas production, thanks to the advent of cutthroat competition that exists in customary power and gas markets coupled with the lower prices (Dickey 2004). However, the advancement of technology has introduced Combined–Cycle Gas Turbine (CCGT) technology, which facilitated the enhancement of the economics of generating power from gas. CCGT has many advantages like markedly higher operating efficiencies and lower capital costs, which have offered natural gas as a viable alternative over the coal which has higher emission features (Tusiani and Shearer 2007, p.2).
This has increased the demand for LNG around the globe and natural gas exports rose to 680 Bcm (24 Tcf) which represented about 9% in 2004 and symbolized about one-fourth of total global consumption. However, as of date, about 74% of these exports are being made through pipeline deliveries. Out of aggregate of global natural gas consumption, LNG shares of about 6.6% (Tusiani and Shearer 2007, p.2). The global fleet of LNG ships was estimated at 21,000 million deadweight tons symbolizing an eight percent increase in just 3 years as of 2007 and this was about 2.4% of the aggregate of the global fleet. This will probably kindle the growth for LNG in the North American market. In the coming two decades, it is estimated that the global demand for this energy source will grow by 2.75%.
However, during the past decade, the costs of transportation and production had been slashed by 50% and the cost of re-gasification and sea transport declined by a quarter and by a third respectively. Major producers of LNG on an international level are known to be Russia, the US, UK, Canada, Indonesia and Algeria. Meanwhile, smaller producing nations like Latin America, the Middle East and Asia obtain natural gas as a result of their oil production (Branch 2007, p.65).
In this research essay, I will analyze some commercial and technical strategies most beneficial to facilitate the transportation of LNG with specialized designed LNG tankers and suggest to my management various support mechanisms; technical and commercial, that will enhance the fleet to reap the future viable business opportunity existing in the industry by purchasing another 6 LNG carriers each of which is less than 3 years old.
Analysis
The Lng Process
As known, natural gas cannot be shipped in its natural form. If a producer finds a larger volume of natural gas for which there is no demand in the local market, then he has to ship the same where there is a demand. In this case, the producer will be liquefying the natural gas at very low temperatures (-163° C) and then ship the LNG in specially designed tankers or carriers to target markets. One of the main advantages is that LNG can be pressurized to shrink to less than 1/600th in its gaseous form, thereby making it easier for storage and transportation in a more efficient way (Tusiani and Shearer 2007, p.3).
Construction of Lng Carriers
LNG carriers fall into categories of specialized ships and need major infrastructure facilities, professional workforce, highly advanced machinery, tough work schedule, and well–designed project scheduling. For instance, for a project of 145,000 m3 membrane tanker, the project needs about two and half years from signing of contract to completion and delivery of the carrier. However, the actual construction period is about one and a half years from steel cutting to delivery (Tusiani and Shearer 2007, p.151). There are two kinds of LNG carriers namely; membrane and moss vessels and these two types of LNG carriers have diverse critical paths during their construction process as they vary in physical and technical details.
Technical Evaluation: Lng Ships Containment Systems
Three types of the containment system are being used in the construction of LNG ships, and they are as follows:
- Gas Transport Technigas (GTT ) membrane type
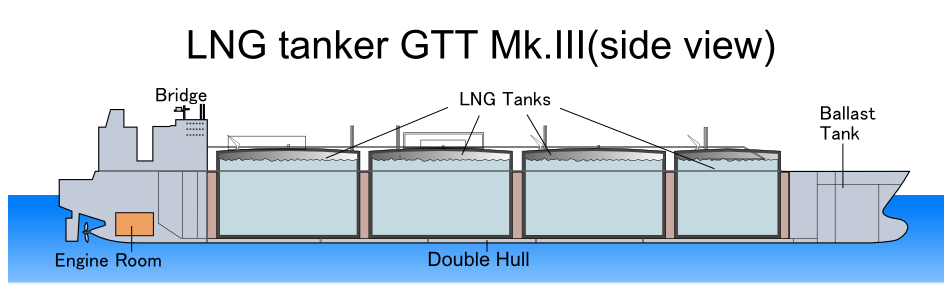
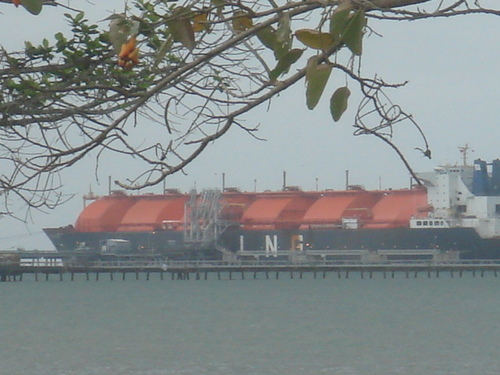
- Kvaerner –Moss Spherical System
- “IHI Structural Prismatic plan”
The GTT structure is popularly used almost in 50% of the LNG ships in operation as of the year 2007 and is also likely to be employed in about eighty-five percent of those LNG ships that are likely to be delivered during the period 2007 to 2010. As of 2006, about 45% of LNG ships in operation were using the Moss system. However, in April 2007, a memorandum of understanding was linked between the Korea shipbuilder’s Association and the Korea Gas Corp to develop a membrane-type system known as KC-1 to compete with the GTT system (Hilyard 2009, p.377).
Technical Evaluation -Standards of Construction for Lng Carriers
According to the International Gas Carrier Code (IGC Code) published by the IMP in 1976 to offer an international standard of construction. The code specifies design parameters for the cargo carriers, location of tanks, acknowledged usage of construction materials, boil-off, piping arrangements, safety arrangements and cargo-handling needs. Contemporarily, the classification societies and government bodies of major maritime nations enforced and administered the IGC code. Furthermore, the IGC code also prescribes a very stiff safety code; and owing to this, there has been unmatched safety record of LNG carriers as of today (Tusiani and Shearer 2007, p.153). In addition, LNG ships have to be certified by one of the following recognized International Classification Societies like the Bureau of Veritas, “American Bureau of Shipping, “the “Det Norske Veritas,” and Lloyd’s Register (Thorndike 2007, p. 81).
Technical Evaluation -Size of the Lng Carriers
As the global demand for LNG gets larger, LNG tankers have to increase their cargo size, especially to meet the increasing servicing guidelines for these plants. The sizes of the LNG ships were between 80000 m3 to 100,000 m3 in the 1970s. Qatar announced in February 2005 that it had placed an order for four LNG ships, each with a capacity of 216,000 m3, costing $225 million each (Lemmers 2009, p.106). The increase in LNG ship size is mainly due to an increase in demand for LNG, particularly in Europe and USA and the necessity to bring down long haul transport costs from the Middle East to the USA (Rosendahl and Sagen 2009, p.17). Nevertheless, LNG ships are limited to an upper ceiling of about 155,000 cubic meters by existing port facilities. The larger-sized LNG ships, therefore, are restricted to particular projects, which include either the building of new terminals specifically designed to handle these carriers or the construction of cargo tanks for LNG offshore floating units (Branch 2007, p.155). More so, offloading and loading facilities and safety issues act as a barrier to increasing the size of the LNG carriers beyond 250,000 m3 (Chandra 2006).
Lng Delivery Operations
Majority of the LNG manufacturers will like to have their own devoted fleet of LNG carriers functioning as a “virtual pipeline”. A sister ship may be discharging its cargo to a client’s port, whereas another ship may be loaded at the same point and the remaining carriers are either way back to the LNG plant to load new cargo or to the buyer’s regasification facility ( Chandra 2006, p.61).
Qatar is playing a dominant role in owning LNG carriers and is also considered to be the leader in increasing its own equity stake in the downstream portions of the LNG chain at global level as of date. Qatar has placed orders for about seventy LNG ships, focusing to be the largest LNG carrier operator at the global level. Furthermore, Qatar is also increasing its equity stake in major LNG terminals in the UK, some parts of Europe and the United State. Qatar is partnering with Exxon Mobil in the USA in their $600 million 1-bed terminals, which would have commenced its operations in the year 2009 (Chandra 2006, p.145).
Statistics About Lng Carriers
As of 2007, there are about 200 LNG carriers that are operating around the world and owned by 22 nations; the majority are from Malaysia, Japan, Europe, Liberia, Panama and Bermuda. From the year 2006, there are about a hundred new carriers in the construction process at nine shipyards that construct LNG ships in Japan, South Korea, China and Europe. The cost of construction of LNG carriers has declined from a reported high price in the middle of the 1990s of $280 million. The LNG carriers that can ship a typical 145,000cm³ of LNG are costing less as of date somewhere around $150 to $160 million. Furthermore, large-sized vessels of 210,000cm³ are now priced around $260 million (Thorndike 2007, p.81).
Nevertheless, the cost of a newly constructed LNG ship has now exceeded about $200 million. The trend towards the demand for larger vessels is prolonged. (Hilyard 2009:374).
According to statistics as of September 30, 2007, BS Energy Services demonstrated the recent developments in the market of the fleet of LNG ships on orders placed and recent deliveries.
Table 1: Statistics on Fleet of LNG Carrier and Dispatches
Table II:

Lng Transportation Hazards
A narration of accidents involving LNG carriers was given by Lakey and Thomas (1983). Another research study carried out by L.N Davis in 1979 narrates episodes with both LPG and LNG carriers. LNG Carrier EI Paso Paul Kayser on 29 June 1979 ran aground at Gibraltar. The carrier’s bottom plating on the side of the starboard ripped off and deformed. However, in this accident, both the secondary and primary containment barriers of the Gas Transport containment remained liquid tight. On 12 December 1980, LNG Taurus ran aground at Mutsure Anchorage in Japan. Though, the damage at initial stage was less, but it was aggravated four days aground. On 16th December 1981, the worst damage happened to El Paso Columbia near Cape Sable in Nova Scotia. Though, one cargo tank and the engine room were flooded, but the carrier was in ballast.
Furthermore, there have been many instances of LNG spills on the decks of the LNG ships. Fracture of the mild steel deck of the Methane Princess occurred in 1965 due to a small LNG spill. Descartes, another LNG ship also suffered a deck fracture due to an LNG overfilling in the year 1965. Cargo tank rupture was also experienced by LNG carriers in general. Polar Alaska experienced a rupture on a cargo tank due to aggressive sloshing of the LNG liquid. Arctic Tokyo witnessed cracking of a cargo tank due to sloshing in 1970. There have been many instances of lightning strikes followed by fires on LNG ships (Vanem et al 2008, p.1329). Methane Progress suffered fire due to a lightning strike on 25 December 1964 after loading at Arzew. Unfortunately, the same carrier suffered fire by lightning in 1965 also. LNG Aquarius suffered from fire due to lightning while unloading at Tobata, in Japan. Jules Verne also experienced the fire due to lightning. (Mannan and Lees 2005:23/77).
Commercial Strategy
Future Market for Lng Carriers
The Pacific Rim region has built almost all the LNG ships that entered the market from 2002 to 2006. By the year 2012, about 195 new LNG carriers are expected to enter into the market that would be built in Pacific Rim countries symbolizing an apex of more than $41.5 billion. In the coming years, the average price of an LNG ship is estimated at $162 million, which mirrors the cutthroat rivalry among shipyards in eastern Asia, especially in Korean market. However, demand for new LNG carriers has increased many folds. The anticipated lead times for orders are in the range of 4 or 5 years (Hilyard 2009, p.374). In regards to the estimate made by the US Naval War College, China aims to become the leader of the LNG ship construction by the year 2015 (Grubb and Collins 2008, p.44). The Chinese government is encouraging the Chinese shipbuilders to construct more sophisticated ships including LNG carriers (Hilyard 2009, p.374).
Future Demand for Lng Carriers
The sudden surge in LNG transportation has resulted in an unmatched demand for new LNG carriers. At present, the globe’s principal LNG exporters are the following:
- Indonesia ( 28.5 * 10 6 metric tons)
- Algeria ( 19 * 10 6 tons)
- Malaysia (15 * 106 tons)
The above three nations putting together produce about seventy percent of global total LNG production. New LNG producers and exporters are emerging constantly and hence there is very good demand for LNG carriers in the future (Tsinker 2004, p.4).
At the international level in 2004, it was estimated that there were about 175 LNG carriers with a capacity of 21 million MT/ year. If taken into account the increased share of gas in the international energy mix, the number of new orders for LNG ships swelled from just 56 in 2004 to about 107 carriers in 2005, a 100% increase over the previous year. Experts are of the view that based on the current consumption pattern; LNG demand will be soaring to about 200 million MT/per annum in 2010. (Hydrocarbon Processing 2005) This increased demand for LNG will pave the way to the introduction of extra 161 new vessels into the international LNG carrier market from 2005 to 2010. This will increase the LNG ship fleet to 336 at the end of the year 2010. This anticipated increase in the demand for LNG careers simply denotes the increase in the demand for gas. Thus, the increase in the demand for LNG and as the same have to be transported from one end of the globe to the other end of the globe, will result in the introduction of larger vessels of 145,000 m3 to 250,000 m3, which will reap the economies of scale and will enhance the profitability of the transporting company (Ariweriokuma 2008, p.188).
Future Market for Lng
According to experts, the international market for LNG trade is estimated to increase over the next twenty-five years. As per the” International Energy Agency World Energy Outlook 2006, (IEA WEO 2006)”, LNG will form about seventy percent of the increase in 2030 in the inter-regional trade and LNG export will increase from 90 bcm in 2004 to 470 bcm in 2030. (IEA WEO 2006).
LNG has been regarded as a regional fuel as the major portion of the LNG produced is consumed within the region where it is extracted. For instance, as per the LNG Trade Data for the period from 1995 to 2005, the suppliers both in the Asia/Pacific regions and in the Atlantic regions contributed over ninety-nine percent of their delivery to markets in the same region. Thus, the North America Region, especially, the United States is anticipated to witness the biggest increase in importing of LNG over the projection phase. (IEA WEO 2006).
As per IEA WEO 2006 estimates, the global natural resources are adequate enough to cater for the projected increases in demand up to 2030, which is more than the 50% of the resources which are seen in just three nations namely Qatar, Iran and Russia. Further, the Africa and the Middle East will account for seventy-two percent of the increase in the exports of LNG by 2030 mainly to supply to North America and European markets. In the last five years, global demand for LNG except North American market increased by 3% and the analogs demand growth is estimated for the succeeding five years with increasing demand anticipated from growing economies like India, China and the Middle East, which are using gas as a substitute for the coal and oil and using the LNG for manufacturing power. (Alfadala et al. 2009, p37).
IEO WEO survey conducted in 2006 estimated the demand from North America and concluded that the supply of natural gas from indigenous sources in the North American region will not keep match over the estimation period and as a result, it identified that there will be a great demand for LNG in the USA in the years ahead.
Venezuela is expected to turn out to be an important LNG supplier to Europe and North America in the coming years. During the projection period, China is expected to import LNG from Central Asia, Russia, the Middle East and Australia during the projection period.
Though Russia is having enormous LNG reserves, Russian supply is anticipated to grow less rapidly since much of the Russian gas is theoretically intricate to extract and has to cross many obstacles for transporting to market. However, Russia is also seen as another probable major supplier to the Asian market before 2030. Recently, Russia’s Gazprom announced its maiden entry into the North American markets. Further, by 2014, Gazprom is planning to supply LNG to Rabaska terminal, which is being constructed in Levis, Quebec.
According to experts, the US LNG market is not a “demand-pull” market but is only a “supply-push” one. In this category of the market, other parts when they need LNG will source heavily since they do not have a significant storage facility as the US will attract LNG supplies when there is low demand. Thus, according to Credit Suisse LNG report, US is able to attract LNG supplies, especially during the low demand time period and will absorb the world’s excess when there is no place to store it. While future shipments to the USA will basically rest on the relative price and demand around the world, the fundamental need for LNG in the US remains strong (Alfadala et al. 2009, p35).
Shortly, the increasingly global needs of energy have to be met by producing more energy to cater to the demand but at the same time, restricting and even reducing greenhouse gas emissions (Burden et al. 2009, p.55). Hence, reliability on coal and oil is going to be minimized and at the same time, it will place more emphasis on LNG consumption (Weirauch 2007, p.21). Thus, increased LNG business will make the distinct regional markets to be more integrated since contract terms and pricing are more flexible. Although, environmental and safety issues will restrict importation optionality in certain markets, like that of the USA, LNG is no doubt will become a significant component in the international energy supply mix. Thus, the vibrant of the evolving LNG markets will influence that LNG, and will indeed become the fuel for the twenty-first Century (Alfadala et al. 2009, p.41).
The Profitability of Lng Carrier Business
LNG carrier business is highly profitable. An LNG ship will be chartered by a supplier and thus, revenue generation is secured throughout the year. The following illustration of BG Group Plc’s financial reveals how profitable the LNG business is.
BG Group PLC-Financials
This fast-growing British LNG carrier company is at the front position of the LNG development business. BG Group Plc owns about twenty-six percent stakes in the Tobago and Trinidad LNG facility that presently supplies about forty-one percent of US LNG imports. BG Group also owns either part or all of three major U.S import terminals. In U.S alone, BG Group handles a formidable percentage of LNG imports. These tactical owning contributed about sixteen percent of increase in revenues in the year 2005 alone (Plunkett, 2007).
Teekay Corporation (TK) is a provider of transportation services of LNG and crude oil. It has a fleet of 175 vessels and has offices in 17 nations. TKs LNG segment chiefly contains LNG carriers subject to fixed-rate, long-run time-charter contracts. As of 31st December 2008, TK owned fourteen LNG ships and has ordered another five new LNG ships, which are under construction. During 2008, about nine percent of the total net revenue of TKs have comprised the revenue earned by the LNG carriers.
Commercial Evaluation of Second-Hand Lng Vessels
Commercial Strategy
Funding of Second-hand LNG carriers will not be an issue as there is a heavy demand for LNG ships as per the details given below:
Since the above shipping companies have ordered for new 63 LNG Carriers , it demonstrates that LNG shipping business will be more profitable and revenue. Revenue is assured for LNG carriers as the global LNG demand is likely to increase by at least 100% by 2015.
Taiwan LNG imports have soared by ninety percent in January 2010 as compared to January 2009. According to BP, European LNG imports are likely to have about 100 percent increases in 2020. Natural gas is being used as fuel in about sixty-four million American families in their homes.
According to China Daily (2010), during 2009, new terminals like Shanghai LNG started their operations. China is anticipated to double its LNG imports to twelve million tonnes in the year 2010 from the 5.53 million imported in 2009.
Since , there is assured demand for LNG ships in the future due to increase in LNG demand, I am of the view that financing for second-hand LNG carriers will not be an issue at all. The future revenues generated from LNG ships will be used to fund the installment of loan availed and also can service the financial charges. Financing can be done through global financial advisors on LNG ships and through commercial banks and financial institutions.
Our company may go for long-time charters or spot cargo basis for the second-hand LNG vessels to be acquired. We can also tap export credits, bond markets, bank finance for financing our six numbers of LNG ships as what has been done by Nakilat Inc in funding their LNG vessels thereby achieving a ninety percent of gearing and tenors of up to twenty-seven years from financial closure. Since our group is already in the LNG carrier business and with good financial track records, we can also get ratings from Fitch, Moody’s and S&P for obtaining finance for the second-hand vessels from banks, financial institutions and commercial banks. (AME Info 2007).
The life of the tankers employed in LNG shipping business extends about 40 years. With extension of every new contract, LNG ships need not be replaced. Hence, “second-hand tankers” began to surface in the shipping market. It is to be observed that the average life of LNG ships as of today is about fourteen years. By the close of 2010, only about four ships of the present fleet would be dismantled. A total number of scrapped ships from the year 1964 to 2010 is just seven only. Further, about twenty–one LNG ships have changed ownership from the period 1965 to 1996, This corroborates that there is high prosperity for shipping companies if they employ second-hand LNG ships. (Case Business School 2009).
Findings and Conclusion
By the year 2012, about 195 new LNG carriers are expected to enter into the market that would be built in Pacific Rim countries symbolizing a capex of more than $41.5 billion. In the coming years, the average price of an LNG ship is estimated at $162 million, which mirrors the cutthroat rivalry among shipyards in eastern Asia, especially in the Korean market. As per the estimate made by the US Naval War College, China aims to become the leader of the LNG ship construction by the year 2015. The sudden surge in LNG transportation has resulted in an unmatched demand for new LNG carriers. New LNG producers and exporters are emerging constantly and hence there is a very good demand for LNG carriers in the future (Tsinker 2004, p.4).
Out of aggregate of global natural gas consumption, LNG shares of about 6.6% (Tusiani and Shearer 2007, p.2). In the coming two decades, it is estimated that global demand for this energy source will grow by 2.75%.
Experts are of the view that based on the current consumption pattern: LNG demand will be soaring to about 200 million MT/per annum in 2010. This increased demand for LNG will pave the way to the introduction of extra 161 new vessels into the international LNG carrier market from 2005 to 2010. This will increase the LNG ship fleet to 336 at the end of the year 2010. This anticipated increase in the demand for LNG careers simply denotes the increase in the demand for gas. Thus, the increase in the demand for LNG and as the same have to be transported from one end of the globe to the other end of the globe, will result in the introduction of larger vessels of 145,000 m3 to 250,000 m3, which will reap the economies of scale and will enhance the profitability of the transporting company (Ariweriokuma 2008, p.188).
As per the” International Energy Agency World Energy Outlook 2006, (IEA WEO 2006)”, LNG will form about seventy percent of the increase in 2030 in the inter-regional trade and LNG export will increase from 90 bcm in 2004 to 470 bcm in 2030 (IEA WEO 2006).
In the last five years, global demand for LNG except North American market increased by 3% and the analogs demand growth is estimated for the succeeding five years with increasing demand anticipated from growing economies like India, China and Middle East, which are using gas as a substitute for the coal and oil and using the LNG for manufacturing power (Allandale et al. 2009, p.37).
Venezuela is expected to turn out to be an important LNG supplier to Europe and North America in the coming years. During the projection period, China is expected to import LNG from Central Asia, Russia, the Middle East and Australia during the projection period.
Russia is also seen as another probable major supplier to the Asian market before 2030. Recently, Russia’s Gazprom announced its maiden entry into the North American markets. In addition, by 2014, Gazprom is planning to supply LNG to Rabaska terminal, which is being constructed in Levis, Quebec.
However, there are also risks involved in the transportation business of LNG. A narration of accidents involving LNG carriers was given by Lakey and Thomas (1983). Furthermore, there have been many instances of LNG spills on the decks of the LNG ships (Wright 2006, p.11). There have been many instances of lightning strikes followed by fires on LNG ships; however, these business risks are inherent in every business and this risk can be mitigated by availing insurance covers.
Thus, in an LNG, will, indeed, become the fuel for the twenty-first Century (Alfadala et al. 2009, p.41). In view of the above findings, I strongly suggest that our company should purchase 6 LNG tankers, each of which is less than 3years old, though all have been trading intermittently during this poor economic spell. This will enable us to be stronger in the LNG transportation business and will boost our company profitability in the coming years.
Reference Lists
Alfadala, H. E, Reklaitis, G. V. R and El-Halwagi M. M, 2009. Gas Processing Symposium: 2009, New York: Elsevier.
AME Info.com (2007). Qatar’s Nakilat Financing Sets New Benchmarks. Web.
Ariweriokuma, S. 2008. The Political Economy of Oil and Gas in Africa. The Case of Nigeria, New York: Taylor and Francis.
Branch, A E. 2007. Element of Shipping, New York: Taylor and Francis.
Burden, J., Pepper, W., and Aggarwal, V. 2009. The Impact of High Oil Prices on Global and Regional Natural Gas and LNG Markets. Energy Journal, 55-71.
Case Business School. (2009). LNG Markets. Liquidity and Globality. Web.
Chandra, V., 2006. Fundamental of Natural Gas: An International Perspective, London: Pennwell Books.
Dickey, C. (2004). The Next New Oil Is a Gas. Newsweek, 144(12), E28-E30. Web.
Grubb, M., and Collins, G. (2008). CHINESE SHIP BUILDING GROWING FAST, BUT HOW GOOD IS IT? U.S. Naval Institute Proceedings, 134(3), 44-51.
Hilyard, J., 2009. 2008 International Petroleum Encyclopedia, London: Pennwell Books.
Hydrocarbon Processing, 2005. LNG spending to surge. Hydrocarbon Processing, 84(5), 7.
Lemmers, S., 2005. LNG receiving and regassification terminal operations. Hydrocarbon Processing, 84(7), 55-61.
Lemmers, S., 2009. Designing the LNG terminal of the future. Hydrocarbon Processing, 88(9), 105-111.
Mannan, S., and Lees, F. P., 2005. Lee’s Loss Prevention in the Process Industries: Hazard, Volume I. New York: Taylor and Francis.
Plunkett J. W., 2008. Plunkett’s Energy Industry Almanac -2007, New York: Plunkett Research Ltd.
Rosendahl, K., and Sagen, E., 2009. The Global Natural Gas Market: Will Transport Cost Reductions Lead to Lower Prices? Energy Journal, 30(2), 17-39.
Thorndike, V., 2007. LNG: A Level –Headed Look at the Liquefied Gas Controversy, New York: Down East Enterprise Inc.
Tsinker, G. P., 2004. Port Engineering: Planning, Construction, Maintenance and Security, London: John Wiley & Sons.
Tusiani, M. D., and Shearer, G., 2007. LNG: A Non-technical Guide, London: Pennwell Books.
Vanem, E. et al., 2008. Analysing the risk of LNG carrier operations. Reliability Engineering and System Safety, 93(9), 1328-1344.
Weirauch, W., 2007. Massive growth forecast in global LNG expenditures. Hydrocarbon Processing, 86(8), 21.
Wright, T., 2006. LNG spill safety: Don’t let wool be pulled over one’s eyes. Hydrocarbon Processing, 85(3), 11.